| Multiple Linear Regression - Estimated Regression Equation |
| Y[t] = + 7218.81321367391 + 0.168547715381535X[t] + 0.979872427652679Y1[t] + 0.137046798716369Y2[t] + 0.0699500275999237Y3[t] -0.406984626398871Y4[t] -1804.08726665933M1[t] + 1408.97397886702M2[t] + 18831.5706048898M3[t] -822.813077601211M4[t] -8320.63177610417M5[t] -14608.2217206370M6[t] -4583.64714859553M7[t] + 5149.13242714079M8[t] + 5625.48810387275M9[t] + 1211.36402069791M10[t] -3453.02634995847M11[t] + 72.3725529323416t + e[t] |
| Multiple Linear Regression - Ordinary Least Squares | |||||
| Variable | Parameter | S.D. | T-STAT H0: parameter = 0 | 2-tail p-value | 1-tail p-value |
| (Intercept) | 7218.81321367391 | 13548.296059 | 0.5328 | 0.596779 | 0.29839 |
| X | 0.168547715381535 | 0.096425 | 1.748 | 0.087291 | 0.043645 |
| Y1 | 0.979872427652679 | 0.13895 | 7.052 | 0 | 0 |
| Y2 | 0.137046798716369 | 0.202669 | 0.6762 | 0.502368 | 0.251184 |
| Y3 | 0.0699500275999237 | 0.208433 | 0.3356 | 0.738733 | 0.369367 |
| Y4 | -0.406984626398871 | 0.142958 | -2.8469 | 0.006629 | 0.003314 |
| M1 | -1804.08726665933 | 2222.876655 | -0.8116 | 0.421293 | 0.210647 |
| M2 | 1408.97397886702 | 2207.660013 | 0.6382 | 0.526565 | 0.263282 |
| M3 | 18831.5706048898 | 4106.988387 | 4.5853 | 3.6e-05 | 1.8e-05 |
| M4 | -822.813077601211 | 5548.036122 | -0.1483 | 0.882763 | 0.441382 |
| M5 | -8320.63177610417 | 4502.43792 | -1.848 | 0.071177 | 0.035588 |
| M6 | -14608.2217206370 | 3618.16973 | -4.0375 | 0.000208 | 0.000104 |
| M7 | -4583.64714859553 | 2233.34681 | -2.0524 | 0.045978 | 0.022989 |
| M8 | 5149.13242714079 | 2384.700257 | 2.1592 | 0.0362 | 0.0181 |
| M9 | 5625.48810387275 | 2819.12521 | 1.9955 | 0.052067 | 0.026033 |
| M10 | 1211.36402069791 | 2713.917192 | 0.4464 | 0.657483 | 0.328742 |
| M11 | -3453.02634995847 | 2233.000971 | -1.5464 | 0.129022 | 0.064511 |
| t | 72.3725529323416 | 68.622167 | 1.0547 | 0.297214 | 0.148607 |
| Multiple Linear Regression - Regression Statistics | |
| Multiple R | 0.985779580101678 |
| R-squared | 0.97176138054544 |
| Adjusted R-squared | 0.961093457640385 |
| F-TEST (value) | 91.0919013189444 |
| F-TEST (DF numerator) | 17 |
| F-TEST (DF denominator) | 45 |
| p-value | 0 |
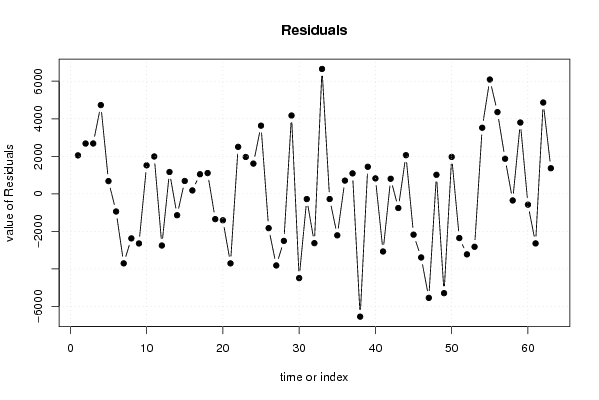
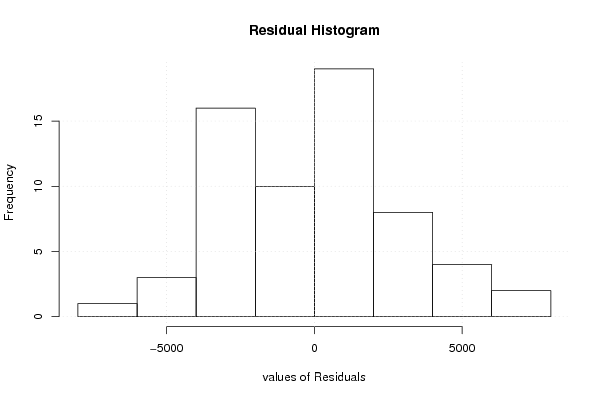
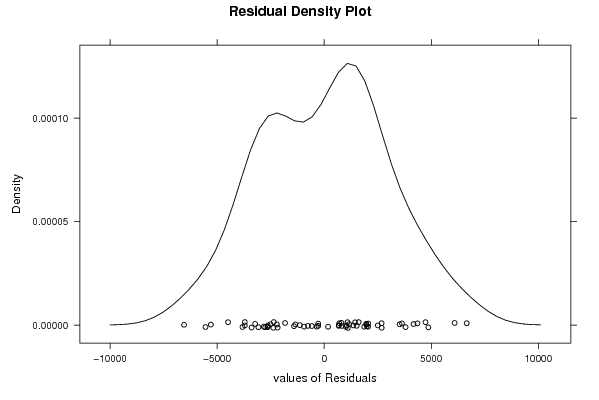
| Multiple Linear Regression - Residual Statistics | |
| Residual Standard Deviation | 3446.92213769629 |
| Sum Squared Residuals | 534657250.050334 |
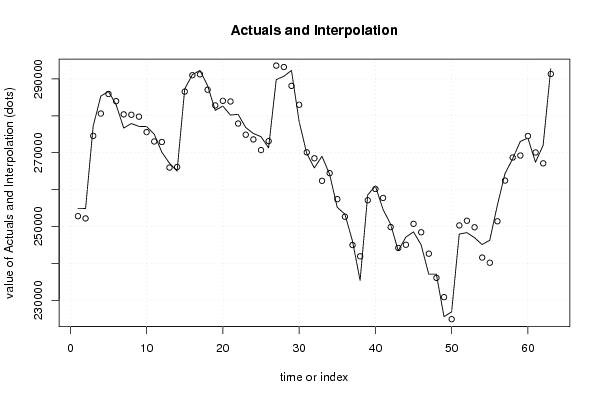
| Multiple Linear Regression - Actuals, Interpolation, and Residuals | |||
| Time or Index | Actuals | Interpolation Forecast | Residuals Prediction Error |
| 1 | 254844 | 252795.7141966 | 2048.28580340013 |
| 2 | 254868 | 252187.927606741 | 2680.07239325895 |
| 3 | 277267 | 274583.893420713 | 2683.10657928659 |
| 4 | 285351 | 280621.154888941 | 4729.84511105919 |
| 5 | 286602 | 285925.018788635 | 676.981211364627 |
| 6 | 283042 | 283983.32302366 | -941.323023660072 |
| 7 | 276687 | 280392.144806243 | -3705.14480624268 |
| 8 | 277915 | 280289.709133675 | -2374.70913367484 |
| 9 | 277128 | 279771.810018893 | -2643.8100188928 |
| 10 | 277103 | 275585.276989321 | 1517.7230106786 |
| 11 | 275037 | 273046.932306098 | 1990.06769390194 |
| 12 | 270150 | 272904.044975779 | -2754.0449757791 |
| 13 | 267140 | 265975.148489936 | 1164.85151006359 |
| 14 | 264993 | 266133.905387976 | -1140.90538797611 |
| 15 | 287259 | 286573.775342432 | 685.224657568355 |
| 16 | 291186 | 291005.35695062 | 180.643049380156 |
| 17 | 292300 | 291256.539599500 | 1043.46040050027 |
| 18 | 288186 | 287079.645045988 | 1106.35495401205 |
| 19 | 281477 | 282824.689859679 | -1347.68985967947 |
| 20 | 282656 | 284065.812669368 | -1409.81266936802 |
| 21 | 280190 | 283895.658275904 | -3705.65827590387 |
| 22 | 280408 | 277905.140952128 | 2502.85904787243 |
| 23 | 276836 | 274872.270618276 | 1963.72938172408 |
| 24 | 275216 | 273605.301148200 | 1610.69885180037 |
| 25 | 274352 | 270720.137124471 | 3631.86287552912 |
| 26 | 271311 | 273139.062255319 | -1828.06225531923 |
| 27 | 289802 | 293618.182413021 | -3816.18241302057 |
| 28 | 290726 | 293233.44804961 | -2507.44804960997 |
| 29 | 292300 | 288127.907274778 | 4172.09272522187 |
| 30 | 278506 | 282995.099444134 | -4489.09944413378 |
| 31 | 269826 | 270105.143575825 | -279.143575824519 |
| 32 | 265861 | 268489.656677261 | -2628.65667726102 |
| 33 | 269034 | 262379.882691043 | 6654.11730895658 |
| 34 | 264176 | 264453.743995432 | -277.743995432311 |
| 35 | 255198 | 257409.033204932 | -2211.03320493236 |
| 36 | 253353 | 252648.156566013 | 704.843433987028 |
| 37 | 246057 | 244968.557189578 | 1088.44281042175 |
| 38 | 235372 | 241916.096192795 | -6544.09619279472 |
| 39 | 258556 | 257115.130442461 | 1440.86955753896 |
| 40 | 260993 | 260171.443948526 | 821.556051474032 |
| 41 | 254663 | 257734.617413691 | -3071.61741369118 |
| 42 | 250643 | 249840.099068033 | 802.900931967098 |
| 43 | 243422 | 244179.406639836 | -757.406639836445 |
| 44 | 247105 | 245046.237912857 | 2058.76208714311 |
| 45 | 248541 | 250716.211528677 | -2175.21152867679 |
| 46 | 245039 | 248429.74814862 | -3390.74814861993 |
| 47 | 237080 | 242623.015177727 | -5543.01517772657 |
| 48 | 237085 | 236069.377646962 | 1015.62235303814 |
| 49 | 225554 | 230845.648026832 | -5291.64802683159 |
| 50 | 226839 | 224870.770037319 | 1968.22996268103 |
| 51 | 247934 | 250290.670379149 | -2356.67037914903 |
| 52 | 248333 | 251557.596162303 | -3224.59616230341 |
| 53 | 246969 | 249789.916923396 | -2820.91692339559 |
| 54 | 245098 | 241576.833418185 | 3521.1665818147 |
| 55 | 246263 | 240173.615118417 | 6089.38488158311 |
| 56 | 255765 | 251410.583606839 | 4354.41639316078 |
| 57 | 264319 | 262448.437485483 | 1870.56251451689 |
| 58 | 268347 | 268699.089914499 | -352.089914498789 |
| 59 | 273046 | 269245.748692967 | 3800.25130703291 |
| 60 | 273963 | 274540.119663046 | -577.119663046446 |
| 61 | 267430 | 270071.794972583 | -2641.79497258300 |
| 62 | 271993 | 267128.23851985 | 4864.76148015008 |
| 63 | 292710 | 291346.348002224 | 1363.65199777570 |
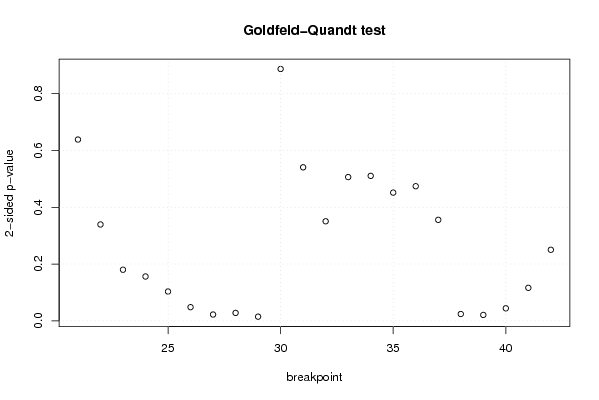
| Goldfeld-Quandt test for Heteroskedasticity | |||
| p-values | Alternative Hypothesis | ||
| breakpoint index | greater | 2-sided | less |
| 21 | 0.319239655639428 | 0.638479311278856 | 0.680760344360572 |
| 22 | 0.169675826861434 | 0.339351653722867 | 0.830324173138566 |
| 23 | 0.0899781845661812 | 0.179956369132362 | 0.910021815433819 |
| 24 | 0.0780361291502273 | 0.156072258300455 | 0.921963870849773 |
| 25 | 0.0515962612508533 | 0.103192522501707 | 0.948403738749147 |
| 26 | 0.0240126202165777 | 0.0480252404331554 | 0.975987379783422 |
| 27 | 0.0110439884566817 | 0.0220879769133634 | 0.988956011543318 |
| 28 | 0.0139006034451061 | 0.0278012068902123 | 0.986099396554894 |
| 29 | 0.00731535419282779 | 0.0146307083856556 | 0.992684645807172 |
| 30 | 0.556400584084393 | 0.887198831831213 | 0.443599415915607 |
| 31 | 0.72967165242256 | 0.54065669515488 | 0.27032834757744 |
| 32 | 0.824730249431538 | 0.350539501136924 | 0.175269750568462 |
| 33 | 0.746839168014795 | 0.50632166397041 | 0.253160831985205 |
| 34 | 0.744707248963615 | 0.51058550207277 | 0.255292751036385 |
| 35 | 0.774218277962092 | 0.451563444075816 | 0.225781722037908 |
| 36 | 0.762960051580608 | 0.474079896838784 | 0.237039948419392 |
| 37 | 0.82216189163896 | 0.35567621672208 | 0.17783810836104 |
| 38 | 0.988037698876924 | 0.023924602246151 | 0.0119623011230755 |
| 39 | 0.989658288967638 | 0.0206834220647247 | 0.0103417110323624 |
| 40 | 0.977987681743668 | 0.0440246365126648 | 0.0220123182563324 |
| 41 | 0.941904380331292 | 0.116191239337415 | 0.0580956196687076 |
| 42 | 0.874895047389138 | 0.250209905221723 | 0.125104952610861 |
| Meta Analysis of Goldfeld-Quandt test for Heteroskedasticity | |||
| Description | # significant tests | % significant tests | OK/NOK |
| 1% type I error level | 0 | 0 | OK |
| 5% type I error level | 7 | 0.318181818181818 | NOK |
| 10% type I error level | 7 | 0.318181818181818 | NOK |