Free Statistics

of Irreproducible Research!

Author's title

Author*The author of this computation has been verified*
R Software Modulerwasp_multipleregression.wasp
Title produced by softwareMultiple Regression
Date of computationMon, 30 Nov 2009 11:53:33 -0700
Cite this page as followsStatistical Computations at FreeStatistics.org, Office for Research Development and Education, URL https://freestatistics.org/blog/index.php?v=date/2009/Nov/30/t1259607313bq68yb9dset0eft.htm/, Retrieved Wed, 01 May 2024 17:27:37 +0000
Statistical Computations at FreeStatistics.org, Office for Research Development and Education, URL https://freestatistics.org/blog/index.php?pk=61861, Retrieved Wed, 01 May 2024 17:27:37 +0000
QR Codes:

Original text written by user:
IsPrivate?No (this computation is public)
User-defined keywords
Estimated Impact180
Family? (F = Feedback message, R = changed R code, M = changed R Module, P = changed Parameters, D = changed Data)
-     [Multiple Regression] [Q1 The Seatbeltlaw] [2007-11-14 19:27:43] [8cd6641b921d30ebe00b648d1481bba0]
- RM D  [Multiple Regression] [Seatbelt] [2009-11-12 14:14:11] [b98453cac15ba1066b407e146608df68]
- R  D      [Multiple Regression] [] [2009-11-30 18:53:33] [d41d8cd98f00b204e9800998ecf8427e] [Current]
Feedback Forum

Post a new message
Dataseries X:
254844	281818	258863	264777	267366	267413
254868	287854	254844	258863	264777	267366
277267	316263	254868	254844	258863	264777
285351	325412	277267	254868	254844	258863
286602	326011	285351	277267	254868	254844
283042	328282	286602	285351	277267	254868
276687	317480	283042	286602	285351	277267
277915	317539	276687	283042	286602	285351
277128	313737	277915	276687	283042	286602
277103	312276	277128	277915	276687	283042
275037	309391	277103	277128	277915	276687
270150	302950	275037	277103	277128	277915
267140	300316	270150	275037	277103	277128
264993	304035	267140	270150	275037	277103
287259	333476	264993	267140	270150	275037
291186	337698	287259	264993	267140	270150
292300	335932	291186	287259	264993	267140
288186	323931	292300	291186	287259	264993
281477	313927	288186	292300	291186	287259
282656	314485	281477	288186	292300	291186
280190	313218	282656	281477	288186	292300
280408	309664	280190	282656	281477	288186
276836	302963	280408	280190	282656	281477
275216	298989	276836	280408	280190	282656
274352	298423	275216	276836	280408	280190
271311	301631	274352	275216	276836	280408
289802	329765	271311	274352	275216	276836
290726	335083	289802	271311	274352	275216
292300	327616	290726	289802	271311	274352
278506	309119	292300	290726	289802	271311
269826	295916	278506	292300	290726	289802
265861	291413	269826	278506	292300	290726
269034	291542	265861	269826	278506	292300
264176	284678	269034	265861	269826	278506
255198	276475	264176	269034	265861	269826
253353	272566	255198	264176	269034	265861
246057	264981	253353	255198	264176	269034
235372	263290	246057	253353	255198	264176
258556	296806	235372	246057	253353	255198
260993	303598	258556	235372	246057	253353
254663	286994	260993	258556	235372	246057
250643	276427	254663	260993	258556	235372
243422	266424	250643	254663	260993	258556
247105	267153	243422	250643	254663	260993
248541	268381	247105	243422	250643	254663
245039	262522	248541	247105	243422	250643
237080	255542	245039	248541	247105	243422
237085	253158	237080	245039	248541	247105
225554	243803	237085	237080	245039	248541
226839	250741	225554	237085	237080	245039
247934	280445	226839	225554	237085	237080
248333	285257	247934	226839	225554	237085
246969	270976	248333	247934	226839	225554
245098	261076	246969	248333	247934	226839
246263	255603	245098	246969	248333	247934
255765	260376	246263	245098	246969	248333
264319	263903	255765	246263	245098	246969
268347	264291	264319	255765	246263	245098
273046	263276	268347	264319	255765	246263
273963	262572	273046	268347	264319	255765
267430	256167	273963	273046	268347	264319
271993	264221	267430	273963	273046	268347
292710	293860	271993	267430	273963	273046


Summary of computational transaction
Raw Inputview raw input (R code)
Raw Outputview raw output of R engine
Computing time3 seconds
R Server'Gwilym Jenkins' @ 72.249.127.135

\begin{tabular}{lllllllll}
\hline
Summary of computational transaction \tabularnewline
Raw Input & view raw input (R code)  \tabularnewline
Raw Output & view raw output of R engine  \tabularnewline
Computing time & 3 seconds \tabularnewline
R Server & 'Gwilym Jenkins' @ 72.249.127.135 \tabularnewline
\hline
\end{tabular}
%Source: https://freestatistics.org/blog/index.php?pk=61861&T=0

[TABLE]
[ROW][C]Summary of computational transaction[/C][/ROW]
[ROW][C]Raw Input[/C][C]view raw input (R code) [/C][/ROW]
[ROW][C]Raw Output[/C][C]view raw output of R engine [/C][/ROW]
[ROW][C]Computing time[/C][C]3 seconds[/C][/ROW]
[ROW][C]R Server[/C][C]'Gwilym Jenkins' @ 72.249.127.135[/C][/ROW]
[/TABLE]
Source: https://freestatistics.org/blog/index.php?pk=61861&T=0

Globally Unique Identifier (entire table): ba.freestatistics.org/blog/index.php?pk=61861&T=0

As an alternative you can also use a QR Code:  

The GUIDs for individual cells are displayed in the table below:

Summary of computational transaction
Raw Inputview raw input (R code)
Raw Outputview raw output of R engine
Computing time3 seconds
R Server'Gwilym Jenkins' @ 72.249.127.135


Multiple Linear Regression - Estimated Regression Equation
Y[t] = + 7218.81321367391 + 0.168547715381535X[t] + 0.979872427652679Y1[t] + 0.137046798716369Y2[t] + 0.0699500275999237Y3[t] -0.406984626398871Y4[t] -1804.08726665933M1[t] + 1408.97397886702M2[t] + 18831.5706048898M3[t] -822.813077601211M4[t] -8320.63177610417M5[t] -14608.2217206370M6[t] -4583.64714859553M7[t] + 5149.13242714079M8[t] + 5625.48810387275M9[t] + 1211.36402069791M10[t] -3453.02634995847M11[t] + 72.3725529323416t + e[t]

\begin{tabular}{lllllllll}
\hline
Multiple Linear Regression - Estimated Regression Equation \tabularnewline
Y[t] =  +  7218.81321367391 +  0.168547715381535X[t] +  0.979872427652679Y1[t] +  0.137046798716369Y2[t] +  0.0699500275999237Y3[t] -0.406984626398871Y4[t] -1804.08726665933M1[t] +  1408.97397886702M2[t] +  18831.5706048898M3[t] -822.813077601211M4[t] -8320.63177610417M5[t] -14608.2217206370M6[t] -4583.64714859553M7[t] +  5149.13242714079M8[t] +  5625.48810387275M9[t] +  1211.36402069791M10[t] -3453.02634995847M11[t] +  72.3725529323416t  + e[t] \tabularnewline
\hline
\end{tabular}
%Source: https://freestatistics.org/blog/index.php?pk=61861&T=1

[TABLE]
[ROW][C]Multiple Linear Regression - Estimated Regression Equation[/C][/ROW]
[ROW][C]Y[t] =  +  7218.81321367391 +  0.168547715381535X[t] +  0.979872427652679Y1[t] +  0.137046798716369Y2[t] +  0.0699500275999237Y3[t] -0.406984626398871Y4[t] -1804.08726665933M1[t] +  1408.97397886702M2[t] +  18831.5706048898M3[t] -822.813077601211M4[t] -8320.63177610417M5[t] -14608.2217206370M6[t] -4583.64714859553M7[t] +  5149.13242714079M8[t] +  5625.48810387275M9[t] +  1211.36402069791M10[t] -3453.02634995847M11[t] +  72.3725529323416t  + e[t][/C][/ROW]
[/TABLE]
Source: https://freestatistics.org/blog/index.php?pk=61861&T=1

Globally Unique Identifier (entire table): ba.freestatistics.org/blog/index.php?pk=61861&T=1

As an alternative you can also use a QR Code:  

The GUIDs for individual cells are displayed in the table below:

Multiple Linear Regression - Estimated Regression Equation
Y[t] = + 7218.81321367391 + 0.168547715381535X[t] + 0.979872427652679Y1[t] + 0.137046798716369Y2[t] + 0.0699500275999237Y3[t] -0.406984626398871Y4[t] -1804.08726665933M1[t] + 1408.97397886702M2[t] + 18831.5706048898M3[t] -822.813077601211M4[t] -8320.63177610417M5[t] -14608.2217206370M6[t] -4583.64714859553M7[t] + 5149.13242714079M8[t] + 5625.48810387275M9[t] + 1211.36402069791M10[t] -3453.02634995847M11[t] + 72.3725529323416t + e[t]


Multiple Linear Regression - Ordinary Least Squares
VariableParameterS.D.T-STATH0: parameter = 02-tail p-value1-tail p-value
(Intercept)7218.8132136739113548.2960590.53280.5967790.29839
X0.1685477153815350.0964251.7480.0872910.043645
Y10.9798724276526790.138957.05200
Y20.1370467987163690.2026690.67620.5023680.251184
Y30.06995002759992370.2084330.33560.7387330.369367
Y4-0.4069846263988710.142958-2.84690.0066290.003314
M1-1804.087266659332222.876655-0.81160.4212930.210647
M21408.973978867022207.6600130.63820.5265650.263282
M318831.57060488984106.9883874.58533.6e-051.8e-05
M4-822.8130776012115548.036122-0.14830.8827630.441382
M5-8320.631776104174502.43792-1.8480.0711770.035588
M6-14608.22172063703618.16973-4.03750.0002080.000104
M7-4583.647148595532233.34681-2.05240.0459780.022989
M85149.132427140792384.7002572.15920.03620.0181
M95625.488103872752819.125211.99550.0520670.026033
M101211.364020697912713.9171920.44640.6574830.328742
M11-3453.026349958472233.000971-1.54640.1290220.064511
t72.372552932341668.6221671.05470.2972140.148607

\begin{tabular}{lllllllll}
\hline
Multiple Linear Regression - Ordinary Least Squares \tabularnewline
Variable & Parameter & S.D. & T-STATH0: parameter = 0 & 2-tail p-value & 1-tail p-value \tabularnewline
(Intercept) & 7218.81321367391 & 13548.296059 & 0.5328 & 0.596779 & 0.29839 \tabularnewline
X & 0.168547715381535 & 0.096425 & 1.748 & 0.087291 & 0.043645 \tabularnewline
Y1 & 0.979872427652679 & 0.13895 & 7.052 & 0 & 0 \tabularnewline
Y2 & 0.137046798716369 & 0.202669 & 0.6762 & 0.502368 & 0.251184 \tabularnewline
Y3 & 0.0699500275999237 & 0.208433 & 0.3356 & 0.738733 & 0.369367 \tabularnewline
Y4 & -0.406984626398871 & 0.142958 & -2.8469 & 0.006629 & 0.003314 \tabularnewline
M1 & -1804.08726665933 & 2222.876655 & -0.8116 & 0.421293 & 0.210647 \tabularnewline
M2 & 1408.97397886702 & 2207.660013 & 0.6382 & 0.526565 & 0.263282 \tabularnewline
M3 & 18831.5706048898 & 4106.988387 & 4.5853 & 3.6e-05 & 1.8e-05 \tabularnewline
M4 & -822.813077601211 & 5548.036122 & -0.1483 & 0.882763 & 0.441382 \tabularnewline
M5 & -8320.63177610417 & 4502.43792 & -1.848 & 0.071177 & 0.035588 \tabularnewline
M6 & -14608.2217206370 & 3618.16973 & -4.0375 & 0.000208 & 0.000104 \tabularnewline
M7 & -4583.64714859553 & 2233.34681 & -2.0524 & 0.045978 & 0.022989 \tabularnewline
M8 & 5149.13242714079 & 2384.700257 & 2.1592 & 0.0362 & 0.0181 \tabularnewline
M9 & 5625.48810387275 & 2819.12521 & 1.9955 & 0.052067 & 0.026033 \tabularnewline
M10 & 1211.36402069791 & 2713.917192 & 0.4464 & 0.657483 & 0.328742 \tabularnewline
M11 & -3453.02634995847 & 2233.000971 & -1.5464 & 0.129022 & 0.064511 \tabularnewline
t & 72.3725529323416 & 68.622167 & 1.0547 & 0.297214 & 0.148607 \tabularnewline
\hline
\end{tabular}
%Source: https://freestatistics.org/blog/index.php?pk=61861&T=2

[TABLE]
[ROW][C]Multiple Linear Regression - Ordinary Least Squares[/C][/ROW]
[ROW][C]Variable[/C][C]Parameter[/C][C]S.D.[/C][C]T-STATH0: parameter = 0[/C][C]2-tail p-value[/C][C]1-tail p-value[/C][/ROW]
[ROW][C](Intercept)[/C][C]7218.81321367391[/C][C]13548.296059[/C][C]0.5328[/C][C]0.596779[/C][C]0.29839[/C][/ROW]
[ROW][C]X[/C][C]0.168547715381535[/C][C]0.096425[/C][C]1.748[/C][C]0.087291[/C][C]0.043645[/C][/ROW]
[ROW][C]Y1[/C][C]0.979872427652679[/C][C]0.13895[/C][C]7.052[/C][C]0[/C][C]0[/C][/ROW]
[ROW][C]Y2[/C][C]0.137046798716369[/C][C]0.202669[/C][C]0.6762[/C][C]0.502368[/C][C]0.251184[/C][/ROW]
[ROW][C]Y3[/C][C]0.0699500275999237[/C][C]0.208433[/C][C]0.3356[/C][C]0.738733[/C][C]0.369367[/C][/ROW]
[ROW][C]Y4[/C][C]-0.406984626398871[/C][C]0.142958[/C][C]-2.8469[/C][C]0.006629[/C][C]0.003314[/C][/ROW]
[ROW][C]M1[/C][C]-1804.08726665933[/C][C]2222.876655[/C][C]-0.8116[/C][C]0.421293[/C][C]0.210647[/C][/ROW]
[ROW][C]M2[/C][C]1408.97397886702[/C][C]2207.660013[/C][C]0.6382[/C][C]0.526565[/C][C]0.263282[/C][/ROW]
[ROW][C]M3[/C][C]18831.5706048898[/C][C]4106.988387[/C][C]4.5853[/C][C]3.6e-05[/C][C]1.8e-05[/C][/ROW]
[ROW][C]M4[/C][C]-822.813077601211[/C][C]5548.036122[/C][C]-0.1483[/C][C]0.882763[/C][C]0.441382[/C][/ROW]
[ROW][C]M5[/C][C]-8320.63177610417[/C][C]4502.43792[/C][C]-1.848[/C][C]0.071177[/C][C]0.035588[/C][/ROW]
[ROW][C]M6[/C][C]-14608.2217206370[/C][C]3618.16973[/C][C]-4.0375[/C][C]0.000208[/C][C]0.000104[/C][/ROW]
[ROW][C]M7[/C][C]-4583.64714859553[/C][C]2233.34681[/C][C]-2.0524[/C][C]0.045978[/C][C]0.022989[/C][/ROW]
[ROW][C]M8[/C][C]5149.13242714079[/C][C]2384.700257[/C][C]2.1592[/C][C]0.0362[/C][C]0.0181[/C][/ROW]
[ROW][C]M9[/C][C]5625.48810387275[/C][C]2819.12521[/C][C]1.9955[/C][C]0.052067[/C][C]0.026033[/C][/ROW]
[ROW][C]M10[/C][C]1211.36402069791[/C][C]2713.917192[/C][C]0.4464[/C][C]0.657483[/C][C]0.328742[/C][/ROW]
[ROW][C]M11[/C][C]-3453.02634995847[/C][C]2233.000971[/C][C]-1.5464[/C][C]0.129022[/C][C]0.064511[/C][/ROW]
[ROW][C]t[/C][C]72.3725529323416[/C][C]68.622167[/C][C]1.0547[/C][C]0.297214[/C][C]0.148607[/C][/ROW]
[/TABLE]
Source: https://freestatistics.org/blog/index.php?pk=61861&T=2

Globally Unique Identifier (entire table): ba.freestatistics.org/blog/index.php?pk=61861&T=2

As an alternative you can also use a QR Code:  

The GUIDs for individual cells are displayed in the table below:

Multiple Linear Regression - Ordinary Least Squares
VariableParameterS.D.T-STATH0: parameter = 02-tail p-value1-tail p-value
(Intercept)7218.8132136739113548.2960590.53280.5967790.29839
X0.1685477153815350.0964251.7480.0872910.043645
Y10.9798724276526790.138957.05200
Y20.1370467987163690.2026690.67620.5023680.251184
Y30.06995002759992370.2084330.33560.7387330.369367
Y4-0.4069846263988710.142958-2.84690.0066290.003314
M1-1804.087266659332222.876655-0.81160.4212930.210647
M21408.973978867022207.6600130.63820.5265650.263282
M318831.57060488984106.9883874.58533.6e-051.8e-05
M4-822.8130776012115548.036122-0.14830.8827630.441382
M5-8320.631776104174502.43792-1.8480.0711770.035588
M6-14608.22172063703618.16973-4.03750.0002080.000104
M7-4583.647148595532233.34681-2.05240.0459780.022989
M85149.132427140792384.7002572.15920.03620.0181
M95625.488103872752819.125211.99550.0520670.026033
M101211.364020697912713.9171920.44640.6574830.328742
M11-3453.026349958472233.000971-1.54640.1290220.064511
t72.372552932341668.6221671.05470.2972140.148607


Multiple Linear Regression - Regression Statistics
Multiple R0.985779580101678
R-squared0.97176138054544
Adjusted R-squared0.961093457640385
F-TEST (value)91.0919013189444
F-TEST (DF numerator)17
F-TEST (DF denominator)45
p-value0
Multiple Linear Regression - Residual Statistics
Residual Standard Deviation3446.92213769629
Sum Squared Residuals534657250.050334

\begin{tabular}{lllllllll}
\hline
Multiple Linear Regression - Regression Statistics \tabularnewline
Multiple R & 0.985779580101678 \tabularnewline
R-squared & 0.97176138054544 \tabularnewline
Adjusted R-squared & 0.961093457640385 \tabularnewline
F-TEST (value) & 91.0919013189444 \tabularnewline
F-TEST (DF numerator) & 17 \tabularnewline
F-TEST (DF denominator) & 45 \tabularnewline
p-value & 0 \tabularnewline
Multiple Linear Regression - Residual Statistics \tabularnewline
Residual Standard Deviation & 3446.92213769629 \tabularnewline
Sum Squared Residuals & 534657250.050334 \tabularnewline
\hline
\end{tabular}
%Source: https://freestatistics.org/blog/index.php?pk=61861&T=3

[TABLE]
[ROW][C]Multiple Linear Regression - Regression Statistics[/C][/ROW]
[ROW][C]Multiple R[/C][C]0.985779580101678[/C][/ROW]
[ROW][C]R-squared[/C][C]0.97176138054544[/C][/ROW]
[ROW][C]Adjusted R-squared[/C][C]0.961093457640385[/C][/ROW]
[ROW][C]F-TEST (value)[/C][C]91.0919013189444[/C][/ROW]
[ROW][C]F-TEST (DF numerator)[/C][C]17[/C][/ROW]
[ROW][C]F-TEST (DF denominator)[/C][C]45[/C][/ROW]
[ROW][C]p-value[/C][C]0[/C][/ROW]
[ROW][C]Multiple Linear Regression - Residual Statistics[/C][/ROW]
[ROW][C]Residual Standard Deviation[/C][C]3446.92213769629[/C][/ROW]
[ROW][C]Sum Squared Residuals[/C][C]534657250.050334[/C][/ROW]
[/TABLE]
Source: https://freestatistics.org/blog/index.php?pk=61861&T=3

Globally Unique Identifier (entire table): ba.freestatistics.org/blog/index.php?pk=61861&T=3

As an alternative you can also use a QR Code:  

The GUIDs for individual cells are displayed in the table below:

Multiple Linear Regression - Regression Statistics
Multiple R0.985779580101678
R-squared0.97176138054544
Adjusted R-squared0.961093457640385
F-TEST (value)91.0919013189444
F-TEST (DF numerator)17
F-TEST (DF denominator)45
p-value0
Multiple Linear Regression - Residual Statistics
Residual Standard Deviation3446.92213769629
Sum Squared Residuals534657250.050334


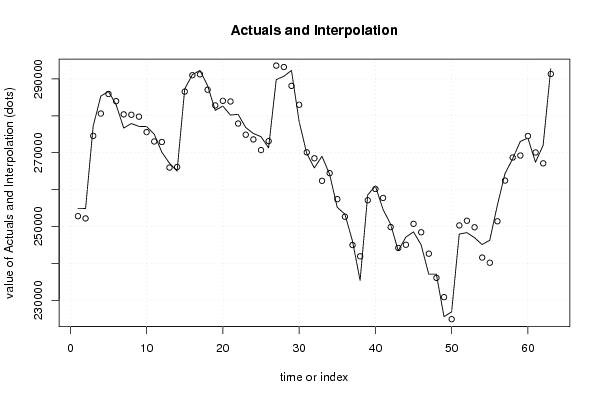
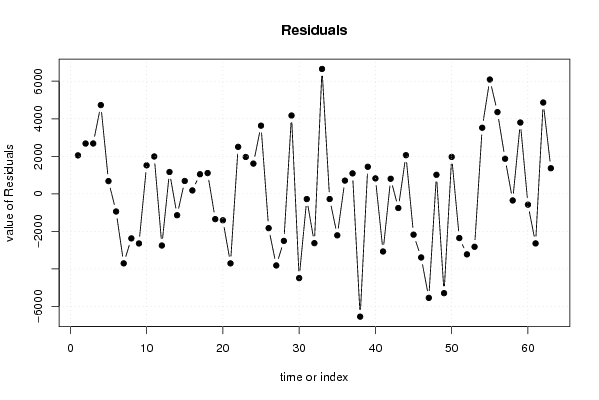
Multiple Linear Regression - Actuals, Interpolation, and Residuals
Time or IndexActualsInterpolationForecastResidualsPrediction Error
1254844252795.71419662048.28580340013
2254868252187.9276067412680.07239325895
3277267274583.8934207132683.10657928659
4285351280621.1548889414729.84511105919
5286602285925.018788635676.981211364627
6283042283983.32302366-941.323023660072
7276687280392.144806243-3705.14480624268
8277915280289.709133675-2374.70913367484
9277128279771.810018893-2643.8100188928
10277103275585.2769893211517.7230106786
11275037273046.9323060981990.06769390194
12270150272904.044975779-2754.0449757791
13267140265975.1484899361164.85151006359
14264993266133.905387976-1140.90538797611
15287259286573.775342432685.224657568355
16291186291005.35695062180.643049380156
17292300291256.5395995001043.46040050027
18288186287079.6450459881106.35495401205
19281477282824.689859679-1347.68985967947
20282656284065.812669368-1409.81266936802
21280190283895.658275904-3705.65827590387
22280408277905.1409521282502.85904787243
23276836274872.2706182761963.72938172408
24275216273605.3011482001610.69885180037
25274352270720.1371244713631.86287552912
26271311273139.062255319-1828.06225531923
27289802293618.182413021-3816.18241302057
28290726293233.44804961-2507.44804960997
29292300288127.9072747784172.09272522187
30278506282995.099444134-4489.09944413378
31269826270105.143575825-279.143575824519
32265861268489.656677261-2628.65667726102
33269034262379.8826910436654.11730895658
34264176264453.743995432-277.743995432311
35255198257409.033204932-2211.03320493236
36253353252648.156566013704.843433987028
37246057244968.5571895781088.44281042175
38235372241916.096192795-6544.09619279472
39258556257115.1304424611440.86955753896
40260993260171.443948526821.556051474032
41254663257734.617413691-3071.61741369118
42250643249840.099068033802.900931967098
43243422244179.406639836-757.406639836445
44247105245046.2379128572058.76208714311
45248541250716.211528677-2175.21152867679
46245039248429.74814862-3390.74814861993
47237080242623.015177727-5543.01517772657
48237085236069.3776469621015.62235303814
49225554230845.648026832-5291.64802683159
50226839224870.7700373191968.22996268103
51247934250290.670379149-2356.67037914903
52248333251557.596162303-3224.59616230341
53246969249789.916923396-2820.91692339559
54245098241576.8334181853521.1665818147
55246263240173.6151184176089.38488158311
56255765251410.5836068394354.41639316078
57264319262448.4374854831870.56251451689
58268347268699.089914499-352.089914498789
59273046269245.7486929673800.25130703291
60273963274540.119663046-577.119663046446
61267430270071.794972583-2641.79497258300
62271993267128.238519854864.76148015008
63292710291346.3480022241363.65199777570

\begin{tabular}{lllllllll}
\hline
Multiple Linear Regression - Actuals, Interpolation, and Residuals \tabularnewline
Time or Index & Actuals & InterpolationForecast & ResidualsPrediction Error \tabularnewline
1 & 254844 & 252795.7141966 & 2048.28580340013 \tabularnewline
2 & 254868 & 252187.927606741 & 2680.07239325895 \tabularnewline
3 & 277267 & 274583.893420713 & 2683.10657928659 \tabularnewline
4 & 285351 & 280621.154888941 & 4729.84511105919 \tabularnewline
5 & 286602 & 285925.018788635 & 676.981211364627 \tabularnewline
6 & 283042 & 283983.32302366 & -941.323023660072 \tabularnewline
7 & 276687 & 280392.144806243 & -3705.14480624268 \tabularnewline
8 & 277915 & 280289.709133675 & -2374.70913367484 \tabularnewline
9 & 277128 & 279771.810018893 & -2643.8100188928 \tabularnewline
10 & 277103 & 275585.276989321 & 1517.7230106786 \tabularnewline
11 & 275037 & 273046.932306098 & 1990.06769390194 \tabularnewline
12 & 270150 & 272904.044975779 & -2754.0449757791 \tabularnewline
13 & 267140 & 265975.148489936 & 1164.85151006359 \tabularnewline
14 & 264993 & 266133.905387976 & -1140.90538797611 \tabularnewline
15 & 287259 & 286573.775342432 & 685.224657568355 \tabularnewline
16 & 291186 & 291005.35695062 & 180.643049380156 \tabularnewline
17 & 292300 & 291256.539599500 & 1043.46040050027 \tabularnewline
18 & 288186 & 287079.645045988 & 1106.35495401205 \tabularnewline
19 & 281477 & 282824.689859679 & -1347.68985967947 \tabularnewline
20 & 282656 & 284065.812669368 & -1409.81266936802 \tabularnewline
21 & 280190 & 283895.658275904 & -3705.65827590387 \tabularnewline
22 & 280408 & 277905.140952128 & 2502.85904787243 \tabularnewline
23 & 276836 & 274872.270618276 & 1963.72938172408 \tabularnewline
24 & 275216 & 273605.301148200 & 1610.69885180037 \tabularnewline
25 & 274352 & 270720.137124471 & 3631.86287552912 \tabularnewline
26 & 271311 & 273139.062255319 & -1828.06225531923 \tabularnewline
27 & 289802 & 293618.182413021 & -3816.18241302057 \tabularnewline
28 & 290726 & 293233.44804961 & -2507.44804960997 \tabularnewline
29 & 292300 & 288127.907274778 & 4172.09272522187 \tabularnewline
30 & 278506 & 282995.099444134 & -4489.09944413378 \tabularnewline
31 & 269826 & 270105.143575825 & -279.143575824519 \tabularnewline
32 & 265861 & 268489.656677261 & -2628.65667726102 \tabularnewline
33 & 269034 & 262379.882691043 & 6654.11730895658 \tabularnewline
34 & 264176 & 264453.743995432 & -277.743995432311 \tabularnewline
35 & 255198 & 257409.033204932 & -2211.03320493236 \tabularnewline
36 & 253353 & 252648.156566013 & 704.843433987028 \tabularnewline
37 & 246057 & 244968.557189578 & 1088.44281042175 \tabularnewline
38 & 235372 & 241916.096192795 & -6544.09619279472 \tabularnewline
39 & 258556 & 257115.130442461 & 1440.86955753896 \tabularnewline
40 & 260993 & 260171.443948526 & 821.556051474032 \tabularnewline
41 & 254663 & 257734.617413691 & -3071.61741369118 \tabularnewline
42 & 250643 & 249840.099068033 & 802.900931967098 \tabularnewline
43 & 243422 & 244179.406639836 & -757.406639836445 \tabularnewline
44 & 247105 & 245046.237912857 & 2058.76208714311 \tabularnewline
45 & 248541 & 250716.211528677 & -2175.21152867679 \tabularnewline
46 & 245039 & 248429.74814862 & -3390.74814861993 \tabularnewline
47 & 237080 & 242623.015177727 & -5543.01517772657 \tabularnewline
48 & 237085 & 236069.377646962 & 1015.62235303814 \tabularnewline
49 & 225554 & 230845.648026832 & -5291.64802683159 \tabularnewline
50 & 226839 & 224870.770037319 & 1968.22996268103 \tabularnewline
51 & 247934 & 250290.670379149 & -2356.67037914903 \tabularnewline
52 & 248333 & 251557.596162303 & -3224.59616230341 \tabularnewline
53 & 246969 & 249789.916923396 & -2820.91692339559 \tabularnewline
54 & 245098 & 241576.833418185 & 3521.1665818147 \tabularnewline
55 & 246263 & 240173.615118417 & 6089.38488158311 \tabularnewline
56 & 255765 & 251410.583606839 & 4354.41639316078 \tabularnewline
57 & 264319 & 262448.437485483 & 1870.56251451689 \tabularnewline
58 & 268347 & 268699.089914499 & -352.089914498789 \tabularnewline
59 & 273046 & 269245.748692967 & 3800.25130703291 \tabularnewline
60 & 273963 & 274540.119663046 & -577.119663046446 \tabularnewline
61 & 267430 & 270071.794972583 & -2641.79497258300 \tabularnewline
62 & 271993 & 267128.23851985 & 4864.76148015008 \tabularnewline
63 & 292710 & 291346.348002224 & 1363.65199777570 \tabularnewline
\hline
\end{tabular}
%Source: https://freestatistics.org/blog/index.php?pk=61861&T=4

[TABLE]
[ROW][C]Multiple Linear Regression - Actuals, Interpolation, and Residuals[/C][/ROW]
[ROW][C]Time or Index[/C][C]Actuals[/C][C]InterpolationForecast[/C][C]ResidualsPrediction Error[/C][/ROW]
[ROW][C]1[/C][C]254844[/C][C]252795.7141966[/C][C]2048.28580340013[/C][/ROW]
[ROW][C]2[/C][C]254868[/C][C]252187.927606741[/C][C]2680.07239325895[/C][/ROW]
[ROW][C]3[/C][C]277267[/C][C]274583.893420713[/C][C]2683.10657928659[/C][/ROW]
[ROW][C]4[/C][C]285351[/C][C]280621.154888941[/C][C]4729.84511105919[/C][/ROW]
[ROW][C]5[/C][C]286602[/C][C]285925.018788635[/C][C]676.981211364627[/C][/ROW]
[ROW][C]6[/C][C]283042[/C][C]283983.32302366[/C][C]-941.323023660072[/C][/ROW]
[ROW][C]7[/C][C]276687[/C][C]280392.144806243[/C][C]-3705.14480624268[/C][/ROW]
[ROW][C]8[/C][C]277915[/C][C]280289.709133675[/C][C]-2374.70913367484[/C][/ROW]
[ROW][C]9[/C][C]277128[/C][C]279771.810018893[/C][C]-2643.8100188928[/C][/ROW]
[ROW][C]10[/C][C]277103[/C][C]275585.276989321[/C][C]1517.7230106786[/C][/ROW]
[ROW][C]11[/C][C]275037[/C][C]273046.932306098[/C][C]1990.06769390194[/C][/ROW]
[ROW][C]12[/C][C]270150[/C][C]272904.044975779[/C][C]-2754.0449757791[/C][/ROW]
[ROW][C]13[/C][C]267140[/C][C]265975.148489936[/C][C]1164.85151006359[/C][/ROW]
[ROW][C]14[/C][C]264993[/C][C]266133.905387976[/C][C]-1140.90538797611[/C][/ROW]
[ROW][C]15[/C][C]287259[/C][C]286573.775342432[/C][C]685.224657568355[/C][/ROW]
[ROW][C]16[/C][C]291186[/C][C]291005.35695062[/C][C]180.643049380156[/C][/ROW]
[ROW][C]17[/C][C]292300[/C][C]291256.539599500[/C][C]1043.46040050027[/C][/ROW]
[ROW][C]18[/C][C]288186[/C][C]287079.645045988[/C][C]1106.35495401205[/C][/ROW]
[ROW][C]19[/C][C]281477[/C][C]282824.689859679[/C][C]-1347.68985967947[/C][/ROW]
[ROW][C]20[/C][C]282656[/C][C]284065.812669368[/C][C]-1409.81266936802[/C][/ROW]
[ROW][C]21[/C][C]280190[/C][C]283895.658275904[/C][C]-3705.65827590387[/C][/ROW]
[ROW][C]22[/C][C]280408[/C][C]277905.140952128[/C][C]2502.85904787243[/C][/ROW]
[ROW][C]23[/C][C]276836[/C][C]274872.270618276[/C][C]1963.72938172408[/C][/ROW]
[ROW][C]24[/C][C]275216[/C][C]273605.301148200[/C][C]1610.69885180037[/C][/ROW]
[ROW][C]25[/C][C]274352[/C][C]270720.137124471[/C][C]3631.86287552912[/C][/ROW]
[ROW][C]26[/C][C]271311[/C][C]273139.062255319[/C][C]-1828.06225531923[/C][/ROW]
[ROW][C]27[/C][C]289802[/C][C]293618.182413021[/C][C]-3816.18241302057[/C][/ROW]
[ROW][C]28[/C][C]290726[/C][C]293233.44804961[/C][C]-2507.44804960997[/C][/ROW]
[ROW][C]29[/C][C]292300[/C][C]288127.907274778[/C][C]4172.09272522187[/C][/ROW]
[ROW][C]30[/C][C]278506[/C][C]282995.099444134[/C][C]-4489.09944413378[/C][/ROW]
[ROW][C]31[/C][C]269826[/C][C]270105.143575825[/C][C]-279.143575824519[/C][/ROW]
[ROW][C]32[/C][C]265861[/C][C]268489.656677261[/C][C]-2628.65667726102[/C][/ROW]
[ROW][C]33[/C][C]269034[/C][C]262379.882691043[/C][C]6654.11730895658[/C][/ROW]
[ROW][C]34[/C][C]264176[/C][C]264453.743995432[/C][C]-277.743995432311[/C][/ROW]
[ROW][C]35[/C][C]255198[/C][C]257409.033204932[/C][C]-2211.03320493236[/C][/ROW]
[ROW][C]36[/C][C]253353[/C][C]252648.156566013[/C][C]704.843433987028[/C][/ROW]
[ROW][C]37[/C][C]246057[/C][C]244968.557189578[/C][C]1088.44281042175[/C][/ROW]
[ROW][C]38[/C][C]235372[/C][C]241916.096192795[/C][C]-6544.09619279472[/C][/ROW]
[ROW][C]39[/C][C]258556[/C][C]257115.130442461[/C][C]1440.86955753896[/C][/ROW]
[ROW][C]40[/C][C]260993[/C][C]260171.443948526[/C][C]821.556051474032[/C][/ROW]
[ROW][C]41[/C][C]254663[/C][C]257734.617413691[/C][C]-3071.61741369118[/C][/ROW]
[ROW][C]42[/C][C]250643[/C][C]249840.099068033[/C][C]802.900931967098[/C][/ROW]
[ROW][C]43[/C][C]243422[/C][C]244179.406639836[/C][C]-757.406639836445[/C][/ROW]
[ROW][C]44[/C][C]247105[/C][C]245046.237912857[/C][C]2058.76208714311[/C][/ROW]
[ROW][C]45[/C][C]248541[/C][C]250716.211528677[/C][C]-2175.21152867679[/C][/ROW]
[ROW][C]46[/C][C]245039[/C][C]248429.74814862[/C][C]-3390.74814861993[/C][/ROW]
[ROW][C]47[/C][C]237080[/C][C]242623.015177727[/C][C]-5543.01517772657[/C][/ROW]
[ROW][C]48[/C][C]237085[/C][C]236069.377646962[/C][C]1015.62235303814[/C][/ROW]
[ROW][C]49[/C][C]225554[/C][C]230845.648026832[/C][C]-5291.64802683159[/C][/ROW]
[ROW][C]50[/C][C]226839[/C][C]224870.770037319[/C][C]1968.22996268103[/C][/ROW]
[ROW][C]51[/C][C]247934[/C][C]250290.670379149[/C][C]-2356.67037914903[/C][/ROW]
[ROW][C]52[/C][C]248333[/C][C]251557.596162303[/C][C]-3224.59616230341[/C][/ROW]
[ROW][C]53[/C][C]246969[/C][C]249789.916923396[/C][C]-2820.91692339559[/C][/ROW]
[ROW][C]54[/C][C]245098[/C][C]241576.833418185[/C][C]3521.1665818147[/C][/ROW]
[ROW][C]55[/C][C]246263[/C][C]240173.615118417[/C][C]6089.38488158311[/C][/ROW]
[ROW][C]56[/C][C]255765[/C][C]251410.583606839[/C][C]4354.41639316078[/C][/ROW]
[ROW][C]57[/C][C]264319[/C][C]262448.437485483[/C][C]1870.56251451689[/C][/ROW]
[ROW][C]58[/C][C]268347[/C][C]268699.089914499[/C][C]-352.089914498789[/C][/ROW]
[ROW][C]59[/C][C]273046[/C][C]269245.748692967[/C][C]3800.25130703291[/C][/ROW]
[ROW][C]60[/C][C]273963[/C][C]274540.119663046[/C][C]-577.119663046446[/C][/ROW]
[ROW][C]61[/C][C]267430[/C][C]270071.794972583[/C][C]-2641.79497258300[/C][/ROW]
[ROW][C]62[/C][C]271993[/C][C]267128.23851985[/C][C]4864.76148015008[/C][/ROW]
[ROW][C]63[/C][C]292710[/C][C]291346.348002224[/C][C]1363.65199777570[/C][/ROW]
[/TABLE]
Source: https://freestatistics.org/blog/index.php?pk=61861&T=4

Globally Unique Identifier (entire table): ba.freestatistics.org/blog/index.php?pk=61861&T=4

As an alternative you can also use a QR Code:  

The GUIDs for individual cells are displayed in the table below:

Multiple Linear Regression - Actuals, Interpolation, and Residuals
Time or IndexActualsInterpolationForecastResidualsPrediction Error
1254844252795.71419662048.28580340013
2254868252187.9276067412680.07239325895
3277267274583.8934207132683.10657928659
4285351280621.1548889414729.84511105919
5286602285925.018788635676.981211364627
6283042283983.32302366-941.323023660072
7276687280392.144806243-3705.14480624268
8277915280289.709133675-2374.70913367484
9277128279771.810018893-2643.8100188928
10277103275585.2769893211517.7230106786
11275037273046.9323060981990.06769390194
12270150272904.044975779-2754.0449757791
13267140265975.1484899361164.85151006359
14264993266133.905387976-1140.90538797611
15287259286573.775342432685.224657568355
16291186291005.35695062180.643049380156
17292300291256.5395995001043.46040050027
18288186287079.6450459881106.35495401205
19281477282824.689859679-1347.68985967947
20282656284065.812669368-1409.81266936802
21280190283895.658275904-3705.65827590387
22280408277905.1409521282502.85904787243
23276836274872.2706182761963.72938172408
24275216273605.3011482001610.69885180037
25274352270720.1371244713631.86287552912
26271311273139.062255319-1828.06225531923
27289802293618.182413021-3816.18241302057
28290726293233.44804961-2507.44804960997
29292300288127.9072747784172.09272522187
30278506282995.099444134-4489.09944413378
31269826270105.143575825-279.143575824519
32265861268489.656677261-2628.65667726102
33269034262379.8826910436654.11730895658
34264176264453.743995432-277.743995432311
35255198257409.033204932-2211.03320493236
36253353252648.156566013704.843433987028
37246057244968.5571895781088.44281042175
38235372241916.096192795-6544.09619279472
39258556257115.1304424611440.86955753896
40260993260171.443948526821.556051474032
41254663257734.617413691-3071.61741369118
42250643249840.099068033802.900931967098
43243422244179.406639836-757.406639836445
44247105245046.2379128572058.76208714311
45248541250716.211528677-2175.21152867679
46245039248429.74814862-3390.74814861993
47237080242623.015177727-5543.01517772657
48237085236069.3776469621015.62235303814
49225554230845.648026832-5291.64802683159
50226839224870.7700373191968.22996268103
51247934250290.670379149-2356.67037914903
52248333251557.596162303-3224.59616230341
53246969249789.916923396-2820.91692339559
54245098241576.8334181853521.1665818147
55246263240173.6151184176089.38488158311
56255765251410.5836068394354.41639316078
57264319262448.4374854831870.56251451689
58268347268699.089914499-352.089914498789
59273046269245.7486929673800.25130703291
60273963274540.119663046-577.119663046446
61267430270071.794972583-2641.79497258300
62271993267128.238519854864.76148015008
63292710291346.3480022241363.65199777570


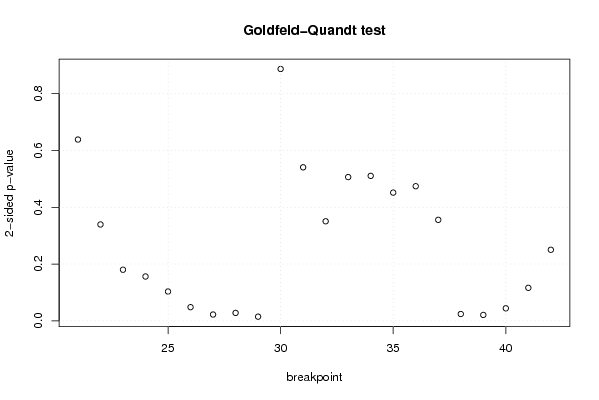
Goldfeld-Quandt test for Heteroskedasticity
p-valuesAlternative Hypothesis
breakpoint indexgreater2-sidedless
210.3192396556394280.6384793112788560.680760344360572
220.1696758268614340.3393516537228670.830324173138566
230.08997818456618120.1799563691323620.910021815433819
240.07803612915022730.1560722583004550.921963870849773
250.05159626125085330.1031925225017070.948403738749147
260.02401262021657770.04802524043315540.975987379783422
270.01104398845668170.02208797691336340.988956011543318
280.01390060344510610.02780120689021230.986099396554894
290.007315354192827790.01463070838565560.992684645807172
300.5564005840843930.8871988318312130.443599415915607
310.729671652422560.540656695154880.27032834757744
320.8247302494315380.3505395011369240.175269750568462
330.7468391680147950.506321663970410.253160831985205
340.7447072489636150.510585502072770.255292751036385
350.7742182779620920.4515634440758160.225781722037908
360.7629600515806080.4740798968387840.237039948419392
370.822161891638960.355676216722080.17783810836104
380.9880376988769240.0239246022461510.0119623011230755
390.9896582889676380.02068342206472470.0103417110323624
400.9779876817436680.04402463651266480.0220123182563324
410.9419043803312920.1161912393374150.0580956196687076
420.8748950473891380.2502099052217230.125104952610861

\begin{tabular}{lllllllll}
\hline
Goldfeld-Quandt test for Heteroskedasticity \tabularnewline
p-values & Alternative Hypothesis \tabularnewline
breakpoint index & greater & 2-sided & less \tabularnewline
21 & 0.319239655639428 & 0.638479311278856 & 0.680760344360572 \tabularnewline
22 & 0.169675826861434 & 0.339351653722867 & 0.830324173138566 \tabularnewline
23 & 0.0899781845661812 & 0.179956369132362 & 0.910021815433819 \tabularnewline
24 & 0.0780361291502273 & 0.156072258300455 & 0.921963870849773 \tabularnewline
25 & 0.0515962612508533 & 0.103192522501707 & 0.948403738749147 \tabularnewline
26 & 0.0240126202165777 & 0.0480252404331554 & 0.975987379783422 \tabularnewline
27 & 0.0110439884566817 & 0.0220879769133634 & 0.988956011543318 \tabularnewline
28 & 0.0139006034451061 & 0.0278012068902123 & 0.986099396554894 \tabularnewline
29 & 0.00731535419282779 & 0.0146307083856556 & 0.992684645807172 \tabularnewline
30 & 0.556400584084393 & 0.887198831831213 & 0.443599415915607 \tabularnewline
31 & 0.72967165242256 & 0.54065669515488 & 0.27032834757744 \tabularnewline
32 & 0.824730249431538 & 0.350539501136924 & 0.175269750568462 \tabularnewline
33 & 0.746839168014795 & 0.50632166397041 & 0.253160831985205 \tabularnewline
34 & 0.744707248963615 & 0.51058550207277 & 0.255292751036385 \tabularnewline
35 & 0.774218277962092 & 0.451563444075816 & 0.225781722037908 \tabularnewline
36 & 0.762960051580608 & 0.474079896838784 & 0.237039948419392 \tabularnewline
37 & 0.82216189163896 & 0.35567621672208 & 0.17783810836104 \tabularnewline
38 & 0.988037698876924 & 0.023924602246151 & 0.0119623011230755 \tabularnewline
39 & 0.989658288967638 & 0.0206834220647247 & 0.0103417110323624 \tabularnewline
40 & 0.977987681743668 & 0.0440246365126648 & 0.0220123182563324 \tabularnewline
41 & 0.941904380331292 & 0.116191239337415 & 0.0580956196687076 \tabularnewline
42 & 0.874895047389138 & 0.250209905221723 & 0.125104952610861 \tabularnewline
\hline
\end{tabular}
%Source: https://freestatistics.org/blog/index.php?pk=61861&T=5

[TABLE]
[ROW][C]Goldfeld-Quandt test for Heteroskedasticity[/C][/ROW]
[ROW][C]p-values[/C][C]Alternative Hypothesis[/C][/ROW]
[ROW][C]breakpoint index[/C][C]greater[/C][C]2-sided[/C][C]less[/C][/ROW]
[ROW][C]21[/C][C]0.319239655639428[/C][C]0.638479311278856[/C][C]0.680760344360572[/C][/ROW]
[ROW][C]22[/C][C]0.169675826861434[/C][C]0.339351653722867[/C][C]0.830324173138566[/C][/ROW]
[ROW][C]23[/C][C]0.0899781845661812[/C][C]0.179956369132362[/C][C]0.910021815433819[/C][/ROW]
[ROW][C]24[/C][C]0.0780361291502273[/C][C]0.156072258300455[/C][C]0.921963870849773[/C][/ROW]
[ROW][C]25[/C][C]0.0515962612508533[/C][C]0.103192522501707[/C][C]0.948403738749147[/C][/ROW]
[ROW][C]26[/C][C]0.0240126202165777[/C][C]0.0480252404331554[/C][C]0.975987379783422[/C][/ROW]
[ROW][C]27[/C][C]0.0110439884566817[/C][C]0.0220879769133634[/C][C]0.988956011543318[/C][/ROW]
[ROW][C]28[/C][C]0.0139006034451061[/C][C]0.0278012068902123[/C][C]0.986099396554894[/C][/ROW]
[ROW][C]29[/C][C]0.00731535419282779[/C][C]0.0146307083856556[/C][C]0.992684645807172[/C][/ROW]
[ROW][C]30[/C][C]0.556400584084393[/C][C]0.887198831831213[/C][C]0.443599415915607[/C][/ROW]
[ROW][C]31[/C][C]0.72967165242256[/C][C]0.54065669515488[/C][C]0.27032834757744[/C][/ROW]
[ROW][C]32[/C][C]0.824730249431538[/C][C]0.350539501136924[/C][C]0.175269750568462[/C][/ROW]
[ROW][C]33[/C][C]0.746839168014795[/C][C]0.50632166397041[/C][C]0.253160831985205[/C][/ROW]
[ROW][C]34[/C][C]0.744707248963615[/C][C]0.51058550207277[/C][C]0.255292751036385[/C][/ROW]
[ROW][C]35[/C][C]0.774218277962092[/C][C]0.451563444075816[/C][C]0.225781722037908[/C][/ROW]
[ROW][C]36[/C][C]0.762960051580608[/C][C]0.474079896838784[/C][C]0.237039948419392[/C][/ROW]
[ROW][C]37[/C][C]0.82216189163896[/C][C]0.35567621672208[/C][C]0.17783810836104[/C][/ROW]
[ROW][C]38[/C][C]0.988037698876924[/C][C]0.023924602246151[/C][C]0.0119623011230755[/C][/ROW]
[ROW][C]39[/C][C]0.989658288967638[/C][C]0.0206834220647247[/C][C]0.0103417110323624[/C][/ROW]
[ROW][C]40[/C][C]0.977987681743668[/C][C]0.0440246365126648[/C][C]0.0220123182563324[/C][/ROW]
[ROW][C]41[/C][C]0.941904380331292[/C][C]0.116191239337415[/C][C]0.0580956196687076[/C][/ROW]
[ROW][C]42[/C][C]0.874895047389138[/C][C]0.250209905221723[/C][C]0.125104952610861[/C][/ROW]
[/TABLE]
Source: https://freestatistics.org/blog/index.php?pk=61861&T=5

Globally Unique Identifier (entire table): ba.freestatistics.org/blog/index.php?pk=61861&T=5

As an alternative you can also use a QR Code:  

The GUIDs for individual cells are displayed in the table below:

Goldfeld-Quandt test for Heteroskedasticity
p-valuesAlternative Hypothesis
breakpoint indexgreater2-sidedless
210.3192396556394280.6384793112788560.680760344360572
220.1696758268614340.3393516537228670.830324173138566
230.08997818456618120.1799563691323620.910021815433819
240.07803612915022730.1560722583004550.921963870849773
250.05159626125085330.1031925225017070.948403738749147
260.02401262021657770.04802524043315540.975987379783422
270.01104398845668170.02208797691336340.988956011543318
280.01390060344510610.02780120689021230.986099396554894
290.007315354192827790.01463070838565560.992684645807172
300.5564005840843930.8871988318312130.443599415915607
310.729671652422560.540656695154880.27032834757744
320.8247302494315380.3505395011369240.175269750568462
330.7468391680147950.506321663970410.253160831985205
340.7447072489636150.510585502072770.255292751036385
350.7742182779620920.4515634440758160.225781722037908
360.7629600515806080.4740798968387840.237039948419392
370.822161891638960.355676216722080.17783810836104
380.9880376988769240.0239246022461510.0119623011230755
390.9896582889676380.02068342206472470.0103417110323624
400.9779876817436680.04402463651266480.0220123182563324
410.9419043803312920.1161912393374150.0580956196687076
420.8748950473891380.2502099052217230.125104952610861


Meta Analysis of Goldfeld-Quandt test for Heteroskedasticity
Description# significant tests% significant testsOK/NOK
1% type I error level00OK
5% type I error level70.318181818181818NOK
10% type I error level70.318181818181818NOK

\begin{tabular}{lllllllll}
\hline
Meta Analysis of Goldfeld-Quandt test for Heteroskedasticity \tabularnewline
Description & # significant tests & % significant tests & OK/NOK \tabularnewline
1% type I error level & 0 & 0 & OK \tabularnewline
5% type I error level & 7 & 0.318181818181818 & NOK \tabularnewline
10% type I error level & 7 & 0.318181818181818 & NOK \tabularnewline
\hline
\end{tabular}
%Source: https://freestatistics.org/blog/index.php?pk=61861&T=6

[TABLE]
[ROW][C]Meta Analysis of Goldfeld-Quandt test for Heteroskedasticity[/C][/ROW]
[ROW][C]Description[/C][C]# significant tests[/C][C]% significant tests[/C][C]OK/NOK[/C][/ROW]
[ROW][C]1% type I error level[/C][C]0[/C][C]0[/C][C]OK[/C][/ROW]
[ROW][C]5% type I error level[/C][C]7[/C][C]0.318181818181818[/C][C]NOK[/C][/ROW]
[ROW][C]10% type I error level[/C][C]7[/C][C]0.318181818181818[/C][C]NOK[/C][/ROW]
[/TABLE]
Source: https://freestatistics.org/blog/index.php?pk=61861&T=6

Globally Unique Identifier (entire table): ba.freestatistics.org/blog/index.php?pk=61861&T=6

As an alternative you can also use a QR Code:  

The GUIDs for individual cells are displayed in the table below:

Meta Analysis of Goldfeld-Quandt test for Heteroskedasticity
Description# significant tests% significant testsOK/NOK
1% type I error level00OK
5% type I error level70.318181818181818NOK
10% type I error level70.318181818181818NOK


Parameters (Session):
par1 = 1 ; par2 = Include Monthly Dummies ; par3 = Linear Trend ;
Parameters (R input):
par1 = 1 ; par2 = Include Monthly Dummies ; par3 = Linear Trend ;
R code (references can be found in the software module):
library(lattice)
library(lmtest)
n25 <- 25 #minimum number of obs. for Goldfeld-Quandt test
par1 <- as.numeric(par1)
x <- t(y)
k <- length(x[1,])
n <- length(x[,1])
x1 <- cbind(x[,par1], x[,1:k!=par1])
mycolnames <- c(colnames(x)[par1], colnames(x)[1:k!=par1])
colnames(x1) <- mycolnames #colnames(x)[par1]
x <- x1
if (par3 == 'First Differences'){
x2 <- array(0, dim=c(n-1,k), dimnames=list(1:(n-1), paste('(1-B)',colnames(x),sep='')))
for (i in 1:n-1) {
for (j in 1:k) {
x2[i,j] <- x[i+1,j] - x[i,j]
}
}
x <- x2
}
if (par2 == 'Include Monthly Dummies'){
x2 <- array(0, dim=c(n,11), dimnames=list(1:n, paste('M', seq(1:11), sep ='')))
for (i in 1:11){
x2[seq(i,n,12),i] <- 1
}
x <- cbind(x, x2)
}
if (par2 == 'Include Quarterly Dummies'){
x2 <- array(0, dim=c(n,3), dimnames=list(1:n, paste('Q', seq(1:3), sep ='')))
for (i in 1:3){
x2[seq(i,n,4),i] <- 1
}
x <- cbind(x, x2)
}
k <- length(x[1,])
if (par3 == 'Linear Trend'){
x <- cbind(x, c(1:n))
colnames(x)[k+1] <- 't'
}
x
k <- length(x[1,])
df <- as.data.frame(x)
(mylm <- lm(df))
(mysum <- summary(mylm))
if (n > n25) {
kp3 <- k + 3
nmkm3 <- n - k - 3
gqarr <- array(NA, dim=c(nmkm3-kp3+1,3))
numgqtests <- 0
numsignificant1 <- 0
numsignificant5 <- 0
numsignificant10 <- 0
for (mypoint in kp3:nmkm3) {
j <- 0
numgqtests <- numgqtests + 1
for (myalt in c('greater', 'two.sided', 'less')) {
j <- j + 1
gqarr[mypoint-kp3+1,j] <- gqtest(mylm, point=mypoint, alternative=myalt)$p.value
}
if (gqarr[mypoint-kp3+1,2] < 0.01) numsignificant1 <- numsignificant1 + 1
if (gqarr[mypoint-kp3+1,2] < 0.05) numsignificant5 <- numsignificant5 + 1
if (gqarr[mypoint-kp3+1,2] < 0.10) numsignificant10 <- numsignificant10 + 1
}
gqarr
}
bitmap(file='test0.png')
plot(x[,1], type='l', main='Actuals and Interpolation', ylab='value of Actuals and Interpolation (dots)', xlab='time or index')
points(x[,1]-mysum$resid)
grid()
dev.off()
bitmap(file='test1.png')
plot(mysum$resid, type='b', pch=19, main='Residuals', ylab='value of Residuals', xlab='time or index')
grid()
dev.off()
bitmap(file='test2.png')
hist(mysum$resid, main='Residual Histogram', xlab='values of Residuals')
grid()
dev.off()
bitmap(file='test3.png')
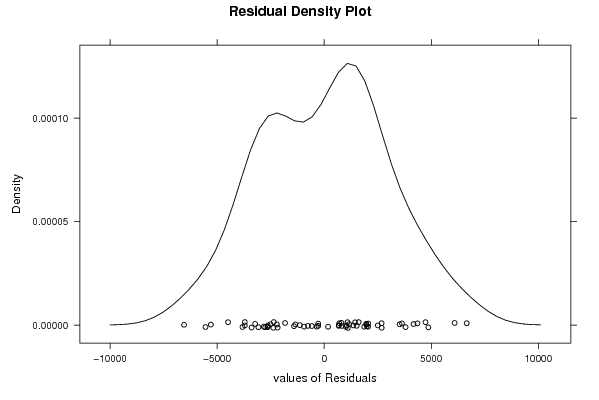
densityplot(~mysum$resid,col='black',main='Residual Density Plot', xlab='values of Residuals')
dev.off()
bitmap(file='test4.png')
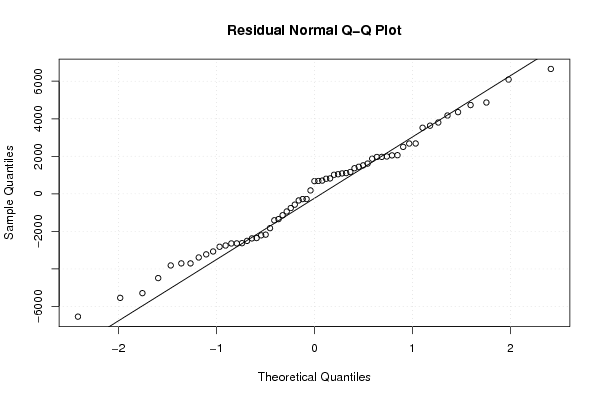
qqnorm(mysum$resid, main='Residual Normal Q-Q Plot')
qqline(mysum$resid)
grid()
dev.off()
(myerror <- as.ts(mysum$resid))
bitmap(file='test5.png')
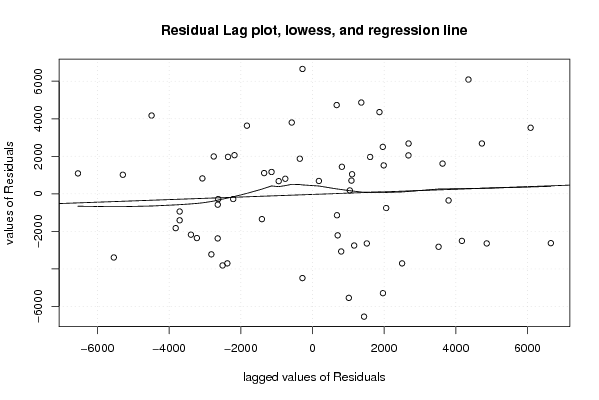
dum <- cbind(lag(myerror,k=1),myerror)
dum
dum1 <- dum[2:length(myerror),]
dum1
z <- as.data.frame(dum1)
z
plot(z,main=paste('Residual Lag plot, lowess, and regression line'), ylab='values of Residuals', xlab='lagged values of Residuals')
lines(lowess(z))
abline(lm(z))
grid()
dev.off()
bitmap(file='test6.png')
acf(mysum$resid, lag.max=length(mysum$resid)/2, main='Residual Autocorrelation Function')
grid()
dev.off()
bitmap(file='test7.png')
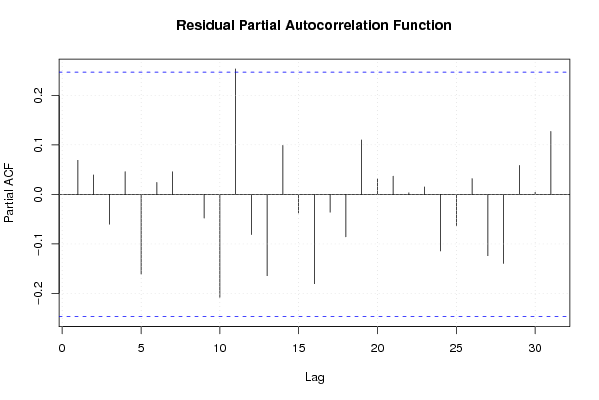
pacf(mysum$resid, lag.max=length(mysum$resid)/2, main='Residual Partial Autocorrelation Function')
grid()
dev.off()
bitmap(file='test8.png')
opar <- par(mfrow = c(2,2), oma = c(0, 0, 1.1, 0))
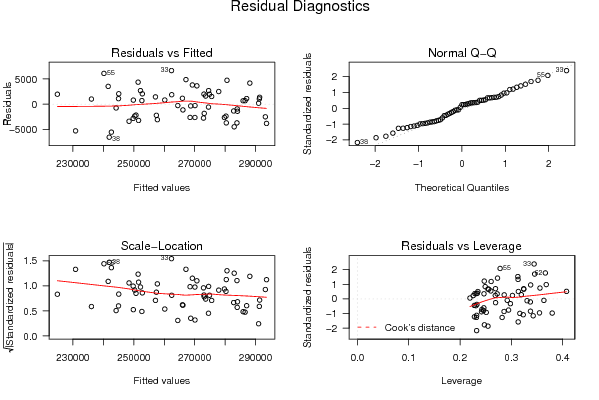
plot(mylm, las = 1, sub='Residual Diagnostics')
par(opar)
dev.off()
if (n > n25) {
bitmap(file='test9.png')
plot(kp3:nmkm3,gqarr[,2], main='Goldfeld-Quandt test',ylab='2-sided p-value',xlab='breakpoint')
grid()
dev.off()
}
load(file='createtable')
a<-table.start()
a<-table.row.start(a)
a<-table.element(a, 'Multiple Linear Regression - Estimated Regression Equation', 1, TRUE)
a<-table.row.end(a)
myeq <- colnames(x)[1]
myeq <- paste(myeq, '[t] = ', sep='')
for (i in 1:k){
if (mysum$coefficients[i,1] > 0) myeq <- paste(myeq, '+', '')
myeq <- paste(myeq, mysum$coefficients[i,1], sep=' ')
if (rownames(mysum$coefficients)[i] != '(Intercept)') {
myeq <- paste(myeq, rownames(mysum$coefficients)[i], sep='')
if (rownames(mysum$coefficients)[i] != 't') myeq <- paste(myeq, '[t]', sep='')
}
}
myeq <- paste(myeq, ' + e[t]')
a<-table.row.start(a)
a<-table.element(a, myeq)
a<-table.row.end(a)
a<-table.end(a)
table.save(a,file='mytable1.tab')
a<-table.start()
a<-table.row.start(a)
a<-table.element(a,hyperlink('ols1.htm','Multiple Linear Regression - Ordinary Least Squares',''), 6, TRUE)
a<-table.row.end(a)
a<-table.row.start(a)
a<-table.element(a,'Variable',header=TRUE)
a<-table.element(a,'Parameter',header=TRUE)
a<-table.element(a,'S.D.',header=TRUE)
a<-table.element(a,'T-STAT
H0: parameter = 0',header=TRUE)
a<-table.element(a,'2-tail p-value',header=TRUE)
a<-table.element(a,'1-tail p-value',header=TRUE)
a<-table.row.end(a)
for (i in 1:k){
a<-table.row.start(a)
a<-table.element(a,rownames(mysum$coefficients)[i],header=TRUE)
a<-table.element(a,mysum$coefficients[i,1])
a<-table.element(a, round(mysum$coefficients[i,2],6))
a<-table.element(a, round(mysum$coefficients[i,3],4))
a<-table.element(a, round(mysum$coefficients[i,4],6))
a<-table.element(a, round(mysum$coefficients[i,4]/2,6))
a<-table.row.end(a)
}
a<-table.end(a)
table.save(a,file='mytable2.tab')
a<-table.start()
a<-table.row.start(a)
a<-table.element(a, 'Multiple Linear Regression - Regression Statistics', 2, TRUE)
a<-table.row.end(a)
a<-table.row.start(a)
a<-table.element(a, 'Multiple R',1,TRUE)
a<-table.element(a, sqrt(mysum$r.squared))
a<-table.row.end(a)
a<-table.row.start(a)
a<-table.element(a, 'R-squared',1,TRUE)
a<-table.element(a, mysum$r.squared)
a<-table.row.end(a)
a<-table.row.start(a)
a<-table.element(a, 'Adjusted R-squared',1,TRUE)
a<-table.element(a, mysum$adj.r.squared)
a<-table.row.end(a)
a<-table.row.start(a)
a<-table.element(a, 'F-TEST (value)',1,TRUE)
a<-table.element(a, mysum$fstatistic[1])
a<-table.row.end(a)
a<-table.row.start(a)
a<-table.element(a, 'F-TEST (DF numerator)',1,TRUE)
a<-table.element(a, mysum$fstatistic[2])
a<-table.row.end(a)
a<-table.row.start(a)
a<-table.element(a, 'F-TEST (DF denominator)',1,TRUE)
a<-table.element(a, mysum$fstatistic[3])
a<-table.row.end(a)
a<-table.row.start(a)
a<-table.element(a, 'p-value',1,TRUE)
a<-table.element(a, 1-pf(mysum$fstatistic[1],mysum$fstatistic[2],mysum$fstatistic[3]))
a<-table.row.end(a)
a<-table.row.start(a)
a<-table.element(a, 'Multiple Linear Regression - Residual Statistics', 2, TRUE)
a<-table.row.end(a)
a<-table.row.start(a)
a<-table.element(a, 'Residual Standard Deviation',1,TRUE)
a<-table.element(a, mysum$sigma)
a<-table.row.end(a)
a<-table.row.start(a)
a<-table.element(a, 'Sum Squared Residuals',1,TRUE)
a<-table.element(a, sum(myerror*myerror))
a<-table.row.end(a)
a<-table.end(a)
table.save(a,file='mytable3.tab')
a<-table.start()
a<-table.row.start(a)
a<-table.element(a, 'Multiple Linear Regression - Actuals, Interpolation, and Residuals', 4, TRUE)
a<-table.row.end(a)
a<-table.row.start(a)
a<-table.element(a, 'Time or Index', 1, TRUE)
a<-table.element(a, 'Actuals', 1, TRUE)
a<-table.element(a, 'Interpolation
Forecast', 1, TRUE)
a<-table.element(a, 'Residuals
Prediction Error', 1, TRUE)
a<-table.row.end(a)
for (i in 1:n) {
a<-table.row.start(a)
a<-table.element(a,i, 1, TRUE)
a<-table.element(a,x[i])
a<-table.element(a,x[i]-mysum$resid[i])
a<-table.element(a,mysum$resid[i])
a<-table.row.end(a)
}
a<-table.end(a)
table.save(a,file='mytable4.tab')
if (n > n25) {
a<-table.start()
a<-table.row.start(a)
a<-table.element(a,'Goldfeld-Quandt test for Heteroskedasticity',4,TRUE)
a<-table.row.end(a)
a<-table.row.start(a)
a<-table.element(a,'p-values',header=TRUE)
a<-table.element(a,'Alternative Hypothesis',3,header=TRUE)
a<-table.row.end(a)
a<-table.row.start(a)
a<-table.element(a,'breakpoint index',header=TRUE)
a<-table.element(a,'greater',header=TRUE)
a<-table.element(a,'2-sided',header=TRUE)
a<-table.element(a,'less',header=TRUE)
a<-table.row.end(a)
for (mypoint in kp3:nmkm3) {
a<-table.row.start(a)
a<-table.element(a,mypoint,header=TRUE)
a<-table.element(a,gqarr[mypoint-kp3+1,1])
a<-table.element(a,gqarr[mypoint-kp3+1,2])
a<-table.element(a,gqarr[mypoint-kp3+1,3])
a<-table.row.end(a)
}
a<-table.end(a)
table.save(a,file='mytable5.tab')
a<-table.start()
a<-table.row.start(a)
a<-table.element(a,'Meta Analysis of Goldfeld-Quandt test for Heteroskedasticity',4,TRUE)
a<-table.row.end(a)
a<-table.row.start(a)
a<-table.element(a,'Description',header=TRUE)
a<-table.element(a,'# significant tests',header=TRUE)
a<-table.element(a,'% significant tests',header=TRUE)
a<-table.element(a,'OK/NOK',header=TRUE)
a<-table.row.end(a)
a<-table.row.start(a)
a<-table.element(a,'1% type I error level',header=TRUE)
a<-table.element(a,numsignificant1)
a<-table.element(a,numsignificant1/numgqtests)
if (numsignificant1/numgqtests < 0.01) dum <- 'OK' else dum <- 'NOK'
a<-table.element(a,dum)
a<-table.row.end(a)
a<-table.row.start(a)
a<-table.element(a,'5% type I error level',header=TRUE)
a<-table.element(a,numsignificant5)
a<-table.element(a,numsignificant5/numgqtests)
if (numsignificant5/numgqtests < 0.05) dum <- 'OK' else dum <- 'NOK'
a<-table.element(a,dum)
a<-table.row.end(a)
a<-table.row.start(a)
a<-table.element(a,'10% type I error level',header=TRUE)
a<-table.element(a,numsignificant10)
a<-table.element(a,numsignificant10/numgqtests)
if (numsignificant10/numgqtests < 0.1) dum <- 'OK' else dum <- 'NOK'
a<-table.element(a,dum)
a<-table.row.end(a)
a<-table.end(a)
table.save(a,file='mytable6.tab')
}