Free Statistics

of Irreproducible Research!

Author's title

Author*The author of this computation has been verified*
R Software Modulerwasp_autocorrelation.wasp
Title produced by software(Partial) Autocorrelation Function
Date of computationSat, 28 Nov 2009 11:28:34 -0700
Cite this page as followsStatistical Computations at FreeStatistics.org, Office for Research Development and Education, URL https://freestatistics.org/blog/index.php?v=date/2009/Nov/28/t1259433024fooln9fzi0fndlt.htm/, Retrieved Fri, 03 May 2024 12:53:50 +0000
Statistical Computations at FreeStatistics.org, Office for Research Development and Education, URL https://freestatistics.org/blog/index.php?pk=61519, Retrieved Fri, 03 May 2024 12:53:50 +0000
QR Codes:

Original text written by user:
IsPrivate?No (this computation is public)
User-defined keywords
Estimated Impact138
Family? (F = Feedback message, R = changed R code, M = changed R Module, P = changed Parameters, D = changed Data)
F       [(Partial) Autocorrelation Function] [] [2009-11-28 18:28:34] [aef022288383377281176d9807aba5bf] [Current]
- R P     [(Partial) Autocorrelation Function] [Review WS 8] [2009-12-01 20:55:58] [1f74ef2f756548f1f3a7b6136ea56d7f]
Feedback Forum
2009-12-04 13:07:29 [Angelo Stuer] [reply
Let op dat je niet te veel differentieert. Je ziet duidelijk dat het seizoenaal differentiëren niks verandert aan de tijdreeks dus is het ook niet nodig dit te doen.

Post a new message
Dataseries X:
102.86
102.55
102.28
102.26
102.57
103.08
102.76
102.51
102.87
103.14
103.12
103.16
102.48
102.57
102.88
102.63
102.38
101.69
101.96
102.19
101.87
101.6
101.63
101.22
101.21
101.49
101.64
101.66
101.77
101.82
101.78
101.28
101.29
101.37
101.12
101.51
102.24
102.94
103.09
103.46
103.64
104.39
104.15
105.21
105.8
105.91
105.39
105.46
104.72
103.14
102.63
102.32
101.93
100.62
100.6
99.63
98.9
98.32
99.22
98.81


Summary of computational transaction
Raw Inputview raw input (R code)
Raw Outputview raw output of R engine
Computing time1 seconds
R Server'Gwilym Jenkins' @ 72.249.127.135

\begin{tabular}{lllllllll}
\hline
Summary of computational transaction \tabularnewline
Raw Input & view raw input (R code)  \tabularnewline
Raw Output & view raw output of R engine  \tabularnewline
Computing time & 1 seconds \tabularnewline
R Server & 'Gwilym Jenkins' @ 72.249.127.135 \tabularnewline
\hline
\end{tabular}
%Source: https://freestatistics.org/blog/index.php?pk=61519&T=0

[TABLE]
[ROW][C]Summary of computational transaction[/C][/ROW]
[ROW][C]Raw Input[/C][C]view raw input (R code) [/C][/ROW]
[ROW][C]Raw Output[/C][C]view raw output of R engine [/C][/ROW]
[ROW][C]Computing time[/C][C]1 seconds[/C][/ROW]
[ROW][C]R Server[/C][C]'Gwilym Jenkins' @ 72.249.127.135[/C][/ROW]
[/TABLE]
Source: https://freestatistics.org/blog/index.php?pk=61519&T=0

Globally Unique Identifier (entire table): ba.freestatistics.org/blog/index.php?pk=61519&T=0

As an alternative you can also use a QR Code:  

The GUIDs for individual cells are displayed in the table below:

Summary of computational transaction
Raw Inputview raw input (R code)
Raw Outputview raw output of R engine
Computing time1 seconds
R Server'Gwilym Jenkins' @ 72.249.127.135


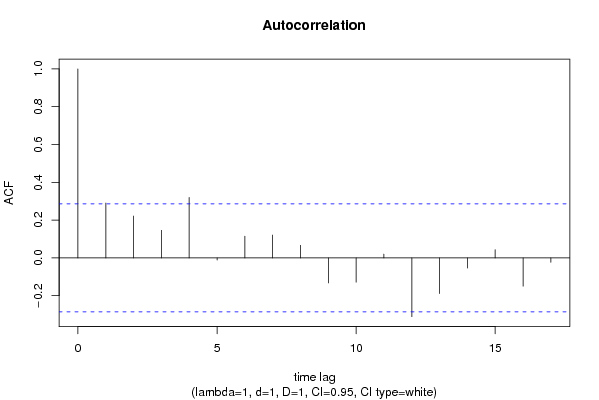
Autocorrelation Function
Time lag kACF(k)T-STATP-value
10.2901871.98940.026246
20.2211891.51640.068059
30.1459771.00080.161032
40.3198012.19240.016667
5-0.011316-0.07760.469247
60.1146140.78580.217977
70.1206520.82710.206167
80.066420.45540.325477
9-0.13234-0.90730.184445
10-0.12855-0.88130.191322
110.0198750.13630.4461
12-0.311101-2.13280.019097
13-0.188652-1.29330.101108
14-0.053904-0.36960.356689
150.0431440.29580.384351
16-0.149696-1.02630.155011
17-0.023376-0.16030.436682

\begin{tabular}{lllllllll}
\hline
Autocorrelation Function \tabularnewline
Time lag k & ACF(k) & T-STAT & P-value \tabularnewline
1 & 0.290187 & 1.9894 & 0.026246 \tabularnewline
2 & 0.221189 & 1.5164 & 0.068059 \tabularnewline
3 & 0.145977 & 1.0008 & 0.161032 \tabularnewline
4 & 0.319801 & 2.1924 & 0.016667 \tabularnewline
5 & -0.011316 & -0.0776 & 0.469247 \tabularnewline
6 & 0.114614 & 0.7858 & 0.217977 \tabularnewline
7 & 0.120652 & 0.8271 & 0.206167 \tabularnewline
8 & 0.06642 & 0.4554 & 0.325477 \tabularnewline
9 & -0.13234 & -0.9073 & 0.184445 \tabularnewline
10 & -0.12855 & -0.8813 & 0.191322 \tabularnewline
11 & 0.019875 & 0.1363 & 0.4461 \tabularnewline
12 & -0.311101 & -2.1328 & 0.019097 \tabularnewline
13 & -0.188652 & -1.2933 & 0.101108 \tabularnewline
14 & -0.053904 & -0.3696 & 0.356689 \tabularnewline
15 & 0.043144 & 0.2958 & 0.384351 \tabularnewline
16 & -0.149696 & -1.0263 & 0.155011 \tabularnewline
17 & -0.023376 & -0.1603 & 0.436682 \tabularnewline
\hline
\end{tabular}
%Source: https://freestatistics.org/blog/index.php?pk=61519&T=1

[TABLE]
[ROW][C]Autocorrelation Function[/C][/ROW]
[ROW][C]Time lag k[/C][C]ACF(k)[/C][C]T-STAT[/C][C]P-value[/C][/ROW]
[ROW][C]1[/C][C]0.290187[/C][C]1.9894[/C][C]0.026246[/C][/ROW]
[ROW][C]2[/C][C]0.221189[/C][C]1.5164[/C][C]0.068059[/C][/ROW]
[ROW][C]3[/C][C]0.145977[/C][C]1.0008[/C][C]0.161032[/C][/ROW]
[ROW][C]4[/C][C]0.319801[/C][C]2.1924[/C][C]0.016667[/C][/ROW]
[ROW][C]5[/C][C]-0.011316[/C][C]-0.0776[/C][C]0.469247[/C][/ROW]
[ROW][C]6[/C][C]0.114614[/C][C]0.7858[/C][C]0.217977[/C][/ROW]
[ROW][C]7[/C][C]0.120652[/C][C]0.8271[/C][C]0.206167[/C][/ROW]
[ROW][C]8[/C][C]0.06642[/C][C]0.4554[/C][C]0.325477[/C][/ROW]
[ROW][C]9[/C][C]-0.13234[/C][C]-0.9073[/C][C]0.184445[/C][/ROW]
[ROW][C]10[/C][C]-0.12855[/C][C]-0.8813[/C][C]0.191322[/C][/ROW]
[ROW][C]11[/C][C]0.019875[/C][C]0.1363[/C][C]0.4461[/C][/ROW]
[ROW][C]12[/C][C]-0.311101[/C][C]-2.1328[/C][C]0.019097[/C][/ROW]
[ROW][C]13[/C][C]-0.188652[/C][C]-1.2933[/C][C]0.101108[/C][/ROW]
[ROW][C]14[/C][C]-0.053904[/C][C]-0.3696[/C][C]0.356689[/C][/ROW]
[ROW][C]15[/C][C]0.043144[/C][C]0.2958[/C][C]0.384351[/C][/ROW]
[ROW][C]16[/C][C]-0.149696[/C][C]-1.0263[/C][C]0.155011[/C][/ROW]
[ROW][C]17[/C][C]-0.023376[/C][C]-0.1603[/C][C]0.436682[/C][/ROW]
[/TABLE]
Source: https://freestatistics.org/blog/index.php?pk=61519&T=1

Globally Unique Identifier (entire table): ba.freestatistics.org/blog/index.php?pk=61519&T=1

As an alternative you can also use a QR Code:  

The GUIDs for individual cells are displayed in the table below:

Autocorrelation Function
Time lag kACF(k)T-STATP-value
10.2901871.98940.026246
20.2211891.51640.068059
30.1459771.00080.161032
40.3198012.19240.016667
5-0.011316-0.07760.469247
60.1146140.78580.217977
70.1206520.82710.206167
80.066420.45540.325477
9-0.13234-0.90730.184445
10-0.12855-0.88130.191322
110.0198750.13630.4461
12-0.311101-2.13280.019097
13-0.188652-1.29330.101108
14-0.053904-0.36960.356689
150.0431440.29580.384351
16-0.149696-1.02630.155011
17-0.023376-0.16030.436682


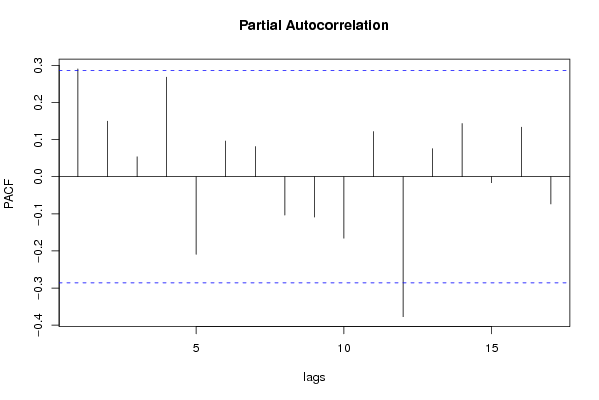
Partial Autocorrelation Function
Time lag kPACF(k)T-STATP-value
10.2901871.98940.026246
20.1495761.02540.155202
30.0535980.36740.357466
40.267981.83720.036255
5-0.208922-1.43230.079339
60.0959250.65760.256993
70.081110.55610.290404
8-0.103306-0.70820.241149
9-0.108833-0.74610.229654
10-0.165488-1.13450.131164
110.1215840.83350.204379
12-0.376967-2.58440.006461
130.0753240.51640.304
140.1431190.98120.165765
15-0.016065-0.11010.456386
160.1331730.9130.182955
17-0.073251-0.50220.308941

\begin{tabular}{lllllllll}
\hline
Partial Autocorrelation Function \tabularnewline
Time lag k & PACF(k) & T-STAT & P-value \tabularnewline
1 & 0.290187 & 1.9894 & 0.026246 \tabularnewline
2 & 0.149576 & 1.0254 & 0.155202 \tabularnewline
3 & 0.053598 & 0.3674 & 0.357466 \tabularnewline
4 & 0.26798 & 1.8372 & 0.036255 \tabularnewline
5 & -0.208922 & -1.4323 & 0.079339 \tabularnewline
6 & 0.095925 & 0.6576 & 0.256993 \tabularnewline
7 & 0.08111 & 0.5561 & 0.290404 \tabularnewline
8 & -0.103306 & -0.7082 & 0.241149 \tabularnewline
9 & -0.108833 & -0.7461 & 0.229654 \tabularnewline
10 & -0.165488 & -1.1345 & 0.131164 \tabularnewline
11 & 0.121584 & 0.8335 & 0.204379 \tabularnewline
12 & -0.376967 & -2.5844 & 0.006461 \tabularnewline
13 & 0.075324 & 0.5164 & 0.304 \tabularnewline
14 & 0.143119 & 0.9812 & 0.165765 \tabularnewline
15 & -0.016065 & -0.1101 & 0.456386 \tabularnewline
16 & 0.133173 & 0.913 & 0.182955 \tabularnewline
17 & -0.073251 & -0.5022 & 0.308941 \tabularnewline
\hline
\end{tabular}
%Source: https://freestatistics.org/blog/index.php?pk=61519&T=2

[TABLE]
[ROW][C]Partial Autocorrelation Function[/C][/ROW]
[ROW][C]Time lag k[/C][C]PACF(k)[/C][C]T-STAT[/C][C]P-value[/C][/ROW]
[ROW][C]1[/C][C]0.290187[/C][C]1.9894[/C][C]0.026246[/C][/ROW]
[ROW][C]2[/C][C]0.149576[/C][C]1.0254[/C][C]0.155202[/C][/ROW]
[ROW][C]3[/C][C]0.053598[/C][C]0.3674[/C][C]0.357466[/C][/ROW]
[ROW][C]4[/C][C]0.26798[/C][C]1.8372[/C][C]0.036255[/C][/ROW]
[ROW][C]5[/C][C]-0.208922[/C][C]-1.4323[/C][C]0.079339[/C][/ROW]
[ROW][C]6[/C][C]0.095925[/C][C]0.6576[/C][C]0.256993[/C][/ROW]
[ROW][C]7[/C][C]0.08111[/C][C]0.5561[/C][C]0.290404[/C][/ROW]
[ROW][C]8[/C][C]-0.103306[/C][C]-0.7082[/C][C]0.241149[/C][/ROW]
[ROW][C]9[/C][C]-0.108833[/C][C]-0.7461[/C][C]0.229654[/C][/ROW]
[ROW][C]10[/C][C]-0.165488[/C][C]-1.1345[/C][C]0.131164[/C][/ROW]
[ROW][C]11[/C][C]0.121584[/C][C]0.8335[/C][C]0.204379[/C][/ROW]
[ROW][C]12[/C][C]-0.376967[/C][C]-2.5844[/C][C]0.006461[/C][/ROW]
[ROW][C]13[/C][C]0.075324[/C][C]0.5164[/C][C]0.304[/C][/ROW]
[ROW][C]14[/C][C]0.143119[/C][C]0.9812[/C][C]0.165765[/C][/ROW]
[ROW][C]15[/C][C]-0.016065[/C][C]-0.1101[/C][C]0.456386[/C][/ROW]
[ROW][C]16[/C][C]0.133173[/C][C]0.913[/C][C]0.182955[/C][/ROW]
[ROW][C]17[/C][C]-0.073251[/C][C]-0.5022[/C][C]0.308941[/C][/ROW]
[/TABLE]
Source: https://freestatistics.org/blog/index.php?pk=61519&T=2

Globally Unique Identifier (entire table): ba.freestatistics.org/blog/index.php?pk=61519&T=2

As an alternative you can also use a QR Code:  

The GUIDs for individual cells are displayed in the table below:

Partial Autocorrelation Function
Time lag kPACF(k)T-STATP-value
10.2901871.98940.026246
20.1495761.02540.155202
30.0535980.36740.357466
40.267981.83720.036255
5-0.208922-1.43230.079339
60.0959250.65760.256993
70.081110.55610.290404
8-0.103306-0.70820.241149
9-0.108833-0.74610.229654
10-0.165488-1.13450.131164
110.1215840.83350.204379
12-0.376967-2.58440.006461
130.0753240.51640.304
140.1431190.98120.165765
15-0.016065-0.11010.456386
160.1331730.9130.182955
17-0.073251-0.50220.308941


Parameters (Session):
par1 = Default ; par2 = 1 ; par3 = 1 ; par4 = 1 ; par5 = 12 ; par6 = White Noise ; par7 = 0.95 ;
Parameters (R input):
par1 = Default ; par2 = 1 ; par3 = 1 ; par4 = 1 ; par5 = 12 ; par6 = White Noise ; par7 = 0.95 ;
R code (references can be found in the software module):
if (par1 == 'Default') {
par1 = 10*log10(length(x))
} else {
par1 <- as.numeric(par1)
}
par2 <- as.numeric(par2)
par3 <- as.numeric(par3)
par4 <- as.numeric(par4)
par5 <- as.numeric(par5)
if (par6 == 'White Noise') par6 <- 'white' else par6 <- 'ma'
par7 <- as.numeric(par7)
if (par2 == 0) {
x <- log(x)
} else {
x <- (x ^ par2 - 1) / par2
}
if (par3 > 0) x <- diff(x,lag=1,difference=par3)
if (par4 > 0) x <- diff(x,lag=par5,difference=par4)
bitmap(file='pic1.png')
racf <- acf(x, par1, main='Autocorrelation', xlab='time lag', ylab='ACF', ci.type=par6, ci=par7, sub=paste('(lambda=',par2,', d=',par3,', D=',par4,', CI=', par7, ', CI type=',par6,')',sep=''))
dev.off()
bitmap(file='pic2.png')
rpacf <- pacf(x,par1,main='Partial Autocorrelation',xlab='lags',ylab='PACF')
dev.off()
(myacf <- c(racf$acf))
(mypacf <- c(rpacf$acf))
lengthx <- length(x)
sqrtn <- sqrt(lengthx)
load(file='createtable')
a<-table.start()
a<-table.row.start(a)
a<-table.element(a,'Autocorrelation Function',4,TRUE)
a<-table.row.end(a)
a<-table.row.start(a)
a<-table.element(a,'Time lag k',header=TRUE)
a<-table.element(a,hyperlink('basics.htm','ACF(k)','click here for more information about the Autocorrelation Function'),header=TRUE)
a<-table.element(a,'T-STAT',header=TRUE)
a<-table.element(a,'P-value',header=TRUE)
a<-table.row.end(a)
for (i in 2:(par1+1)) {
a<-table.row.start(a)
a<-table.element(a,i-1,header=TRUE)
a<-table.element(a,round(myacf[i],6))
mytstat <- myacf[i]*sqrtn
a<-table.element(a,round(mytstat,4))
a<-table.element(a,round(1-pt(abs(mytstat),lengthx),6))
a<-table.row.end(a)
}
a<-table.end(a)
table.save(a,file='mytable.tab')
a<-table.start()
a<-table.row.start(a)
a<-table.element(a,'Partial Autocorrelation Function',4,TRUE)
a<-table.row.end(a)
a<-table.row.start(a)
a<-table.element(a,'Time lag k',header=TRUE)
a<-table.element(a,hyperlink('basics.htm','PACF(k)','click here for more information about the Partial Autocorrelation Function'),header=TRUE)
a<-table.element(a,'T-STAT',header=TRUE)
a<-table.element(a,'P-value',header=TRUE)
a<-table.row.end(a)
for (i in 1:par1) {
a<-table.row.start(a)
a<-table.element(a,i,header=TRUE)
a<-table.element(a,round(mypacf[i],6))
mytstat <- mypacf[i]*sqrtn
a<-table.element(a,round(mytstat,4))
a<-table.element(a,round(1-pt(abs(mytstat),lengthx),6))
a<-table.row.end(a)
}
a<-table.end(a)
table.save(a,file='mytable1.tab')