| Multiple Linear Regression - Estimated Regression Equation |
| werkl[t] = + 9.34448245145198 -0.484143951541065infl[t] + 0.0999999999999908M1[t] + 0.0503171209691788M2[t] + 0.0890486370924635M3[t] + 0.0580972741849276M4[t] + 0.155560306431498M5[t] + 0.164608943523962M6[t] + 0.125243185462319M7[t] + 0.0865116693390339M8[t] + 0.0471459112773918M9[t] + 0.106511669339034M10[t] + 0.0187315161232850M11[t] + e[t] |
| Multiple Linear Regression - Ordinary Least Squares | |||||
| Variable | Parameter | S.D. | T-STAT H0: parameter = 0 | 2-tail p-value | 1-tail p-value |
| (Intercept) | 9.34448245145198 | 0.450109 | 20.7605 | 0 | 0 |
| infl | -0.484143951541065 | 0.145973 | -3.3167 | 0.001763 | 0.000881 |
| M1 | 0.0999999999999908 | 0.437453 | 0.2286 | 0.820174 | 0.410087 |
| M2 | 0.0503171209691788 | 0.437462 | 0.115 | 0.908919 | 0.454459 |
| M3 | 0.0890486370924635 | 0.43754 | 0.2035 | 0.839606 | 0.419803 |
| M4 | 0.0580972741849276 | 0.437803 | 0.1327 | 0.894996 | 0.447498 |
| M5 | 0.155560306431498 | 0.439358 | 0.3541 | 0.724875 | 0.362438 |
| M6 | 0.164608943523962 | 0.440259 | 0.3739 | 0.710167 | 0.355083 |
| M7 | 0.125243185462319 | 0.439639 | 0.2849 | 0.77699 | 0.388495 |
| M8 | 0.0865116693390339 | 0.43863 | 0.1972 | 0.844497 | 0.422248 |
| M9 | 0.0471459112773918 | 0.438241 | 0.1076 | 0.914787 | 0.457393 |
| M10 | 0.106511669339034 | 0.43863 | 0.2428 | 0.809195 | 0.404598 |
| M11 | 0.0187315161232850 | 0.437608 | 0.0428 | 0.966039 | 0.483019 |
| Multiple Linear Regression - Regression Statistics | |
| Multiple R | 0.438622344152539 |
| R-squared | 0.192389560789868 |
| Adjusted R-squared | -0.0138088492212289 |
| F-TEST (value) | 0.933031252663462 |
| F-TEST (DF numerator) | 12 |
| F-TEST (DF denominator) | 47 |
| p-value | 0.523093765381267 |
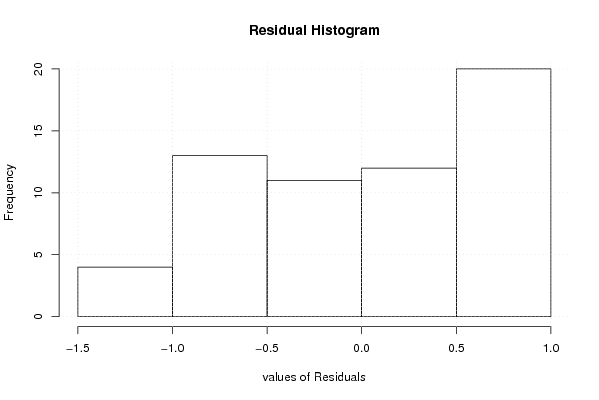
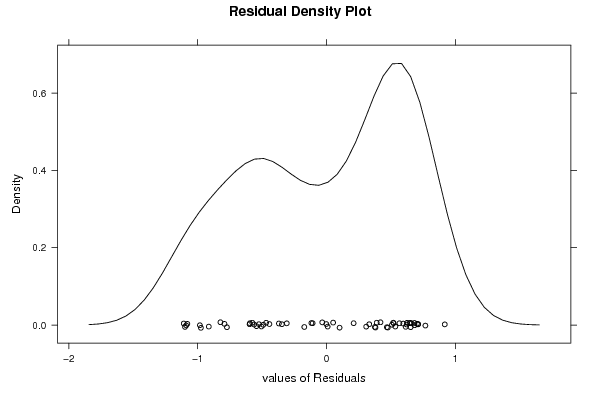
| Multiple Linear Regression - Residual Statistics | |
| Residual Standard Deviation | 0.691673198671604 |
| Sum Squared Residuals | 22.4853552467486 |
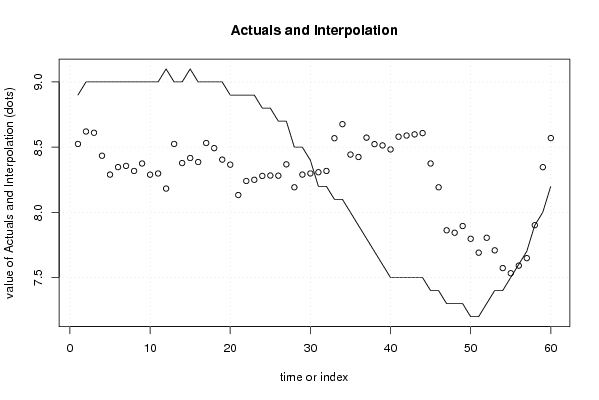
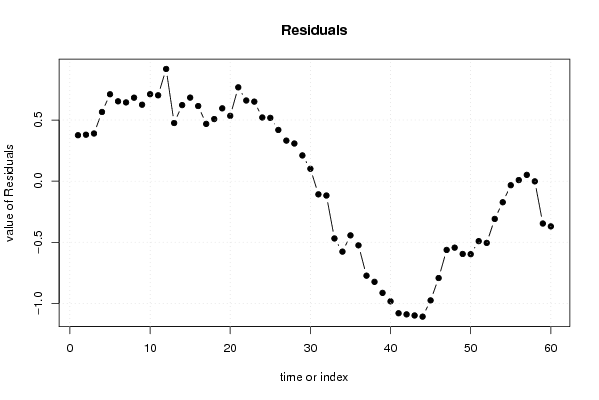
| Multiple Linear Regression - Actuals, Interpolation, and Residuals | |||
| Time or Index | Actuals | Interpolation Forecast | Residuals Prediction Error |
| 1 | 8.9 | 8.524608943524 | 0.375391056476 |
| 2 | 9 | 8.62016924995546 | 0.379830750044541 |
| 3 | 9 | 8.61048637092464 | 0.389513629075362 |
| 4 | 9 | 8.43429182255478 | 0.565708177445217 |
| 5 | 9 | 8.28968287903082 | 0.710317120969179 |
| 6 | 9 | 8.3471459112774 | 0.652854088722608 |
| 7 | 9 | 8.35619454836986 | 0.643805451630144 |
| 8 | 9 | 8.31746303224657 | 0.682536967753429 |
| 9 | 9 | 8.37492606449314 | 0.625073935506859 |
| 10 | 9 | 8.28904863709246 | 0.710951362907536 |
| 11 | 9 | 8.29809727418493 | 0.701902725815072 |
| 12 | 9.1 | 8.18253696775343 | 0.91746303224657 |
| 13 | 9 | 8.52460894352395 | 0.475391056476048 |
| 14 | 9 | 8.37809727418493 | 0.621902725815072 |
| 15 | 9.1 | 8.41682879030821 | 0.683171209691787 |
| 16 | 9 | 8.38587742740068 | 0.614122572599323 |
| 17 | 9 | 8.53175485480135 | 0.468245145198646 |
| 18 | 9 | 8.49238909673971 | 0.507610903260289 |
| 19 | 9 | 8.40460894352396 | 0.595391056476038 |
| 20 | 8.9 | 8.36587742740068 | 0.534122572599324 |
| 21 | 8.9 | 8.13285408872261 | 0.767145911277392 |
| 22 | 8.9 | 8.24063424193836 | 0.659365758061643 |
| 23 | 8.9 | 8.24968287903082 | 0.650317120969179 |
| 24 | 8.8 | 8.27936575806164 | 0.520634241938358 |
| 25 | 8.8 | 8.28253696775342 | 0.51746303224658 |
| 26 | 8.7 | 8.28126848387672 | 0.418731516123284 |
| 27 | 8.7 | 8.3684143951541 | 0.331585604845893 |
| 28 | 8.5 | 8.19221984678425 | 0.307780153215749 |
| 29 | 8.5 | 8.28968287903082 | 0.210317120969178 |
| 30 | 8.4 | 8.29873151612328 | 0.101268483876715 |
| 31 | 8.2 | 8.30778015321575 | -0.10778015321575 |
| 32 | 8.2 | 8.31746303224657 | -0.117463032246571 |
| 33 | 8.1 | 8.56858364510957 | -0.468583645109567 |
| 34 | 8.1 | 8.67636379832532 | -0.576363798325316 |
| 35 | 8 | 8.44334045964725 | -0.443340459647247 |
| 36 | 7.9 | 8.42460894352396 | -0.524608943523962 |
| 37 | 7.8 | 8.57302333867806 | -0.77302333867806 |
| 38 | 7.7 | 8.52334045964725 | -0.823340459647247 |
| 39 | 7.6 | 8.51365758061642 | -0.913657580616426 |
| 40 | 7.5 | 8.48270621770889 | -0.98270621770889 |
| 41 | 7.5 | 8.58016924995546 | -1.08016924995546 |
| 42 | 7.5 | 8.58921788704792 | -1.08921788704792 |
| 43 | 7.5 | 8.59826652414039 | -1.09826652414039 |
| 44 | 7.5 | 8.6079494031712 | -1.10794940317121 |
| 45 | 7.4 | 8.37492606449314 | -0.97492606449314 |
| 46 | 7.4 | 8.19221984678425 | -0.79221984678425 |
| 47 | 7.3 | 7.86236771779797 | -0.56236771779797 |
| 48 | 7.3 | 7.84363620167469 | -0.543636201674685 |
| 49 | 7.3 | 7.89522180652057 | -0.595221806520569 |
| 50 | 7.2 | 7.79712453233565 | -0.59712453233565 |
| 51 | 7.2 | 7.69061286299662 | -0.490612862996616 |
| 52 | 7.3 | 7.8049046855514 | -0.504904685551399 |
| 53 | 7.4 | 7.70871013718154 | -0.308710137181544 |
| 54 | 7.4 | 7.57251558881169 | -0.172515588811688 |
| 55 | 7.5 | 7.53314983075005 | -0.0331498307500458 |
| 56 | 7.6 | 7.59124710493497 | 0.0087528950650263 |
| 57 | 7.7 | 7.64871013718154 | 0.0512898628184562 |
| 58 | 7.9 | 7.90173347585961 | -0.00173347585961171 |
| 59 | 8 | 8.34651166933903 | -0.346511669339034 |
| 60 | 8.2 | 8.56985212898628 | -0.369852128986282 |
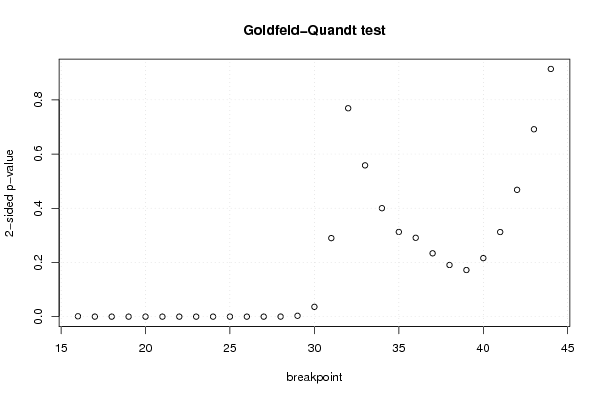
| Goldfeld-Quandt test for Heteroskedasticity | |||
| p-values | Alternative Hypothesis | ||
| breakpoint index | greater | 2-sided | less |
| 16 | 0.000697989967363515 | 0.00139597993472703 | 0.999302010032636 |
| 17 | 5.78564290888853e-05 | 0.000115712858177771 | 0.99994214357091 |
| 18 | 4.23915078926217e-06 | 8.47830157852434e-06 | 0.99999576084921 |
| 19 | 3.08190685036631e-07 | 6.16381370073261e-07 | 0.999999691809315 |
| 20 | 8.79520420503894e-08 | 1.75904084100779e-07 | 0.999999912047958 |
| 21 | 4.27369409037339e-08 | 8.54738818074678e-08 | 0.99999995726306 |
| 22 | 1.40184697940510e-08 | 2.80369395881021e-08 | 0.99999998598153 |
| 23 | 5.14919880119734e-09 | 1.02983976023947e-08 | 0.999999994850801 |
| 24 | 1.16246869537657e-07 | 2.32493739075314e-07 | 0.99999988375313 |
| 25 | 1.23130353760903e-07 | 2.46260707521805e-07 | 0.999999876869646 |
| 26 | 7.7283795597078e-07 | 1.54567591194156e-06 | 0.999999227162044 |
| 27 | 7.19839503419977e-06 | 1.43967900683995e-05 | 0.999992801604966 |
| 28 | 0.000121403844401110 | 0.000242807688802221 | 0.999878596155599 |
| 29 | 0.00158687446096917 | 0.00317374892193834 | 0.99841312553903 |
| 30 | 0.0181216007853252 | 0.0362432015706505 | 0.981878399214675 |
| 31 | 0.144898410331370 | 0.289796820662739 | 0.85510158966863 |
| 32 | 0.384541631498602 | 0.769083262997205 | 0.615458368501398 |
| 33 | 0.7208263037632 | 0.5583473924736 | 0.2791736962368 |
| 34 | 0.799858593784743 | 0.400282812430514 | 0.200141406215257 |
| 35 | 0.843728962428615 | 0.312542075142769 | 0.156271037571385 |
| 36 | 0.854508403458303 | 0.290983193083394 | 0.145491596541697 |
| 37 | 0.883122114887575 | 0.233755770224850 | 0.116877885112425 |
| 38 | 0.904681476611247 | 0.190637046777507 | 0.0953185233887533 |
| 39 | 0.913992660992047 | 0.172014678015906 | 0.0860073390079531 |
| 40 | 0.891979601912467 | 0.216040796175066 | 0.108020398087533 |
| 41 | 0.843883149251065 | 0.312233701497870 | 0.156116850748935 |
| 42 | 0.766015335470025 | 0.467969329059951 | 0.233984664529975 |
| 43 | 0.654218821352735 | 0.69156235729453 | 0.345781178647265 |
| 44 | 0.542955838771419 | 0.914088322457163 | 0.457044161228581 |
| Meta Analysis of Goldfeld-Quandt test for Heteroskedasticity | |||
| Description | # significant tests | % significant tests | OK/NOK |
| 1% type I error level | 14 | 0.482758620689655 | NOK |
| 5% type I error level | 15 | 0.517241379310345 | NOK |
| 10% type I error level | 15 | 0.517241379310345 | NOK |