Free Statistics

of Irreproducible Research!

Author's title

Author*The author of this computation has been verified*
R Software Modulerwasp_autocorrelation.wasp
Title produced by software(Partial) Autocorrelation Function
Date of computationFri, 27 Nov 2009 09:27:54 -0700
Cite this page as followsStatistical Computations at FreeStatistics.org, Office for Research Development and Education, URL https://freestatistics.org/blog/index.php?v=date/2009/Nov/27/t12593393906ocq2v14aq90hf3.htm/, Retrieved Mon, 29 Apr 2024 23:38:48 +0000
Statistical Computations at FreeStatistics.org, Office for Research Development and Education, URL https://freestatistics.org/blog/index.php?pk=60961, Retrieved Mon, 29 Apr 2024 23:38:48 +0000
QR Codes:

Original text written by user:
IsPrivate?No (this computation is public)
User-defined keywords
Estimated Impact143
Family? (F = Feedback message, R = changed R code, M = changed R Module, P = changed Parameters, D = changed Data)
-       [(Partial) Autocorrelation Function] [] [2009-11-27 16:27:54] [477c9cb8e7bda18f2375c22a66069c90] [Current]
Feedback Forum

Post a new message
Dataseries X:
92.9
107.7
103.5
91.1
79.8
71.9
82.9
90.1
100.7
90.7
108.8
44.1
93.6
107.4
96.5
93.6
76.5
76.7
84
103.3
88.5
99
105.9
44.7
94
107.1
104.8
102.5
77.7
85.2
91.3
106.5
92.4
97.5
107
51.1
98.6
102.2
114.3
99.4
72.5
92.3
99.4
85.9
109.4
97.6
104.7
56.9
86.7
108.5
103.4
86.2
71
75.9
87.1
102
88.5
87.8
100.8
50.6
85.9


Summary of computational transaction
Raw Inputview raw input (R code)
Raw Outputview raw output of R engine
Computing time1 seconds
R Server'Gwilym Jenkins' @ 72.249.127.135

\begin{tabular}{lllllllll}
\hline
Summary of computational transaction \tabularnewline
Raw Input & view raw input (R code)  \tabularnewline
Raw Output & view raw output of R engine  \tabularnewline
Computing time & 1 seconds \tabularnewline
R Server & 'Gwilym Jenkins' @ 72.249.127.135 \tabularnewline
\hline
\end{tabular}
%Source: https://freestatistics.org/blog/index.php?pk=60961&T=0

[TABLE]
[ROW][C]Summary of computational transaction[/C][/ROW]
[ROW][C]Raw Input[/C][C]view raw input (R code) [/C][/ROW]
[ROW][C]Raw Output[/C][C]view raw output of R engine [/C][/ROW]
[ROW][C]Computing time[/C][C]1 seconds[/C][/ROW]
[ROW][C]R Server[/C][C]'Gwilym Jenkins' @ 72.249.127.135[/C][/ROW]
[/TABLE]
Source: https://freestatistics.org/blog/index.php?pk=60961&T=0

Globally Unique Identifier (entire table): ba.freestatistics.org/blog/index.php?pk=60961&T=0

As an alternative you can also use a QR Code:  

The GUIDs for individual cells are displayed in the table below:

Summary of computational transaction
Raw Inputview raw input (R code)
Raw Outputview raw output of R engine
Computing time1 seconds
R Server'Gwilym Jenkins' @ 72.249.127.135


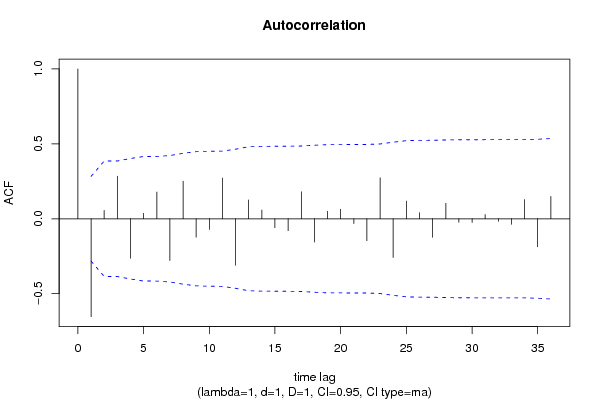
Autocorrelation Function
Time lag kACF(k)T-STATP-value
1-0.653553-4.52792e-05
20.0557610.38630.350483
30.2836911.96550.02758
4-0.263342-1.82450.037153
50.036130.25030.401705
60.1782031.23460.11149
7-0.279043-1.93330.029557
80.2505431.73580.044507
9-0.12284-0.85110.19948
10-0.071759-0.49720.310672
110.2717131.88250.03292
12-0.310174-2.14890.018355
130.1259140.87240.193678
140.0576880.39970.345586
15-0.059604-0.41290.340742
16-0.079305-0.54940.292624
170.1798531.24610.109396
18-0.155853-1.07980.142818
190.0494380.34250.366728
200.0640790.44390.329537
21-0.032238-0.22340.412105
22-0.146688-1.01630.157294
230.2734461.89450.032097
24-0.258136-1.78840.04001
250.1177180.81560.209386
260.0402560.27890.390759
27-0.12428-0.8610.19675
280.1027010.71150.2401
29-0.023409-0.16220.435921
30-0.024381-0.16890.433285
310.0279630.19370.423601
32-0.016792-0.11630.453934
33-0.036867-0.25540.399745
340.1277420.8850.190279
35-0.18721-1.2970.10041
360.149051.03260.153472

\begin{tabular}{lllllllll}
\hline
Autocorrelation Function \tabularnewline
Time lag k & ACF(k) & T-STAT & P-value \tabularnewline
1 & -0.653553 & -4.5279 & 2e-05 \tabularnewline
2 & 0.055761 & 0.3863 & 0.350483 \tabularnewline
3 & 0.283691 & 1.9655 & 0.02758 \tabularnewline
4 & -0.263342 & -1.8245 & 0.037153 \tabularnewline
5 & 0.03613 & 0.2503 & 0.401705 \tabularnewline
6 & 0.178203 & 1.2346 & 0.11149 \tabularnewline
7 & -0.279043 & -1.9333 & 0.029557 \tabularnewline
8 & 0.250543 & 1.7358 & 0.044507 \tabularnewline
9 & -0.12284 & -0.8511 & 0.19948 \tabularnewline
10 & -0.071759 & -0.4972 & 0.310672 \tabularnewline
11 & 0.271713 & 1.8825 & 0.03292 \tabularnewline
12 & -0.310174 & -2.1489 & 0.018355 \tabularnewline
13 & 0.125914 & 0.8724 & 0.193678 \tabularnewline
14 & 0.057688 & 0.3997 & 0.345586 \tabularnewline
15 & -0.059604 & -0.4129 & 0.340742 \tabularnewline
16 & -0.079305 & -0.5494 & 0.292624 \tabularnewline
17 & 0.179853 & 1.2461 & 0.109396 \tabularnewline
18 & -0.155853 & -1.0798 & 0.142818 \tabularnewline
19 & 0.049438 & 0.3425 & 0.366728 \tabularnewline
20 & 0.064079 & 0.4439 & 0.329537 \tabularnewline
21 & -0.032238 & -0.2234 & 0.412105 \tabularnewline
22 & -0.146688 & -1.0163 & 0.157294 \tabularnewline
23 & 0.273446 & 1.8945 & 0.032097 \tabularnewline
24 & -0.258136 & -1.7884 & 0.04001 \tabularnewline
25 & 0.117718 & 0.8156 & 0.209386 \tabularnewline
26 & 0.040256 & 0.2789 & 0.390759 \tabularnewline
27 & -0.12428 & -0.861 & 0.19675 \tabularnewline
28 & 0.102701 & 0.7115 & 0.2401 \tabularnewline
29 & -0.023409 & -0.1622 & 0.435921 \tabularnewline
30 & -0.024381 & -0.1689 & 0.433285 \tabularnewline
31 & 0.027963 & 0.1937 & 0.423601 \tabularnewline
32 & -0.016792 & -0.1163 & 0.453934 \tabularnewline
33 & -0.036867 & -0.2554 & 0.399745 \tabularnewline
34 & 0.127742 & 0.885 & 0.190279 \tabularnewline
35 & -0.18721 & -1.297 & 0.10041 \tabularnewline
36 & 0.14905 & 1.0326 & 0.153472 \tabularnewline
\hline
\end{tabular}
%Source: https://freestatistics.org/blog/index.php?pk=60961&T=1

[TABLE]
[ROW][C]Autocorrelation Function[/C][/ROW]
[ROW][C]Time lag k[/C][C]ACF(k)[/C][C]T-STAT[/C][C]P-value[/C][/ROW]
[ROW][C]1[/C][C]-0.653553[/C][C]-4.5279[/C][C]2e-05[/C][/ROW]
[ROW][C]2[/C][C]0.055761[/C][C]0.3863[/C][C]0.350483[/C][/ROW]
[ROW][C]3[/C][C]0.283691[/C][C]1.9655[/C][C]0.02758[/C][/ROW]
[ROW][C]4[/C][C]-0.263342[/C][C]-1.8245[/C][C]0.037153[/C][/ROW]
[ROW][C]5[/C][C]0.03613[/C][C]0.2503[/C][C]0.401705[/C][/ROW]
[ROW][C]6[/C][C]0.178203[/C][C]1.2346[/C][C]0.11149[/C][/ROW]
[ROW][C]7[/C][C]-0.279043[/C][C]-1.9333[/C][C]0.029557[/C][/ROW]
[ROW][C]8[/C][C]0.250543[/C][C]1.7358[/C][C]0.044507[/C][/ROW]
[ROW][C]9[/C][C]-0.12284[/C][C]-0.8511[/C][C]0.19948[/C][/ROW]
[ROW][C]10[/C][C]-0.071759[/C][C]-0.4972[/C][C]0.310672[/C][/ROW]
[ROW][C]11[/C][C]0.271713[/C][C]1.8825[/C][C]0.03292[/C][/ROW]
[ROW][C]12[/C][C]-0.310174[/C][C]-2.1489[/C][C]0.018355[/C][/ROW]
[ROW][C]13[/C][C]0.125914[/C][C]0.8724[/C][C]0.193678[/C][/ROW]
[ROW][C]14[/C][C]0.057688[/C][C]0.3997[/C][C]0.345586[/C][/ROW]
[ROW][C]15[/C][C]-0.059604[/C][C]-0.4129[/C][C]0.340742[/C][/ROW]
[ROW][C]16[/C][C]-0.079305[/C][C]-0.5494[/C][C]0.292624[/C][/ROW]
[ROW][C]17[/C][C]0.179853[/C][C]1.2461[/C][C]0.109396[/C][/ROW]
[ROW][C]18[/C][C]-0.155853[/C][C]-1.0798[/C][C]0.142818[/C][/ROW]
[ROW][C]19[/C][C]0.049438[/C][C]0.3425[/C][C]0.366728[/C][/ROW]
[ROW][C]20[/C][C]0.064079[/C][C]0.4439[/C][C]0.329537[/C][/ROW]
[ROW][C]21[/C][C]-0.032238[/C][C]-0.2234[/C][C]0.412105[/C][/ROW]
[ROW][C]22[/C][C]-0.146688[/C][C]-1.0163[/C][C]0.157294[/C][/ROW]
[ROW][C]23[/C][C]0.273446[/C][C]1.8945[/C][C]0.032097[/C][/ROW]
[ROW][C]24[/C][C]-0.258136[/C][C]-1.7884[/C][C]0.04001[/C][/ROW]
[ROW][C]25[/C][C]0.117718[/C][C]0.8156[/C][C]0.209386[/C][/ROW]
[ROW][C]26[/C][C]0.040256[/C][C]0.2789[/C][C]0.390759[/C][/ROW]
[ROW][C]27[/C][C]-0.12428[/C][C]-0.861[/C][C]0.19675[/C][/ROW]
[ROW][C]28[/C][C]0.102701[/C][C]0.7115[/C][C]0.2401[/C][/ROW]
[ROW][C]29[/C][C]-0.023409[/C][C]-0.1622[/C][C]0.435921[/C][/ROW]
[ROW][C]30[/C][C]-0.024381[/C][C]-0.1689[/C][C]0.433285[/C][/ROW]
[ROW][C]31[/C][C]0.027963[/C][C]0.1937[/C][C]0.423601[/C][/ROW]
[ROW][C]32[/C][C]-0.016792[/C][C]-0.1163[/C][C]0.453934[/C][/ROW]
[ROW][C]33[/C][C]-0.036867[/C][C]-0.2554[/C][C]0.399745[/C][/ROW]
[ROW][C]34[/C][C]0.127742[/C][C]0.885[/C][C]0.190279[/C][/ROW]
[ROW][C]35[/C][C]-0.18721[/C][C]-1.297[/C][C]0.10041[/C][/ROW]
[ROW][C]36[/C][C]0.14905[/C][C]1.0326[/C][C]0.153472[/C][/ROW]
[/TABLE]
Source: https://freestatistics.org/blog/index.php?pk=60961&T=1

Globally Unique Identifier (entire table): ba.freestatistics.org/blog/index.php?pk=60961&T=1

As an alternative you can also use a QR Code:  

The GUIDs for individual cells are displayed in the table below:

Autocorrelation Function
Time lag kACF(k)T-STATP-value
1-0.653553-4.52792e-05
20.0557610.38630.350483
30.2836911.96550.02758
4-0.263342-1.82450.037153
50.036130.25030.401705
60.1782031.23460.11149
7-0.279043-1.93330.029557
80.2505431.73580.044507
9-0.12284-0.85110.19948
10-0.071759-0.49720.310672
110.2717131.88250.03292
12-0.310174-2.14890.018355
130.1259140.87240.193678
140.0576880.39970.345586
15-0.059604-0.41290.340742
16-0.079305-0.54940.292624
170.1798531.24610.109396
18-0.155853-1.07980.142818
190.0494380.34250.366728
200.0640790.44390.329537
21-0.032238-0.22340.412105
22-0.146688-1.01630.157294
230.2734461.89450.032097
24-0.258136-1.78840.04001
250.1177180.81560.209386
260.0402560.27890.390759
27-0.12428-0.8610.19675
280.1027010.71150.2401
29-0.023409-0.16220.435921
30-0.024381-0.16890.433285
310.0279630.19370.423601
32-0.016792-0.11630.453934
33-0.036867-0.25540.399745
340.1277420.8850.190279
35-0.18721-1.2970.10041
360.149051.03260.153472


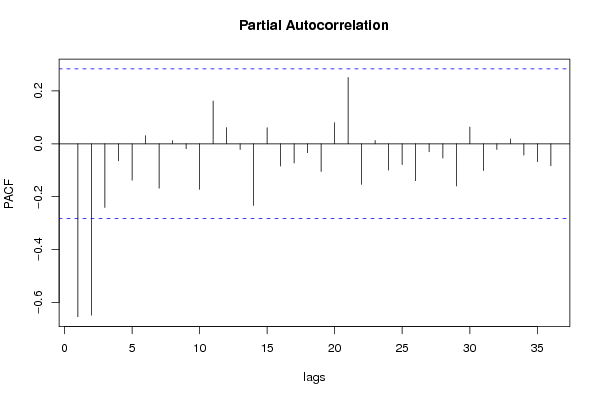
Partial Autocorrelation Function
Time lag kPACF(k)T-STATP-value
1-0.653553-4.52792e-05
2-0.648266-4.49132.2e-05
3-0.24063-1.66710.051
4-0.064402-0.44620.328733
5-0.137776-0.95450.172296
60.0305860.21190.416538
7-0.167962-1.16370.125154
80.0123920.08590.46597
9-0.018758-0.130.44857
10-0.172135-1.19260.119447
110.16141.11820.134521
120.0613810.42530.336274
13-0.021448-0.14860.441246
14-0.233087-1.61490.056446
150.0610530.4230.337097
16-0.084124-0.58280.281369
17-0.072543-0.50260.308774
18-0.033871-0.23470.407733
19-0.104786-0.7260.235688
200.0799020.55360.291219
210.250771.73740.044366
22-0.153836-1.06580.145922
230.0127270.08820.465053
24-0.099484-0.68920.246994
25-0.078591-0.54450.294312
26-0.139751-0.96820.168892
27-0.030479-0.21120.416826
28-0.053889-0.37340.355264
29-0.159491-1.1050.137337
300.0634210.43940.331174
31-0.101175-0.7010.243356
32-0.021328-0.14780.441573
330.0182230.12630.45003
34-0.042776-0.29640.384115
35-0.067526-0.46780.32101
36-0.08343-0.5780.282977

\begin{tabular}{lllllllll}
\hline
Partial Autocorrelation Function \tabularnewline
Time lag k & PACF(k) & T-STAT & P-value \tabularnewline
1 & -0.653553 & -4.5279 & 2e-05 \tabularnewline
2 & -0.648266 & -4.4913 & 2.2e-05 \tabularnewline
3 & -0.24063 & -1.6671 & 0.051 \tabularnewline
4 & -0.064402 & -0.4462 & 0.328733 \tabularnewline
5 & -0.137776 & -0.9545 & 0.172296 \tabularnewline
6 & 0.030586 & 0.2119 & 0.416538 \tabularnewline
7 & -0.167962 & -1.1637 & 0.125154 \tabularnewline
8 & 0.012392 & 0.0859 & 0.46597 \tabularnewline
9 & -0.018758 & -0.13 & 0.44857 \tabularnewline
10 & -0.172135 & -1.1926 & 0.119447 \tabularnewline
11 & 0.1614 & 1.1182 & 0.134521 \tabularnewline
12 & 0.061381 & 0.4253 & 0.336274 \tabularnewline
13 & -0.021448 & -0.1486 & 0.441246 \tabularnewline
14 & -0.233087 & -1.6149 & 0.056446 \tabularnewline
15 & 0.061053 & 0.423 & 0.337097 \tabularnewline
16 & -0.084124 & -0.5828 & 0.281369 \tabularnewline
17 & -0.072543 & -0.5026 & 0.308774 \tabularnewline
18 & -0.033871 & -0.2347 & 0.407733 \tabularnewline
19 & -0.104786 & -0.726 & 0.235688 \tabularnewline
20 & 0.079902 & 0.5536 & 0.291219 \tabularnewline
21 & 0.25077 & 1.7374 & 0.044366 \tabularnewline
22 & -0.153836 & -1.0658 & 0.145922 \tabularnewline
23 & 0.012727 & 0.0882 & 0.465053 \tabularnewline
24 & -0.099484 & -0.6892 & 0.246994 \tabularnewline
25 & -0.078591 & -0.5445 & 0.294312 \tabularnewline
26 & -0.139751 & -0.9682 & 0.168892 \tabularnewline
27 & -0.030479 & -0.2112 & 0.416826 \tabularnewline
28 & -0.053889 & -0.3734 & 0.355264 \tabularnewline
29 & -0.159491 & -1.105 & 0.137337 \tabularnewline
30 & 0.063421 & 0.4394 & 0.331174 \tabularnewline
31 & -0.101175 & -0.701 & 0.243356 \tabularnewline
32 & -0.021328 & -0.1478 & 0.441573 \tabularnewline
33 & 0.018223 & 0.1263 & 0.45003 \tabularnewline
34 & -0.042776 & -0.2964 & 0.384115 \tabularnewline
35 & -0.067526 & -0.4678 & 0.32101 \tabularnewline
36 & -0.08343 & -0.578 & 0.282977 \tabularnewline
\hline
\end{tabular}
%Source: https://freestatistics.org/blog/index.php?pk=60961&T=2

[TABLE]
[ROW][C]Partial Autocorrelation Function[/C][/ROW]
[ROW][C]Time lag k[/C][C]PACF(k)[/C][C]T-STAT[/C][C]P-value[/C][/ROW]
[ROW][C]1[/C][C]-0.653553[/C][C]-4.5279[/C][C]2e-05[/C][/ROW]
[ROW][C]2[/C][C]-0.648266[/C][C]-4.4913[/C][C]2.2e-05[/C][/ROW]
[ROW][C]3[/C][C]-0.24063[/C][C]-1.6671[/C][C]0.051[/C][/ROW]
[ROW][C]4[/C][C]-0.064402[/C][C]-0.4462[/C][C]0.328733[/C][/ROW]
[ROW][C]5[/C][C]-0.137776[/C][C]-0.9545[/C][C]0.172296[/C][/ROW]
[ROW][C]6[/C][C]0.030586[/C][C]0.2119[/C][C]0.416538[/C][/ROW]
[ROW][C]7[/C][C]-0.167962[/C][C]-1.1637[/C][C]0.125154[/C][/ROW]
[ROW][C]8[/C][C]0.012392[/C][C]0.0859[/C][C]0.46597[/C][/ROW]
[ROW][C]9[/C][C]-0.018758[/C][C]-0.13[/C][C]0.44857[/C][/ROW]
[ROW][C]10[/C][C]-0.172135[/C][C]-1.1926[/C][C]0.119447[/C][/ROW]
[ROW][C]11[/C][C]0.1614[/C][C]1.1182[/C][C]0.134521[/C][/ROW]
[ROW][C]12[/C][C]0.061381[/C][C]0.4253[/C][C]0.336274[/C][/ROW]
[ROW][C]13[/C][C]-0.021448[/C][C]-0.1486[/C][C]0.441246[/C][/ROW]
[ROW][C]14[/C][C]-0.233087[/C][C]-1.6149[/C][C]0.056446[/C][/ROW]
[ROW][C]15[/C][C]0.061053[/C][C]0.423[/C][C]0.337097[/C][/ROW]
[ROW][C]16[/C][C]-0.084124[/C][C]-0.5828[/C][C]0.281369[/C][/ROW]
[ROW][C]17[/C][C]-0.072543[/C][C]-0.5026[/C][C]0.308774[/C][/ROW]
[ROW][C]18[/C][C]-0.033871[/C][C]-0.2347[/C][C]0.407733[/C][/ROW]
[ROW][C]19[/C][C]-0.104786[/C][C]-0.726[/C][C]0.235688[/C][/ROW]
[ROW][C]20[/C][C]0.079902[/C][C]0.5536[/C][C]0.291219[/C][/ROW]
[ROW][C]21[/C][C]0.25077[/C][C]1.7374[/C][C]0.044366[/C][/ROW]
[ROW][C]22[/C][C]-0.153836[/C][C]-1.0658[/C][C]0.145922[/C][/ROW]
[ROW][C]23[/C][C]0.012727[/C][C]0.0882[/C][C]0.465053[/C][/ROW]
[ROW][C]24[/C][C]-0.099484[/C][C]-0.6892[/C][C]0.246994[/C][/ROW]
[ROW][C]25[/C][C]-0.078591[/C][C]-0.5445[/C][C]0.294312[/C][/ROW]
[ROW][C]26[/C][C]-0.139751[/C][C]-0.9682[/C][C]0.168892[/C][/ROW]
[ROW][C]27[/C][C]-0.030479[/C][C]-0.2112[/C][C]0.416826[/C][/ROW]
[ROW][C]28[/C][C]-0.053889[/C][C]-0.3734[/C][C]0.355264[/C][/ROW]
[ROW][C]29[/C][C]-0.159491[/C][C]-1.105[/C][C]0.137337[/C][/ROW]
[ROW][C]30[/C][C]0.063421[/C][C]0.4394[/C][C]0.331174[/C][/ROW]
[ROW][C]31[/C][C]-0.101175[/C][C]-0.701[/C][C]0.243356[/C][/ROW]
[ROW][C]32[/C][C]-0.021328[/C][C]-0.1478[/C][C]0.441573[/C][/ROW]
[ROW][C]33[/C][C]0.018223[/C][C]0.1263[/C][C]0.45003[/C][/ROW]
[ROW][C]34[/C][C]-0.042776[/C][C]-0.2964[/C][C]0.384115[/C][/ROW]
[ROW][C]35[/C][C]-0.067526[/C][C]-0.4678[/C][C]0.32101[/C][/ROW]
[ROW][C]36[/C][C]-0.08343[/C][C]-0.578[/C][C]0.282977[/C][/ROW]
[/TABLE]
Source: https://freestatistics.org/blog/index.php?pk=60961&T=2

Globally Unique Identifier (entire table): ba.freestatistics.org/blog/index.php?pk=60961&T=2

As an alternative you can also use a QR Code:  

The GUIDs for individual cells are displayed in the table below:

Partial Autocorrelation Function
Time lag kPACF(k)T-STATP-value
1-0.653553-4.52792e-05
2-0.648266-4.49132.2e-05
3-0.24063-1.66710.051
4-0.064402-0.44620.328733
5-0.137776-0.95450.172296
60.0305860.21190.416538
7-0.167962-1.16370.125154
80.0123920.08590.46597
9-0.018758-0.130.44857
10-0.172135-1.19260.119447
110.16141.11820.134521
120.0613810.42530.336274
13-0.021448-0.14860.441246
14-0.233087-1.61490.056446
150.0610530.4230.337097
16-0.084124-0.58280.281369
17-0.072543-0.50260.308774
18-0.033871-0.23470.407733
19-0.104786-0.7260.235688
200.0799020.55360.291219
210.250771.73740.044366
22-0.153836-1.06580.145922
230.0127270.08820.465053
24-0.099484-0.68920.246994
25-0.078591-0.54450.294312
26-0.139751-0.96820.168892
27-0.030479-0.21120.416826
28-0.053889-0.37340.355264
29-0.159491-1.1050.137337
300.0634210.43940.331174
31-0.101175-0.7010.243356
32-0.021328-0.14780.441573
330.0182230.12630.45003
34-0.042776-0.29640.384115
35-0.067526-0.46780.32101
36-0.08343-0.5780.282977


Parameters (Session):
par1 = 36 ; par2 = 1 ; par3 = 1 ; par4 = 1 ; par5 = 12 ; par6 = MA ; par7 = 0.95 ;
Parameters (R input):
par1 = 36 ; par2 = 1 ; par3 = 1 ; par4 = 1 ; par5 = 12 ; par6 = MA ; par7 = 0.95 ;
R code (references can be found in the software module):
if (par1 == 'Default') {
par1 = 10*log10(length(x))
} else {
par1 <- as.numeric(par1)
}
par2 <- as.numeric(par2)
par3 <- as.numeric(par3)
par4 <- as.numeric(par4)
par5 <- as.numeric(par5)
if (par6 == 'White Noise') par6 <- 'white' else par6 <- 'ma'
par7 <- as.numeric(par7)
if (par2 == 0) {
x <- log(x)
} else {
x <- (x ^ par2 - 1) / par2
}
if (par3 > 0) x <- diff(x,lag=1,difference=par3)
if (par4 > 0) x <- diff(x,lag=par5,difference=par4)
bitmap(file='pic1.png')
racf <- acf(x, par1, main='Autocorrelation', xlab='time lag', ylab='ACF', ci.type=par6, ci=par7, sub=paste('(lambda=',par2,', d=',par3,', D=',par4,', CI=', par7, ', CI type=',par6,')',sep=''))
dev.off()
bitmap(file='pic2.png')
rpacf <- pacf(x,par1,main='Partial Autocorrelation',xlab='lags',ylab='PACF')
dev.off()
(myacf <- c(racf$acf))
(mypacf <- c(rpacf$acf))
lengthx <- length(x)
sqrtn <- sqrt(lengthx)
load(file='createtable')
a<-table.start()
a<-table.row.start(a)
a<-table.element(a,'Autocorrelation Function',4,TRUE)
a<-table.row.end(a)
a<-table.row.start(a)
a<-table.element(a,'Time lag k',header=TRUE)
a<-table.element(a,hyperlink('basics.htm','ACF(k)','click here for more information about the Autocorrelation Function'),header=TRUE)
a<-table.element(a,'T-STAT',header=TRUE)
a<-table.element(a,'P-value',header=TRUE)
a<-table.row.end(a)
for (i in 2:(par1+1)) {
a<-table.row.start(a)
a<-table.element(a,i-1,header=TRUE)
a<-table.element(a,round(myacf[i],6))
mytstat <- myacf[i]*sqrtn
a<-table.element(a,round(mytstat,4))
a<-table.element(a,round(1-pt(abs(mytstat),lengthx),6))
a<-table.row.end(a)
}
a<-table.end(a)
table.save(a,file='mytable.tab')
a<-table.start()
a<-table.row.start(a)
a<-table.element(a,'Partial Autocorrelation Function',4,TRUE)
a<-table.row.end(a)
a<-table.row.start(a)
a<-table.element(a,'Time lag k',header=TRUE)
a<-table.element(a,hyperlink('basics.htm','PACF(k)','click here for more information about the Partial Autocorrelation Function'),header=TRUE)
a<-table.element(a,'T-STAT',header=TRUE)
a<-table.element(a,'P-value',header=TRUE)
a<-table.row.end(a)
for (i in 1:par1) {
a<-table.row.start(a)
a<-table.element(a,i,header=TRUE)
a<-table.element(a,round(mypacf[i],6))
mytstat <- mypacf[i]*sqrtn
a<-table.element(a,round(mytstat,4))
a<-table.element(a,round(1-pt(abs(mytstat),lengthx),6))
a<-table.row.end(a)
}
a<-table.end(a)
table.save(a,file='mytable1.tab')