Free Statistics

of Irreproducible Research!

Author's title

Author*The author of this computation has been verified*
R Software Modulerwasp_autocorrelation.wasp
Title produced by software(Partial) Autocorrelation Function
Date of computationFri, 27 Nov 2009 09:26:17 -0700
Cite this page as followsStatistical Computations at FreeStatistics.org, Office for Research Development and Education, URL https://freestatistics.org/blog/index.php?v=date/2009/Nov/27/t1259339236jzrkqwweuzjtkbu.htm/, Retrieved Mon, 29 Apr 2024 21:38:33 +0000
Statistical Computations at FreeStatistics.org, Office for Research Development and Education, URL https://freestatistics.org/blog/index.php?pk=60959, Retrieved Mon, 29 Apr 2024 21:38:33 +0000
QR Codes:

Original text written by user:
IsPrivate?No (this computation is public)
User-defined keywords
Estimated Impact135
Family? (F = Feedback message, R = changed R code, M = changed R Module, P = changed Parameters, D = changed Data)
-       [(Partial) Autocorrelation Function] [] [2009-11-27 16:26:17] [477c9cb8e7bda18f2375c22a66069c90] [Current]
Feedback Forum

Post a new message
Dataseries X:
92.9
107.7
103.5
91.1
79.8
71.9
82.9
90.1
100.7
90.7
108.8
44.1
93.6
107.4
96.5
93.6
76.5
76.7
84
103.3
88.5
99
105.9
44.7
94
107.1
104.8
102.5
77.7
85.2
91.3
106.5
92.4
97.5
107
51.1
98.6
102.2
114.3
99.4
72.5
92.3
99.4
85.9
109.4
97.6
104.7
56.9
86.7
108.5
103.4
86.2
71
75.9
87.1
102
88.5
87.8
100.8
50.6
85.9


Summary of computational transaction
Raw Inputview raw input (R code)
Raw Outputview raw output of R engine
Computing time1 seconds
R Server'Gwilym Jenkins' @ 72.249.127.135

\begin{tabular}{lllllllll}
\hline
Summary of computational transaction \tabularnewline
Raw Input & view raw input (R code)  \tabularnewline
Raw Output & view raw output of R engine  \tabularnewline
Computing time & 1 seconds \tabularnewline
R Server & 'Gwilym Jenkins' @ 72.249.127.135 \tabularnewline
\hline
\end{tabular}
%Source: https://freestatistics.org/blog/index.php?pk=60959&T=0

[TABLE]
[ROW][C]Summary of computational transaction[/C][/ROW]
[ROW][C]Raw Input[/C][C]view raw input (R code) [/C][/ROW]
[ROW][C]Raw Output[/C][C]view raw output of R engine [/C][/ROW]
[ROW][C]Computing time[/C][C]1 seconds[/C][/ROW]
[ROW][C]R Server[/C][C]'Gwilym Jenkins' @ 72.249.127.135[/C][/ROW]
[/TABLE]
Source: https://freestatistics.org/blog/index.php?pk=60959&T=0

Globally Unique Identifier (entire table): ba.freestatistics.org/blog/index.php?pk=60959&T=0

As an alternative you can also use a QR Code:  

The GUIDs for individual cells are displayed in the table below:

Summary of computational transaction
Raw Inputview raw input (R code)
Raw Outputview raw output of R engine
Computing time1 seconds
R Server'Gwilym Jenkins' @ 72.249.127.135


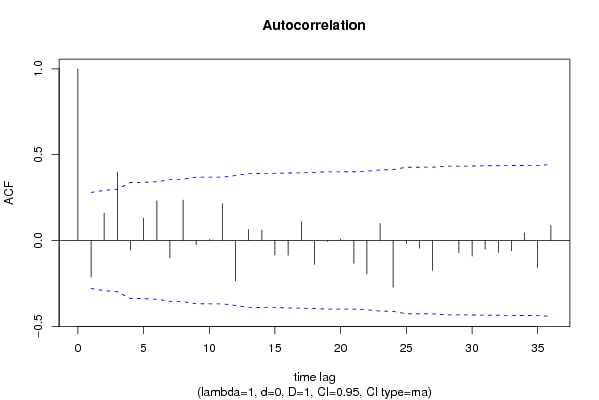
Autocorrelation Function
Time lag kACF(k)T-STATP-value
1-0.212844-1.48990.071329
20.1589171.11240.135694
30.3976942.78390.003806
4-0.055156-0.38610.35055
50.130770.91540.182235
60.2315831.62110.055709
7-0.102498-0.71750.238241
80.2359361.65160.05251
9-0.023994-0.1680.433653
100.0064370.04510.482121
110.2143421.50040.069965
12-0.235498-1.64850.052826
130.064550.45180.326686
140.0617330.43210.333771
15-0.084593-0.59220.278236
16-0.086306-0.60410.274268
170.1088270.76180.224919
18-0.139406-0.97580.166967
19-0.005625-0.03940.484377
200.009330.06530.474097
21-0.132987-0.93090.178232
22-0.195319-1.36720.088896
230.0990510.69340.245681
24-0.273241-1.91270.030821
25-0.017743-0.12420.450831
26-0.044705-0.31290.377829
27-0.174187-1.21930.114282
280.0010340.00720.497126
29-0.071461-0.50020.309578
30-0.090838-0.63590.263912
31-0.050859-0.3560.36168
32-0.070075-0.49050.312976
33-0.060425-0.4230.337083
340.0445380.31180.37827
35-0.159619-1.11730.13465
360.0867820.60750.273171

\begin{tabular}{lllllllll}
\hline
Autocorrelation Function \tabularnewline
Time lag k & ACF(k) & T-STAT & P-value \tabularnewline
1 & -0.212844 & -1.4899 & 0.071329 \tabularnewline
2 & 0.158917 & 1.1124 & 0.135694 \tabularnewline
3 & 0.397694 & 2.7839 & 0.003806 \tabularnewline
4 & -0.055156 & -0.3861 & 0.35055 \tabularnewline
5 & 0.13077 & 0.9154 & 0.182235 \tabularnewline
6 & 0.231583 & 1.6211 & 0.055709 \tabularnewline
7 & -0.102498 & -0.7175 & 0.238241 \tabularnewline
8 & 0.235936 & 1.6516 & 0.05251 \tabularnewline
9 & -0.023994 & -0.168 & 0.433653 \tabularnewline
10 & 0.006437 & 0.0451 & 0.482121 \tabularnewline
11 & 0.214342 & 1.5004 & 0.069965 \tabularnewline
12 & -0.235498 & -1.6485 & 0.052826 \tabularnewline
13 & 0.06455 & 0.4518 & 0.326686 \tabularnewline
14 & 0.061733 & 0.4321 & 0.333771 \tabularnewline
15 & -0.084593 & -0.5922 & 0.278236 \tabularnewline
16 & -0.086306 & -0.6041 & 0.274268 \tabularnewline
17 & 0.108827 & 0.7618 & 0.224919 \tabularnewline
18 & -0.139406 & -0.9758 & 0.166967 \tabularnewline
19 & -0.005625 & -0.0394 & 0.484377 \tabularnewline
20 & 0.00933 & 0.0653 & 0.474097 \tabularnewline
21 & -0.132987 & -0.9309 & 0.178232 \tabularnewline
22 & -0.195319 & -1.3672 & 0.088896 \tabularnewline
23 & 0.099051 & 0.6934 & 0.245681 \tabularnewline
24 & -0.273241 & -1.9127 & 0.030821 \tabularnewline
25 & -0.017743 & -0.1242 & 0.450831 \tabularnewline
26 & -0.044705 & -0.3129 & 0.377829 \tabularnewline
27 & -0.174187 & -1.2193 & 0.114282 \tabularnewline
28 & 0.001034 & 0.0072 & 0.497126 \tabularnewline
29 & -0.071461 & -0.5002 & 0.309578 \tabularnewline
30 & -0.090838 & -0.6359 & 0.263912 \tabularnewline
31 & -0.050859 & -0.356 & 0.36168 \tabularnewline
32 & -0.070075 & -0.4905 & 0.312976 \tabularnewline
33 & -0.060425 & -0.423 & 0.337083 \tabularnewline
34 & 0.044538 & 0.3118 & 0.37827 \tabularnewline
35 & -0.159619 & -1.1173 & 0.13465 \tabularnewline
36 & 0.086782 & 0.6075 & 0.273171 \tabularnewline
\hline
\end{tabular}
%Source: https://freestatistics.org/blog/index.php?pk=60959&T=1

[TABLE]
[ROW][C]Autocorrelation Function[/C][/ROW]
[ROW][C]Time lag k[/C][C]ACF(k)[/C][C]T-STAT[/C][C]P-value[/C][/ROW]
[ROW][C]1[/C][C]-0.212844[/C][C]-1.4899[/C][C]0.071329[/C][/ROW]
[ROW][C]2[/C][C]0.158917[/C][C]1.1124[/C][C]0.135694[/C][/ROW]
[ROW][C]3[/C][C]0.397694[/C][C]2.7839[/C][C]0.003806[/C][/ROW]
[ROW][C]4[/C][C]-0.055156[/C][C]-0.3861[/C][C]0.35055[/C][/ROW]
[ROW][C]5[/C][C]0.13077[/C][C]0.9154[/C][C]0.182235[/C][/ROW]
[ROW][C]6[/C][C]0.231583[/C][C]1.6211[/C][C]0.055709[/C][/ROW]
[ROW][C]7[/C][C]-0.102498[/C][C]-0.7175[/C][C]0.238241[/C][/ROW]
[ROW][C]8[/C][C]0.235936[/C][C]1.6516[/C][C]0.05251[/C][/ROW]
[ROW][C]9[/C][C]-0.023994[/C][C]-0.168[/C][C]0.433653[/C][/ROW]
[ROW][C]10[/C][C]0.006437[/C][C]0.0451[/C][C]0.482121[/C][/ROW]
[ROW][C]11[/C][C]0.214342[/C][C]1.5004[/C][C]0.069965[/C][/ROW]
[ROW][C]12[/C][C]-0.235498[/C][C]-1.6485[/C][C]0.052826[/C][/ROW]
[ROW][C]13[/C][C]0.06455[/C][C]0.4518[/C][C]0.326686[/C][/ROW]
[ROW][C]14[/C][C]0.061733[/C][C]0.4321[/C][C]0.333771[/C][/ROW]
[ROW][C]15[/C][C]-0.084593[/C][C]-0.5922[/C][C]0.278236[/C][/ROW]
[ROW][C]16[/C][C]-0.086306[/C][C]-0.6041[/C][C]0.274268[/C][/ROW]
[ROW][C]17[/C][C]0.108827[/C][C]0.7618[/C][C]0.224919[/C][/ROW]
[ROW][C]18[/C][C]-0.139406[/C][C]-0.9758[/C][C]0.166967[/C][/ROW]
[ROW][C]19[/C][C]-0.005625[/C][C]-0.0394[/C][C]0.484377[/C][/ROW]
[ROW][C]20[/C][C]0.00933[/C][C]0.0653[/C][C]0.474097[/C][/ROW]
[ROW][C]21[/C][C]-0.132987[/C][C]-0.9309[/C][C]0.178232[/C][/ROW]
[ROW][C]22[/C][C]-0.195319[/C][C]-1.3672[/C][C]0.088896[/C][/ROW]
[ROW][C]23[/C][C]0.099051[/C][C]0.6934[/C][C]0.245681[/C][/ROW]
[ROW][C]24[/C][C]-0.273241[/C][C]-1.9127[/C][C]0.030821[/C][/ROW]
[ROW][C]25[/C][C]-0.017743[/C][C]-0.1242[/C][C]0.450831[/C][/ROW]
[ROW][C]26[/C][C]-0.044705[/C][C]-0.3129[/C][C]0.377829[/C][/ROW]
[ROW][C]27[/C][C]-0.174187[/C][C]-1.2193[/C][C]0.114282[/C][/ROW]
[ROW][C]28[/C][C]0.001034[/C][C]0.0072[/C][C]0.497126[/C][/ROW]
[ROW][C]29[/C][C]-0.071461[/C][C]-0.5002[/C][C]0.309578[/C][/ROW]
[ROW][C]30[/C][C]-0.090838[/C][C]-0.6359[/C][C]0.263912[/C][/ROW]
[ROW][C]31[/C][C]-0.050859[/C][C]-0.356[/C][C]0.36168[/C][/ROW]
[ROW][C]32[/C][C]-0.070075[/C][C]-0.4905[/C][C]0.312976[/C][/ROW]
[ROW][C]33[/C][C]-0.060425[/C][C]-0.423[/C][C]0.337083[/C][/ROW]
[ROW][C]34[/C][C]0.044538[/C][C]0.3118[/C][C]0.37827[/C][/ROW]
[ROW][C]35[/C][C]-0.159619[/C][C]-1.1173[/C][C]0.13465[/C][/ROW]
[ROW][C]36[/C][C]0.086782[/C][C]0.6075[/C][C]0.273171[/C][/ROW]
[/TABLE]
Source: https://freestatistics.org/blog/index.php?pk=60959&T=1

Globally Unique Identifier (entire table): ba.freestatistics.org/blog/index.php?pk=60959&T=1

As an alternative you can also use a QR Code:  

The GUIDs for individual cells are displayed in the table below:

Autocorrelation Function
Time lag kACF(k)T-STATP-value
1-0.212844-1.48990.071329
20.1589171.11240.135694
30.3976942.78390.003806
4-0.055156-0.38610.35055
50.130770.91540.182235
60.2315831.62110.055709
7-0.102498-0.71750.238241
80.2359361.65160.05251
9-0.023994-0.1680.433653
100.0064370.04510.482121
110.2143421.50040.069965
12-0.235498-1.64850.052826
130.064550.45180.326686
140.0617330.43210.333771
15-0.084593-0.59220.278236
16-0.086306-0.60410.274268
170.1088270.76180.224919
18-0.139406-0.97580.166967
19-0.005625-0.03940.484377
200.009330.06530.474097
21-0.132987-0.93090.178232
22-0.195319-1.36720.088896
230.0990510.69340.245681
24-0.273241-1.91270.030821
25-0.017743-0.12420.450831
26-0.044705-0.31290.377829
27-0.174187-1.21930.114282
280.0010340.00720.497126
29-0.071461-0.50020.309578
30-0.090838-0.63590.263912
31-0.050859-0.3560.36168
32-0.070075-0.49050.312976
33-0.060425-0.4230.337083
340.0445380.31180.37827
35-0.159619-1.11730.13465
360.0867820.60750.273171


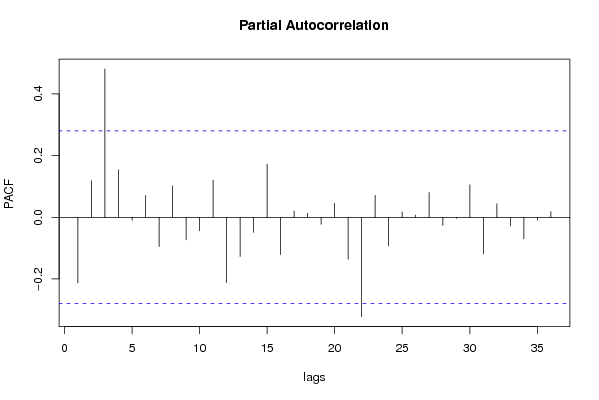
Partial Autocorrelation Function
Time lag kPACF(k)T-STATP-value
1-0.212844-1.48990.071329
20.1190050.8330.204433
30.4811253.36790.000741
40.1539361.07750.143256
5-0.009765-0.06840.47289
60.0709020.49630.310947
7-0.094921-0.66440.25476
80.1022010.71540.238876
9-0.073231-0.51260.30526
10-0.043552-0.30490.380881
110.1207490.84520.201041
12-0.212382-1.48670.071754
13-0.127209-0.89050.188785
14-0.049359-0.34550.365595
150.1724171.20690.116628
16-0.121083-0.84760.200397
170.0202040.14140.444056
180.0133060.09310.463085
19-0.022698-0.15890.437206
200.0451730.31620.376592
21-0.136473-0.95530.172056
22-0.322377-2.25660.014263
230.071410.49990.309701
24-0.092804-0.64960.259484
250.0167930.11760.453452
260.0071870.05030.48004
270.0801970.56140.288548
28-0.025946-0.18160.428315
29-0.003397-0.02380.490564
300.1053290.73730.232227
31-0.119456-0.83620.203554
320.0437830.30650.380268
33-0.028642-0.20050.420962
34-0.069816-0.48870.313612
35-0.009807-0.06870.472773
360.0181880.12730.449605

\begin{tabular}{lllllllll}
\hline
Partial Autocorrelation Function \tabularnewline
Time lag k & PACF(k) & T-STAT & P-value \tabularnewline
1 & -0.212844 & -1.4899 & 0.071329 \tabularnewline
2 & 0.119005 & 0.833 & 0.204433 \tabularnewline
3 & 0.481125 & 3.3679 & 0.000741 \tabularnewline
4 & 0.153936 & 1.0775 & 0.143256 \tabularnewline
5 & -0.009765 & -0.0684 & 0.47289 \tabularnewline
6 & 0.070902 & 0.4963 & 0.310947 \tabularnewline
7 & -0.094921 & -0.6644 & 0.25476 \tabularnewline
8 & 0.102201 & 0.7154 & 0.238876 \tabularnewline
9 & -0.073231 & -0.5126 & 0.30526 \tabularnewline
10 & -0.043552 & -0.3049 & 0.380881 \tabularnewline
11 & 0.120749 & 0.8452 & 0.201041 \tabularnewline
12 & -0.212382 & -1.4867 & 0.071754 \tabularnewline
13 & -0.127209 & -0.8905 & 0.188785 \tabularnewline
14 & -0.049359 & -0.3455 & 0.365595 \tabularnewline
15 & 0.172417 & 1.2069 & 0.116628 \tabularnewline
16 & -0.121083 & -0.8476 & 0.200397 \tabularnewline
17 & 0.020204 & 0.1414 & 0.444056 \tabularnewline
18 & 0.013306 & 0.0931 & 0.463085 \tabularnewline
19 & -0.022698 & -0.1589 & 0.437206 \tabularnewline
20 & 0.045173 & 0.3162 & 0.376592 \tabularnewline
21 & -0.136473 & -0.9553 & 0.172056 \tabularnewline
22 & -0.322377 & -2.2566 & 0.014263 \tabularnewline
23 & 0.07141 & 0.4999 & 0.309701 \tabularnewline
24 & -0.092804 & -0.6496 & 0.259484 \tabularnewline
25 & 0.016793 & 0.1176 & 0.453452 \tabularnewline
26 & 0.007187 & 0.0503 & 0.48004 \tabularnewline
27 & 0.080197 & 0.5614 & 0.288548 \tabularnewline
28 & -0.025946 & -0.1816 & 0.428315 \tabularnewline
29 & -0.003397 & -0.0238 & 0.490564 \tabularnewline
30 & 0.105329 & 0.7373 & 0.232227 \tabularnewline
31 & -0.119456 & -0.8362 & 0.203554 \tabularnewline
32 & 0.043783 & 0.3065 & 0.380268 \tabularnewline
33 & -0.028642 & -0.2005 & 0.420962 \tabularnewline
34 & -0.069816 & -0.4887 & 0.313612 \tabularnewline
35 & -0.009807 & -0.0687 & 0.472773 \tabularnewline
36 & 0.018188 & 0.1273 & 0.449605 \tabularnewline
\hline
\end{tabular}
%Source: https://freestatistics.org/blog/index.php?pk=60959&T=2

[TABLE]
[ROW][C]Partial Autocorrelation Function[/C][/ROW]
[ROW][C]Time lag k[/C][C]PACF(k)[/C][C]T-STAT[/C][C]P-value[/C][/ROW]
[ROW][C]1[/C][C]-0.212844[/C][C]-1.4899[/C][C]0.071329[/C][/ROW]
[ROW][C]2[/C][C]0.119005[/C][C]0.833[/C][C]0.204433[/C][/ROW]
[ROW][C]3[/C][C]0.481125[/C][C]3.3679[/C][C]0.000741[/C][/ROW]
[ROW][C]4[/C][C]0.153936[/C][C]1.0775[/C][C]0.143256[/C][/ROW]
[ROW][C]5[/C][C]-0.009765[/C][C]-0.0684[/C][C]0.47289[/C][/ROW]
[ROW][C]6[/C][C]0.070902[/C][C]0.4963[/C][C]0.310947[/C][/ROW]
[ROW][C]7[/C][C]-0.094921[/C][C]-0.6644[/C][C]0.25476[/C][/ROW]
[ROW][C]8[/C][C]0.102201[/C][C]0.7154[/C][C]0.238876[/C][/ROW]
[ROW][C]9[/C][C]-0.073231[/C][C]-0.5126[/C][C]0.30526[/C][/ROW]
[ROW][C]10[/C][C]-0.043552[/C][C]-0.3049[/C][C]0.380881[/C][/ROW]
[ROW][C]11[/C][C]0.120749[/C][C]0.8452[/C][C]0.201041[/C][/ROW]
[ROW][C]12[/C][C]-0.212382[/C][C]-1.4867[/C][C]0.071754[/C][/ROW]
[ROW][C]13[/C][C]-0.127209[/C][C]-0.8905[/C][C]0.188785[/C][/ROW]
[ROW][C]14[/C][C]-0.049359[/C][C]-0.3455[/C][C]0.365595[/C][/ROW]
[ROW][C]15[/C][C]0.172417[/C][C]1.2069[/C][C]0.116628[/C][/ROW]
[ROW][C]16[/C][C]-0.121083[/C][C]-0.8476[/C][C]0.200397[/C][/ROW]
[ROW][C]17[/C][C]0.020204[/C][C]0.1414[/C][C]0.444056[/C][/ROW]
[ROW][C]18[/C][C]0.013306[/C][C]0.0931[/C][C]0.463085[/C][/ROW]
[ROW][C]19[/C][C]-0.022698[/C][C]-0.1589[/C][C]0.437206[/C][/ROW]
[ROW][C]20[/C][C]0.045173[/C][C]0.3162[/C][C]0.376592[/C][/ROW]
[ROW][C]21[/C][C]-0.136473[/C][C]-0.9553[/C][C]0.172056[/C][/ROW]
[ROW][C]22[/C][C]-0.322377[/C][C]-2.2566[/C][C]0.014263[/C][/ROW]
[ROW][C]23[/C][C]0.07141[/C][C]0.4999[/C][C]0.309701[/C][/ROW]
[ROW][C]24[/C][C]-0.092804[/C][C]-0.6496[/C][C]0.259484[/C][/ROW]
[ROW][C]25[/C][C]0.016793[/C][C]0.1176[/C][C]0.453452[/C][/ROW]
[ROW][C]26[/C][C]0.007187[/C][C]0.0503[/C][C]0.48004[/C][/ROW]
[ROW][C]27[/C][C]0.080197[/C][C]0.5614[/C][C]0.288548[/C][/ROW]
[ROW][C]28[/C][C]-0.025946[/C][C]-0.1816[/C][C]0.428315[/C][/ROW]
[ROW][C]29[/C][C]-0.003397[/C][C]-0.0238[/C][C]0.490564[/C][/ROW]
[ROW][C]30[/C][C]0.105329[/C][C]0.7373[/C][C]0.232227[/C][/ROW]
[ROW][C]31[/C][C]-0.119456[/C][C]-0.8362[/C][C]0.203554[/C][/ROW]
[ROW][C]32[/C][C]0.043783[/C][C]0.3065[/C][C]0.380268[/C][/ROW]
[ROW][C]33[/C][C]-0.028642[/C][C]-0.2005[/C][C]0.420962[/C][/ROW]
[ROW][C]34[/C][C]-0.069816[/C][C]-0.4887[/C][C]0.313612[/C][/ROW]
[ROW][C]35[/C][C]-0.009807[/C][C]-0.0687[/C][C]0.472773[/C][/ROW]
[ROW][C]36[/C][C]0.018188[/C][C]0.1273[/C][C]0.449605[/C][/ROW]
[/TABLE]
Source: https://freestatistics.org/blog/index.php?pk=60959&T=2

Globally Unique Identifier (entire table): ba.freestatistics.org/blog/index.php?pk=60959&T=2

As an alternative you can also use a QR Code:  

The GUIDs for individual cells are displayed in the table below:

Partial Autocorrelation Function
Time lag kPACF(k)T-STATP-value
1-0.212844-1.48990.071329
20.1190050.8330.204433
30.4811253.36790.000741
40.1539361.07750.143256
5-0.009765-0.06840.47289
60.0709020.49630.310947
7-0.094921-0.66440.25476
80.1022010.71540.238876
9-0.073231-0.51260.30526
10-0.043552-0.30490.380881
110.1207490.84520.201041
12-0.212382-1.48670.071754
13-0.127209-0.89050.188785
14-0.049359-0.34550.365595
150.1724171.20690.116628
16-0.121083-0.84760.200397
170.0202040.14140.444056
180.0133060.09310.463085
19-0.022698-0.15890.437206
200.0451730.31620.376592
21-0.136473-0.95530.172056
22-0.322377-2.25660.014263
230.071410.49990.309701
24-0.092804-0.64960.259484
250.0167930.11760.453452
260.0071870.05030.48004
270.0801970.56140.288548
28-0.025946-0.18160.428315
29-0.003397-0.02380.490564
300.1053290.73730.232227
31-0.119456-0.83620.203554
320.0437830.30650.380268
33-0.028642-0.20050.420962
34-0.069816-0.48870.313612
35-0.009807-0.06870.472773
360.0181880.12730.449605


Parameters (Session):
par1 = 36 ; par2 = 1 ; par3 = 0 ; par4 = 1 ; par5 = 12 ; par6 = MA ; par7 = 0.95 ;
Parameters (R input):
par1 = 36 ; par2 = 1 ; par3 = 0 ; par4 = 1 ; par5 = 12 ; par6 = MA ; par7 = 0.95 ;
R code (references can be found in the software module):
if (par1 == 'Default') {
par1 = 10*log10(length(x))
} else {
par1 <- as.numeric(par1)
}
par2 <- as.numeric(par2)
par3 <- as.numeric(par3)
par4 <- as.numeric(par4)
par5 <- as.numeric(par5)
if (par6 == 'White Noise') par6 <- 'white' else par6 <- 'ma'
par7 <- as.numeric(par7)
if (par2 == 0) {
x <- log(x)
} else {
x <- (x ^ par2 - 1) / par2
}
if (par3 > 0) x <- diff(x,lag=1,difference=par3)
if (par4 > 0) x <- diff(x,lag=par5,difference=par4)
bitmap(file='pic1.png')
racf <- acf(x, par1, main='Autocorrelation', xlab='time lag', ylab='ACF', ci.type=par6, ci=par7, sub=paste('(lambda=',par2,', d=',par3,', D=',par4,', CI=', par7, ', CI type=',par6,')',sep=''))
dev.off()
bitmap(file='pic2.png')
rpacf <- pacf(x,par1,main='Partial Autocorrelation',xlab='lags',ylab='PACF')
dev.off()
(myacf <- c(racf$acf))
(mypacf <- c(rpacf$acf))
lengthx <- length(x)
sqrtn <- sqrt(lengthx)
load(file='createtable')
a<-table.start()
a<-table.row.start(a)
a<-table.element(a,'Autocorrelation Function',4,TRUE)
a<-table.row.end(a)
a<-table.row.start(a)
a<-table.element(a,'Time lag k',header=TRUE)
a<-table.element(a,hyperlink('basics.htm','ACF(k)','click here for more information about the Autocorrelation Function'),header=TRUE)
a<-table.element(a,'T-STAT',header=TRUE)
a<-table.element(a,'P-value',header=TRUE)
a<-table.row.end(a)
for (i in 2:(par1+1)) {
a<-table.row.start(a)
a<-table.element(a,i-1,header=TRUE)
a<-table.element(a,round(myacf[i],6))
mytstat <- myacf[i]*sqrtn
a<-table.element(a,round(mytstat,4))
a<-table.element(a,round(1-pt(abs(mytstat),lengthx),6))
a<-table.row.end(a)
}
a<-table.end(a)
table.save(a,file='mytable.tab')
a<-table.start()
a<-table.row.start(a)
a<-table.element(a,'Partial Autocorrelation Function',4,TRUE)
a<-table.row.end(a)
a<-table.row.start(a)
a<-table.element(a,'Time lag k',header=TRUE)
a<-table.element(a,hyperlink('basics.htm','PACF(k)','click here for more information about the Partial Autocorrelation Function'),header=TRUE)
a<-table.element(a,'T-STAT',header=TRUE)
a<-table.element(a,'P-value',header=TRUE)
a<-table.row.end(a)
for (i in 1:par1) {
a<-table.row.start(a)
a<-table.element(a,i,header=TRUE)
a<-table.element(a,round(mypacf[i],6))
mytstat <- mypacf[i]*sqrtn
a<-table.element(a,round(mytstat,4))
a<-table.element(a,round(1-pt(abs(mytstat),lengthx),6))
a<-table.row.end(a)
}
a<-table.end(a)
table.save(a,file='mytable1.tab')