| Multiple Linear Regression - Estimated Regression Equation |
| Y[t] = -0.882021848595453 -0.00452130769895071X[t] + 1.28776785397041Y1[t] -0.416249054274984Y2[t] -0.111638282342769Y3[t] + 0.271637226912727Y4[t] -0.0188616710391742Y5[t] + 0.0035299223429012t + e[t] |
| Multiple Linear Regression - Ordinary Least Squares | |||||
| Variable | Parameter | S.D. | T-STAT H0: parameter = 0 | 2-tail p-value | 1-tail p-value |
| (Intercept) | -0.882021848595453 | 4.04946 | -0.2178 | 0.828518 | 0.414259 |
| X | -0.00452130769895071 | 0.001859 | -2.4321 | 0.018876 | 0.009438 |
| Y1 | 1.28776785397041 | 0.138486 | 9.2989 | 0 | 0 |
| Y2 | -0.416249054274984 | 0.229841 | -1.811 | 0.07653 | 0.038265 |
| Y3 | -0.111638282342769 | 0.243676 | -0.4581 | 0.648961 | 0.32448 |
| Y4 | 0.271637226912727 | 0.236105 | 1.1505 | 0.255761 | 0.12788 |
| Y5 | -0.0188616710391742 | 0.149062 | -0.1265 | 0.899847 | 0.449924 |
| t | 0.0035299223429012 | 0.003991 | 0.8845 | 0.38095 | 0.190475 |
| Multiple Linear Regression - Regression Statistics | |
| Multiple R | 0.996238049982534 |
| R-squared | 0.992490252233001 |
| Adjusted R-squared | 0.99137177916132 |
| F-TEST (value) | 887.361776838902 |
| F-TEST (DF numerator) | 7 |
| F-TEST (DF denominator) | 47 |
| p-value | 0 |
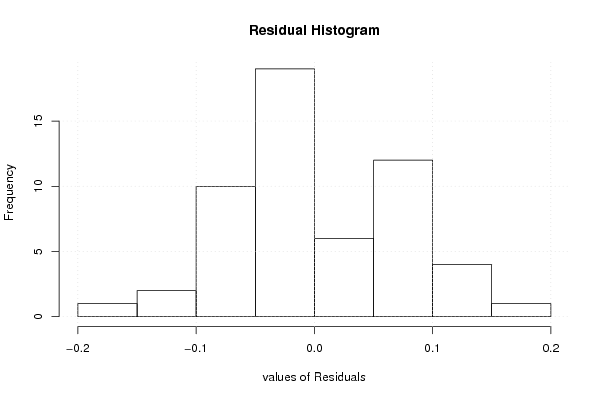
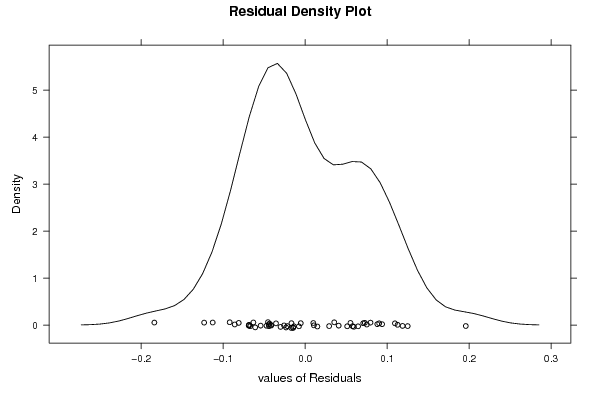
| Multiple Linear Regression - Residual Statistics | |
| Residual Standard Deviation | 0.07894860758537 |
| Sum Squared Residuals | 0.292945484064431 |
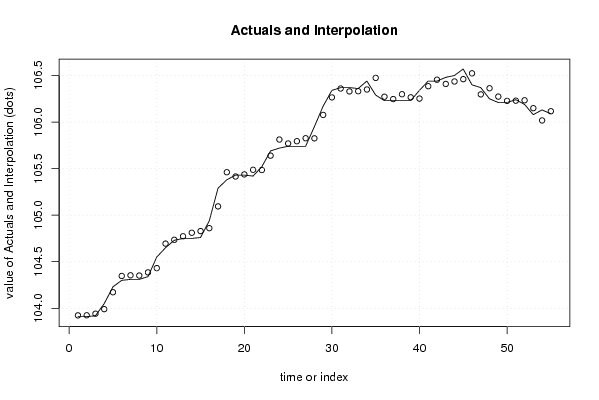
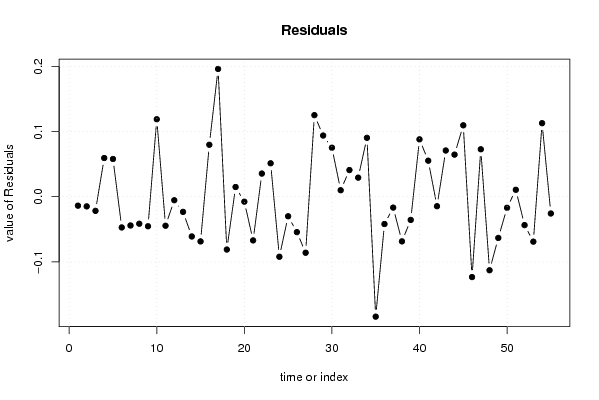
| Multiple Linear Regression - Actuals, Interpolation, and Residuals | |||
| Time or Index | Actuals | Interpolation Forecast | Residuals Prediction Error |
| 1 | 103.91 | 103.923694876667 | -0.0136948766666860 |
| 2 | 103.91 | 103.924789755446 | -0.0147897554456499 |
| 3 | 103.92 | 103.941645341270 | -0.0216453412702114 |
| 4 | 104.05 | 103.990647458687 | 0.0593525413132544 |
| 5 | 104.23 | 104.172089529124 | 0.0579104708758845 |
| 6 | 104.3 | 104.347101747472 | -0.0471017474724066 |
| 7 | 104.31 | 104.354053985388 | -0.0440539853882922 |
| 8 | 104.31 | 104.351380045969 | -0.0413800459693747 |
| 9 | 104.34 | 104.385306304686 | -0.0453063046856742 |
| 10 | 104.55 | 104.431121246444 | 0.118878753556377 |
| 11 | 104.65 | 104.694443132558 | -0.0444431325583265 |
| 12 | 104.73 | 104.73534764295 | -0.0053476429499675 |
| 13 | 104.75 | 104.773223765681 | -0.0232237656811312 |
| 14 | 104.75 | 104.810906213889 | -0.0609062138884949 |
| 15 | 104.76 | 104.828521218190 | -0.0685212181896317 |
| 16 | 104.94 | 104.860280210625 | 0.0797197893749793 |
| 17 | 105.29 | 105.094013274685 | 0.195986725314739 |
| 18 | 105.38 | 105.460992361427 | -0.0809923614266413 |
| 19 | 105.43 | 105.415095049229 | 0.0149049507714379 |
| 20 | 105.43 | 105.437550534673 | -0.00755053467327394 |
| 21 | 105.42 | 105.486978172117 | -0.0669781721174468 |
| 22 | 105.52 | 105.484468698123 | 0.0355313018768063 |
| 23 | 105.69 | 105.638699907367 | 0.051300092633371 |
| 24 | 105.72 | 105.812012535640 | -0.0920125356402588 |
| 25 | 105.74 | 105.769985084642 | -0.02998508464202 |
| 26 | 105.74 | 105.794252462300 | -0.0542524622996764 |
| 27 | 105.74 | 105.825879108859 | -0.0858791088590926 |
| 28 | 105.95 | 105.824884805968 | 0.125115194032468 |
| 29 | 106.17 | 106.076132895088 | 0.0938671049122893 |
| 30 | 106.34 | 106.264783202778 | 0.0752167972220204 |
| 31 | 106.37 | 106.360007298276 | 0.00999270172379286 |
| 32 | 106.37 | 106.329077243266 | 0.0409227567341805 |
| 33 | 106.36 | 106.330716840331 | 0.0292831596691363 |
| 34 | 106.44 | 106.349649688903 | 0.090350311097268 |
| 35 | 106.29 | 106.473896647465 | -0.183896647464736 |
| 36 | 106.23 | 106.271857884708 | -0.0418578847076219 |
| 37 | 106.23 | 106.246651005248 | -0.0166510052475141 |
| 38 | 106.23 | 106.298448761885 | -0.0684487618853065 |
| 39 | 106.23 | 106.265518201909 | -0.0355182019089434 |
| 40 | 106.34 | 106.251962095134 | 0.0880379048662037 |
| 41 | 106.44 | 106.384714258579 | 0.0552857414210537 |
| 42 | 106.44 | 106.454504731863 | -0.0145047318625162 |
| 43 | 106.48 | 106.409102976189 | 0.0708970238109437 |
| 44 | 106.5 | 106.435386148578 | 0.064613851422073 |
| 45 | 106.57 | 106.460450743149 | 0.109549256850864 |
| 46 | 106.4 | 106.523171028071 | -0.123171028070596 |
| 47 | 106.37 | 106.297222581807 | 0.0727774181933546 |
| 48 | 106.25 | 106.362750951892 | -0.112750951892213 |
| 49 | 106.21 | 106.273155353096 | -0.0631553530956664 |
| 50 | 106.21 | 106.226905773786 | -0.0169057737860680 |
| 51 | 106.24 | 106.229316034796 | 0.0106839652035338 |
| 52 | 106.19 | 106.233514899246 | -0.0435148992462501 |
| 53 | 106.08 | 106.148854084091 | -0.0688540840912035 |
| 54 | 106.13 | 106.017191913565 | 0.112808086434877 |
| 55 | 106.09 | 106.115692286228 | -0.0256922862280168 |
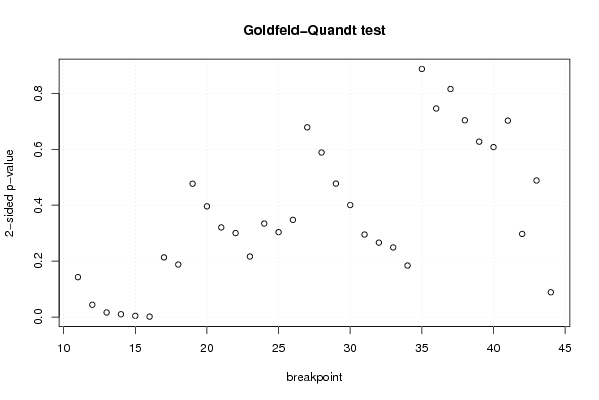
| Goldfeld-Quandt test for Heteroskedasticity | |||
| p-values | Alternative Hypothesis | ||
| breakpoint index | greater | 2-sided | less |
| 11 | 0.071265950870845 | 0.14253190174169 | 0.928734049129155 |
| 12 | 0.0218894858032215 | 0.0437789716064431 | 0.978110514196779 |
| 13 | 0.00814670263366301 | 0.0162934052673260 | 0.991853297366337 |
| 14 | 0.00493308734657163 | 0.00986617469314327 | 0.995066912653428 |
| 15 | 0.00216667796840162 | 0.00433335593680323 | 0.997833322031598 |
| 16 | 0.000635912631242297 | 0.00127182526248459 | 0.999364087368758 |
| 17 | 0.106632233816174 | 0.213264467632349 | 0.893367766183826 |
| 18 | 0.0938331915573314 | 0.187666383114663 | 0.906166808442669 |
| 19 | 0.238414354198204 | 0.476828708396409 | 0.761585645801796 |
| 20 | 0.197930614162767 | 0.395861228325534 | 0.802069385837233 |
| 21 | 0.16020519792714 | 0.32041039585428 | 0.83979480207286 |
| 22 | 0.150141424871728 | 0.300282849743456 | 0.849858575128272 |
| 23 | 0.108163703551091 | 0.216327407102182 | 0.891836296448909 |
| 24 | 0.16718194738908 | 0.33436389477816 | 0.83281805261092 |
| 25 | 0.151798772285462 | 0.303597544570924 | 0.848201227714538 |
| 26 | 0.173767408281790 | 0.347534816563580 | 0.82623259171821 |
| 27 | 0.339235750299163 | 0.678471500598327 | 0.660764249700837 |
| 28 | 0.294231866630903 | 0.588463733261806 | 0.705768133369097 |
| 29 | 0.238637280098202 | 0.477274560196403 | 0.761362719901798 |
| 30 | 0.200214296265097 | 0.400428592530195 | 0.799785703734903 |
| 31 | 0.147472425502857 | 0.294944851005715 | 0.852527574497143 |
| 32 | 0.133016256970895 | 0.266032513941791 | 0.866983743029105 |
| 33 | 0.124449598043578 | 0.248899196087157 | 0.875550401956422 |
| 34 | 0.0920529696497502 | 0.184105939299500 | 0.90794703035025 |
| 35 | 0.556351878180809 | 0.887296243638382 | 0.443648121819191 |
| 36 | 0.627049447585381 | 0.745901104829238 | 0.372950552414619 |
| 37 | 0.592274321104015 | 0.81545135779197 | 0.407725678895985 |
| 38 | 0.648157640811814 | 0.703684718376371 | 0.351842359188186 |
| 39 | 0.686429692755743 | 0.627140614488514 | 0.313570307244257 |
| 40 | 0.696157143246208 | 0.607685713507583 | 0.303842856753792 |
| 41 | 0.64875431329439 | 0.702491373411219 | 0.351245686705610 |
| 42 | 0.851394470904742 | 0.297211058190516 | 0.148605529095258 |
| 43 | 0.755849871146904 | 0.488300257706191 | 0.244150128853096 |
| 44 | 0.955787335316 | 0.0884253293680012 | 0.0442126646840006 |
| Meta Analysis of Goldfeld-Quandt test for Heteroskedasticity | |||
| Description | # significant tests | % significant tests | OK/NOK |
| 1% type I error level | 3 | 0.088235294117647 | NOK |
| 5% type I error level | 5 | 0.147058823529412 | NOK |
| 10% type I error level | 6 | 0.176470588235294 | NOK |