Free Statistics

of Irreproducible Research!

Author's title

Author*The author of this computation has been verified*
R Software Modulerwasp_autocorrelation.wasp
Title produced by software(Partial) Autocorrelation Function
Date of computationFri, 27 Nov 2009 08:05:56 -0700
Cite this page as followsStatistical Computations at FreeStatistics.org, Office for Research Development and Education, URL https://freestatistics.org/blog/index.php?v=date/2009/Nov/27/t12593343999rq5q7yeekhcgpk.htm/, Retrieved Mon, 29 Apr 2024 18:13:33 +0000
Statistical Computations at FreeStatistics.org, Office for Research Development and Education, URL https://freestatistics.org/blog/index.php?pk=60876, Retrieved Mon, 29 Apr 2024 18:13:33 +0000
QR Codes:

Original text written by user:
IsPrivate?No (this computation is public)
User-defined keywords
Estimated Impact113
Family? (F = Feedback message, R = changed R code, M = changed R Module, P = changed Parameters, D = changed Data)
-     [Univariate Explorative Data Analysis] [Run Sequence gebo...] [2008-12-12 13:32:37] [76963dc1903f0f612b6153510a3818cf]
- R  D  [Univariate Explorative Data Analysis] [Run Sequence gebo...] [2008-12-17 12:14:40] [76963dc1903f0f612b6153510a3818cf]
-         [Univariate Explorative Data Analysis] [Run Sequence Plot...] [2008-12-22 18:19:51] [1ce0d16c8f4225c977b42c8fa93bc163]
- RMP       [(Partial) Autocorrelation Function] [Identifying Integ...] [2009-11-22 12:26:39] [b98453cac15ba1066b407e146608df68]
-    D          [(Partial) Autocorrelation Function] [] [2009-11-27 15:05:56] [cb3e966d7bf80cd999a0432e97d174a7] [Current]
Feedback Forum

Post a new message
Dataseries X:
103,5
104,6
118,6
106,3
110,7
121,6
107
107,6
125,6
113,5
129,2
130,9
104,7
115,2
124,5
112,3
127,5
120,6
117,5
117,7
120,4
125
131,6
121,1
114,2
112,1
127
116,8
112
129,7
113,6
115,7
119,5
125,8
129,6
128
112,8
101,6
123,9
118,8
109,1
130,6
112,4
111
116,2
119,8
117,2
127,3
107,7
97,5
120,1
110,6
111,3
119,8
105,5
108,7
128,7
119,5
121,1
128,4


Summary of computational transaction
Raw Inputview raw input (R code)
Raw Outputview raw output of R engine
Computing time1 seconds
R Server'Gwilym Jenkins' @ 72.249.127.135

\begin{tabular}{lllllllll}
\hline
Summary of computational transaction \tabularnewline
Raw Input & view raw input (R code)  \tabularnewline
Raw Output & view raw output of R engine  \tabularnewline
Computing time & 1 seconds \tabularnewline
R Server & 'Gwilym Jenkins' @ 72.249.127.135 \tabularnewline
\hline
\end{tabular}
%Source: https://freestatistics.org/blog/index.php?pk=60876&T=0

[TABLE]
[ROW][C]Summary of computational transaction[/C][/ROW]
[ROW][C]Raw Input[/C][C]view raw input (R code) [/C][/ROW]
[ROW][C]Raw Output[/C][C]view raw output of R engine [/C][/ROW]
[ROW][C]Computing time[/C][C]1 seconds[/C][/ROW]
[ROW][C]R Server[/C][C]'Gwilym Jenkins' @ 72.249.127.135[/C][/ROW]
[/TABLE]
Source: https://freestatistics.org/blog/index.php?pk=60876&T=0

Globally Unique Identifier (entire table): ba.freestatistics.org/blog/index.php?pk=60876&T=0

As an alternative you can also use a QR Code:  

The GUIDs for individual cells are displayed in the table below:

Summary of computational transaction
Raw Inputview raw input (R code)
Raw Outputview raw output of R engine
Computing time1 seconds
R Server'Gwilym Jenkins' @ 72.249.127.135


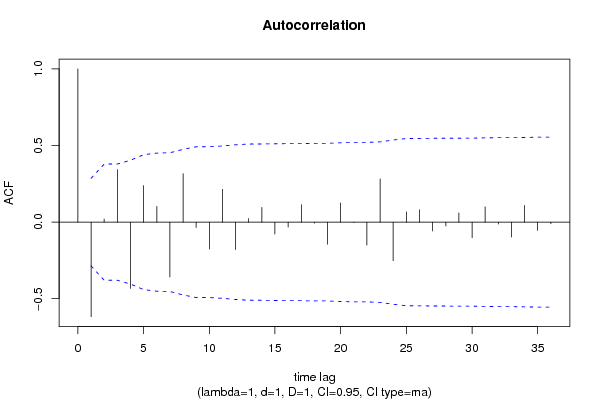
Autocorrelation Function
Time lag kACF(k)T-STATP-value
1-0.616896-4.22925.4e-05
20.0202560.13890.445075
30.3436682.35610.011346
4-0.432851-2.96750.002355
50.2391131.63930.053917
60.1022090.70070.243469
7-0.35756-2.45130.009004
80.3159912.16630.017695
9-0.034295-0.23510.407571
10-0.175498-1.20320.117471
110.2147261.47210.073831
12-0.179135-1.22810.112765
130.0238150.16330.435503
140.0957320.65630.257415
15-0.077491-0.53120.298874
16-0.03235-0.22180.412722
170.1137550.77990.21969
18-0.006604-0.04530.482041
19-0.143955-0.98690.164372
200.1256240.86120.19674
21-0.001949-0.01340.494697
22-0.149894-1.02760.154693
230.2818391.93220.029688
24-0.251658-1.72530.045524
250.0670410.45960.323958
260.0803670.5510.292134
27-0.057463-0.39390.3477
28-0.024512-0.1680.433635
290.06050.41480.3401
30-0.102497-0.70270.242859
310.099710.68360.248799
32-0.012734-0.08730.465401
33-0.097688-0.66970.253158
340.1095310.75090.228227
35-0.053802-0.36890.356948
36-0.011127-0.07630.46976

\begin{tabular}{lllllllll}
\hline
Autocorrelation Function \tabularnewline
Time lag k & ACF(k) & T-STAT & P-value \tabularnewline
1 & -0.616896 & -4.2292 & 5.4e-05 \tabularnewline
2 & 0.020256 & 0.1389 & 0.445075 \tabularnewline
3 & 0.343668 & 2.3561 & 0.011346 \tabularnewline
4 & -0.432851 & -2.9675 & 0.002355 \tabularnewline
5 & 0.239113 & 1.6393 & 0.053917 \tabularnewline
6 & 0.102209 & 0.7007 & 0.243469 \tabularnewline
7 & -0.35756 & -2.4513 & 0.009004 \tabularnewline
8 & 0.315991 & 2.1663 & 0.017695 \tabularnewline
9 & -0.034295 & -0.2351 & 0.407571 \tabularnewline
10 & -0.175498 & -1.2032 & 0.117471 \tabularnewline
11 & 0.214726 & 1.4721 & 0.073831 \tabularnewline
12 & -0.179135 & -1.2281 & 0.112765 \tabularnewline
13 & 0.023815 & 0.1633 & 0.435503 \tabularnewline
14 & 0.095732 & 0.6563 & 0.257415 \tabularnewline
15 & -0.077491 & -0.5312 & 0.298874 \tabularnewline
16 & -0.03235 & -0.2218 & 0.412722 \tabularnewline
17 & 0.113755 & 0.7799 & 0.21969 \tabularnewline
18 & -0.006604 & -0.0453 & 0.482041 \tabularnewline
19 & -0.143955 & -0.9869 & 0.164372 \tabularnewline
20 & 0.125624 & 0.8612 & 0.19674 \tabularnewline
21 & -0.001949 & -0.0134 & 0.494697 \tabularnewline
22 & -0.149894 & -1.0276 & 0.154693 \tabularnewline
23 & 0.281839 & 1.9322 & 0.029688 \tabularnewline
24 & -0.251658 & -1.7253 & 0.045524 \tabularnewline
25 & 0.067041 & 0.4596 & 0.323958 \tabularnewline
26 & 0.080367 & 0.551 & 0.292134 \tabularnewline
27 & -0.057463 & -0.3939 & 0.3477 \tabularnewline
28 & -0.024512 & -0.168 & 0.433635 \tabularnewline
29 & 0.0605 & 0.4148 & 0.3401 \tabularnewline
30 & -0.102497 & -0.7027 & 0.242859 \tabularnewline
31 & 0.09971 & 0.6836 & 0.248799 \tabularnewline
32 & -0.012734 & -0.0873 & 0.465401 \tabularnewline
33 & -0.097688 & -0.6697 & 0.253158 \tabularnewline
34 & 0.109531 & 0.7509 & 0.228227 \tabularnewline
35 & -0.053802 & -0.3689 & 0.356948 \tabularnewline
36 & -0.011127 & -0.0763 & 0.46976 \tabularnewline
\hline
\end{tabular}
%Source: https://freestatistics.org/blog/index.php?pk=60876&T=1

[TABLE]
[ROW][C]Autocorrelation Function[/C][/ROW]
[ROW][C]Time lag k[/C][C]ACF(k)[/C][C]T-STAT[/C][C]P-value[/C][/ROW]
[ROW][C]1[/C][C]-0.616896[/C][C]-4.2292[/C][C]5.4e-05[/C][/ROW]
[ROW][C]2[/C][C]0.020256[/C][C]0.1389[/C][C]0.445075[/C][/ROW]
[ROW][C]3[/C][C]0.343668[/C][C]2.3561[/C][C]0.011346[/C][/ROW]
[ROW][C]4[/C][C]-0.432851[/C][C]-2.9675[/C][C]0.002355[/C][/ROW]
[ROW][C]5[/C][C]0.239113[/C][C]1.6393[/C][C]0.053917[/C][/ROW]
[ROW][C]6[/C][C]0.102209[/C][C]0.7007[/C][C]0.243469[/C][/ROW]
[ROW][C]7[/C][C]-0.35756[/C][C]-2.4513[/C][C]0.009004[/C][/ROW]
[ROW][C]8[/C][C]0.315991[/C][C]2.1663[/C][C]0.017695[/C][/ROW]
[ROW][C]9[/C][C]-0.034295[/C][C]-0.2351[/C][C]0.407571[/C][/ROW]
[ROW][C]10[/C][C]-0.175498[/C][C]-1.2032[/C][C]0.117471[/C][/ROW]
[ROW][C]11[/C][C]0.214726[/C][C]1.4721[/C][C]0.073831[/C][/ROW]
[ROW][C]12[/C][C]-0.179135[/C][C]-1.2281[/C][C]0.112765[/C][/ROW]
[ROW][C]13[/C][C]0.023815[/C][C]0.1633[/C][C]0.435503[/C][/ROW]
[ROW][C]14[/C][C]0.095732[/C][C]0.6563[/C][C]0.257415[/C][/ROW]
[ROW][C]15[/C][C]-0.077491[/C][C]-0.5312[/C][C]0.298874[/C][/ROW]
[ROW][C]16[/C][C]-0.03235[/C][C]-0.2218[/C][C]0.412722[/C][/ROW]
[ROW][C]17[/C][C]0.113755[/C][C]0.7799[/C][C]0.21969[/C][/ROW]
[ROW][C]18[/C][C]-0.006604[/C][C]-0.0453[/C][C]0.482041[/C][/ROW]
[ROW][C]19[/C][C]-0.143955[/C][C]-0.9869[/C][C]0.164372[/C][/ROW]
[ROW][C]20[/C][C]0.125624[/C][C]0.8612[/C][C]0.19674[/C][/ROW]
[ROW][C]21[/C][C]-0.001949[/C][C]-0.0134[/C][C]0.494697[/C][/ROW]
[ROW][C]22[/C][C]-0.149894[/C][C]-1.0276[/C][C]0.154693[/C][/ROW]
[ROW][C]23[/C][C]0.281839[/C][C]1.9322[/C][C]0.029688[/C][/ROW]
[ROW][C]24[/C][C]-0.251658[/C][C]-1.7253[/C][C]0.045524[/C][/ROW]
[ROW][C]25[/C][C]0.067041[/C][C]0.4596[/C][C]0.323958[/C][/ROW]
[ROW][C]26[/C][C]0.080367[/C][C]0.551[/C][C]0.292134[/C][/ROW]
[ROW][C]27[/C][C]-0.057463[/C][C]-0.3939[/C][C]0.3477[/C][/ROW]
[ROW][C]28[/C][C]-0.024512[/C][C]-0.168[/C][C]0.433635[/C][/ROW]
[ROW][C]29[/C][C]0.0605[/C][C]0.4148[/C][C]0.3401[/C][/ROW]
[ROW][C]30[/C][C]-0.102497[/C][C]-0.7027[/C][C]0.242859[/C][/ROW]
[ROW][C]31[/C][C]0.09971[/C][C]0.6836[/C][C]0.248799[/C][/ROW]
[ROW][C]32[/C][C]-0.012734[/C][C]-0.0873[/C][C]0.465401[/C][/ROW]
[ROW][C]33[/C][C]-0.097688[/C][C]-0.6697[/C][C]0.253158[/C][/ROW]
[ROW][C]34[/C][C]0.109531[/C][C]0.7509[/C][C]0.228227[/C][/ROW]
[ROW][C]35[/C][C]-0.053802[/C][C]-0.3689[/C][C]0.356948[/C][/ROW]
[ROW][C]36[/C][C]-0.011127[/C][C]-0.0763[/C][C]0.46976[/C][/ROW]
[/TABLE]
Source: https://freestatistics.org/blog/index.php?pk=60876&T=1

Globally Unique Identifier (entire table): ba.freestatistics.org/blog/index.php?pk=60876&T=1

As an alternative you can also use a QR Code:  

The GUIDs for individual cells are displayed in the table below:

Autocorrelation Function
Time lag kACF(k)T-STATP-value
1-0.616896-4.22925.4e-05
20.0202560.13890.445075
30.3436682.35610.011346
4-0.432851-2.96750.002355
50.2391131.63930.053917
60.1022090.70070.243469
7-0.35756-2.45130.009004
80.3159912.16630.017695
9-0.034295-0.23510.407571
10-0.175498-1.20320.117471
110.2147261.47210.073831
12-0.179135-1.22810.112765
130.0238150.16330.435503
140.0957320.65630.257415
15-0.077491-0.53120.298874
16-0.03235-0.22180.412722
170.1137550.77990.21969
18-0.006604-0.04530.482041
19-0.143955-0.98690.164372
200.1256240.86120.19674
21-0.001949-0.01340.494697
22-0.149894-1.02760.154693
230.2818391.93220.029688
24-0.251658-1.72530.045524
250.0670410.45960.323958
260.0803670.5510.292134
27-0.057463-0.39390.3477
28-0.024512-0.1680.433635
290.06050.41480.3401
30-0.102497-0.70270.242859
310.099710.68360.248799
32-0.012734-0.08730.465401
33-0.097688-0.66970.253158
340.1095310.75090.228227
35-0.053802-0.36890.356948
36-0.011127-0.07630.46976


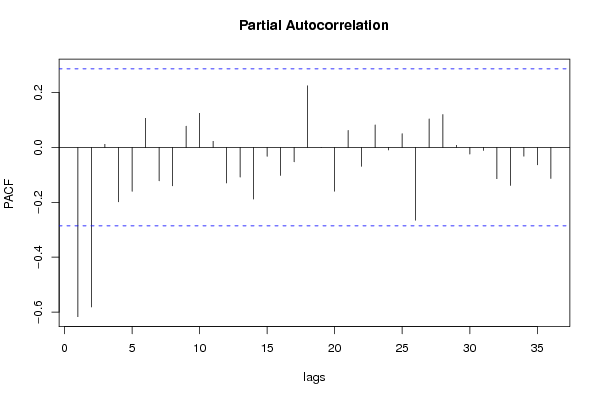
Partial Autocorrelation Function
Time lag kPACF(k)T-STATP-value
1-0.616896-4.22925.4e-05
2-0.581662-3.98770.000116
30.0112420.07710.469448
4-0.198332-1.35970.090207
5-0.160251-1.09860.138764
60.105860.72570.235799
7-0.121991-0.83630.203601
8-0.140176-0.9610.170736
90.0773180.53010.29928
100.1243460.85250.199138
110.0219560.15050.440498
12-0.129464-0.88760.189648
13-0.108-0.74040.231366
14-0.188213-1.29030.101625
15-0.032639-0.22380.411957
16-0.102181-0.70050.243529
17-0.052673-0.36110.35982
180.2246441.54010.065123
19-0.00085-0.00580.497689
20-0.159458-1.09320.139942
210.0616990.4230.337117
22-0.069097-0.47370.318952
230.0819360.56170.288487
24-0.009184-0.0630.475032
250.0501550.34380.366247
26-0.265484-1.82010.03756
270.1037840.71150.240144
280.1197690.82110.207869
290.0074650.05120.4797
30-0.024329-0.16680.434126
31-0.010997-0.07540.470112
32-0.114262-0.78330.218679
33-0.13852-0.94960.173574
34-0.032245-0.22110.413003
35-0.063348-0.43430.333033
36-0.113055-0.77510.221091

\begin{tabular}{lllllllll}
\hline
Partial Autocorrelation Function \tabularnewline
Time lag k & PACF(k) & T-STAT & P-value \tabularnewline
1 & -0.616896 & -4.2292 & 5.4e-05 \tabularnewline
2 & -0.581662 & -3.9877 & 0.000116 \tabularnewline
3 & 0.011242 & 0.0771 & 0.469448 \tabularnewline
4 & -0.198332 & -1.3597 & 0.090207 \tabularnewline
5 & -0.160251 & -1.0986 & 0.138764 \tabularnewline
6 & 0.10586 & 0.7257 & 0.235799 \tabularnewline
7 & -0.121991 & -0.8363 & 0.203601 \tabularnewline
8 & -0.140176 & -0.961 & 0.170736 \tabularnewline
9 & 0.077318 & 0.5301 & 0.29928 \tabularnewline
10 & 0.124346 & 0.8525 & 0.199138 \tabularnewline
11 & 0.021956 & 0.1505 & 0.440498 \tabularnewline
12 & -0.129464 & -0.8876 & 0.189648 \tabularnewline
13 & -0.108 & -0.7404 & 0.231366 \tabularnewline
14 & -0.188213 & -1.2903 & 0.101625 \tabularnewline
15 & -0.032639 & -0.2238 & 0.411957 \tabularnewline
16 & -0.102181 & -0.7005 & 0.243529 \tabularnewline
17 & -0.052673 & -0.3611 & 0.35982 \tabularnewline
18 & 0.224644 & 1.5401 & 0.065123 \tabularnewline
19 & -0.00085 & -0.0058 & 0.497689 \tabularnewline
20 & -0.159458 & -1.0932 & 0.139942 \tabularnewline
21 & 0.061699 & 0.423 & 0.337117 \tabularnewline
22 & -0.069097 & -0.4737 & 0.318952 \tabularnewline
23 & 0.081936 & 0.5617 & 0.288487 \tabularnewline
24 & -0.009184 & -0.063 & 0.475032 \tabularnewline
25 & 0.050155 & 0.3438 & 0.366247 \tabularnewline
26 & -0.265484 & -1.8201 & 0.03756 \tabularnewline
27 & 0.103784 & 0.7115 & 0.240144 \tabularnewline
28 & 0.119769 & 0.8211 & 0.207869 \tabularnewline
29 & 0.007465 & 0.0512 & 0.4797 \tabularnewline
30 & -0.024329 & -0.1668 & 0.434126 \tabularnewline
31 & -0.010997 & -0.0754 & 0.470112 \tabularnewline
32 & -0.114262 & -0.7833 & 0.218679 \tabularnewline
33 & -0.13852 & -0.9496 & 0.173574 \tabularnewline
34 & -0.032245 & -0.2211 & 0.413003 \tabularnewline
35 & -0.063348 & -0.4343 & 0.333033 \tabularnewline
36 & -0.113055 & -0.7751 & 0.221091 \tabularnewline
\hline
\end{tabular}
%Source: https://freestatistics.org/blog/index.php?pk=60876&T=2

[TABLE]
[ROW][C]Partial Autocorrelation Function[/C][/ROW]
[ROW][C]Time lag k[/C][C]PACF(k)[/C][C]T-STAT[/C][C]P-value[/C][/ROW]
[ROW][C]1[/C][C]-0.616896[/C][C]-4.2292[/C][C]5.4e-05[/C][/ROW]
[ROW][C]2[/C][C]-0.581662[/C][C]-3.9877[/C][C]0.000116[/C][/ROW]
[ROW][C]3[/C][C]0.011242[/C][C]0.0771[/C][C]0.469448[/C][/ROW]
[ROW][C]4[/C][C]-0.198332[/C][C]-1.3597[/C][C]0.090207[/C][/ROW]
[ROW][C]5[/C][C]-0.160251[/C][C]-1.0986[/C][C]0.138764[/C][/ROW]
[ROW][C]6[/C][C]0.10586[/C][C]0.7257[/C][C]0.235799[/C][/ROW]
[ROW][C]7[/C][C]-0.121991[/C][C]-0.8363[/C][C]0.203601[/C][/ROW]
[ROW][C]8[/C][C]-0.140176[/C][C]-0.961[/C][C]0.170736[/C][/ROW]
[ROW][C]9[/C][C]0.077318[/C][C]0.5301[/C][C]0.29928[/C][/ROW]
[ROW][C]10[/C][C]0.124346[/C][C]0.8525[/C][C]0.199138[/C][/ROW]
[ROW][C]11[/C][C]0.021956[/C][C]0.1505[/C][C]0.440498[/C][/ROW]
[ROW][C]12[/C][C]-0.129464[/C][C]-0.8876[/C][C]0.189648[/C][/ROW]
[ROW][C]13[/C][C]-0.108[/C][C]-0.7404[/C][C]0.231366[/C][/ROW]
[ROW][C]14[/C][C]-0.188213[/C][C]-1.2903[/C][C]0.101625[/C][/ROW]
[ROW][C]15[/C][C]-0.032639[/C][C]-0.2238[/C][C]0.411957[/C][/ROW]
[ROW][C]16[/C][C]-0.102181[/C][C]-0.7005[/C][C]0.243529[/C][/ROW]
[ROW][C]17[/C][C]-0.052673[/C][C]-0.3611[/C][C]0.35982[/C][/ROW]
[ROW][C]18[/C][C]0.224644[/C][C]1.5401[/C][C]0.065123[/C][/ROW]
[ROW][C]19[/C][C]-0.00085[/C][C]-0.0058[/C][C]0.497689[/C][/ROW]
[ROW][C]20[/C][C]-0.159458[/C][C]-1.0932[/C][C]0.139942[/C][/ROW]
[ROW][C]21[/C][C]0.061699[/C][C]0.423[/C][C]0.337117[/C][/ROW]
[ROW][C]22[/C][C]-0.069097[/C][C]-0.4737[/C][C]0.318952[/C][/ROW]
[ROW][C]23[/C][C]0.081936[/C][C]0.5617[/C][C]0.288487[/C][/ROW]
[ROW][C]24[/C][C]-0.009184[/C][C]-0.063[/C][C]0.475032[/C][/ROW]
[ROW][C]25[/C][C]0.050155[/C][C]0.3438[/C][C]0.366247[/C][/ROW]
[ROW][C]26[/C][C]-0.265484[/C][C]-1.8201[/C][C]0.03756[/C][/ROW]
[ROW][C]27[/C][C]0.103784[/C][C]0.7115[/C][C]0.240144[/C][/ROW]
[ROW][C]28[/C][C]0.119769[/C][C]0.8211[/C][C]0.207869[/C][/ROW]
[ROW][C]29[/C][C]0.007465[/C][C]0.0512[/C][C]0.4797[/C][/ROW]
[ROW][C]30[/C][C]-0.024329[/C][C]-0.1668[/C][C]0.434126[/C][/ROW]
[ROW][C]31[/C][C]-0.010997[/C][C]-0.0754[/C][C]0.470112[/C][/ROW]
[ROW][C]32[/C][C]-0.114262[/C][C]-0.7833[/C][C]0.218679[/C][/ROW]
[ROW][C]33[/C][C]-0.13852[/C][C]-0.9496[/C][C]0.173574[/C][/ROW]
[ROW][C]34[/C][C]-0.032245[/C][C]-0.2211[/C][C]0.413003[/C][/ROW]
[ROW][C]35[/C][C]-0.063348[/C][C]-0.4343[/C][C]0.333033[/C][/ROW]
[ROW][C]36[/C][C]-0.113055[/C][C]-0.7751[/C][C]0.221091[/C][/ROW]
[/TABLE]
Source: https://freestatistics.org/blog/index.php?pk=60876&T=2

Globally Unique Identifier (entire table): ba.freestatistics.org/blog/index.php?pk=60876&T=2

As an alternative you can also use a QR Code:  

The GUIDs for individual cells are displayed in the table below:

Partial Autocorrelation Function
Time lag kPACF(k)T-STATP-value
1-0.616896-4.22925.4e-05
2-0.581662-3.98770.000116
30.0112420.07710.469448
4-0.198332-1.35970.090207
5-0.160251-1.09860.138764
60.105860.72570.235799
7-0.121991-0.83630.203601
8-0.140176-0.9610.170736
90.0773180.53010.29928
100.1243460.85250.199138
110.0219560.15050.440498
12-0.129464-0.88760.189648
13-0.108-0.74040.231366
14-0.188213-1.29030.101625
15-0.032639-0.22380.411957
16-0.102181-0.70050.243529
17-0.052673-0.36110.35982
180.2246441.54010.065123
19-0.00085-0.00580.497689
20-0.159458-1.09320.139942
210.0616990.4230.337117
22-0.069097-0.47370.318952
230.0819360.56170.288487
24-0.009184-0.0630.475032
250.0501550.34380.366247
26-0.265484-1.82010.03756
270.1037840.71150.240144
280.1197690.82110.207869
290.0074650.05120.4797
30-0.024329-0.16680.434126
31-0.010997-0.07540.470112
32-0.114262-0.78330.218679
33-0.13852-0.94960.173574
34-0.032245-0.22110.413003
35-0.063348-0.43430.333033
36-0.113055-0.77510.221091


Parameters (Session):
par1 = 36 ; par2 = 1 ; par3 = 1 ; par4 = 1 ; par5 = 12 ; par6 = MA ; par7 = 0.95 ;
Parameters (R input):
par1 = 36 ; par2 = 1 ; par3 = 1 ; par4 = 1 ; par5 = 12 ; par6 = MA ; par7 = 0.95 ;
R code (references can be found in the software module):
if (par1 == 'Default') {
par1 = 10*log10(length(x))
} else {
par1 <- as.numeric(par1)
}
par2 <- as.numeric(par2)
par3 <- as.numeric(par3)
par4 <- as.numeric(par4)
par5 <- as.numeric(par5)
if (par6 == 'White Noise') par6 <- 'white' else par6 <- 'ma'
par7 <- as.numeric(par7)
if (par2 == 0) {
x <- log(x)
} else {
x <- (x ^ par2 - 1) / par2
}
if (par3 > 0) x <- diff(x,lag=1,difference=par3)
if (par4 > 0) x <- diff(x,lag=par5,difference=par4)
bitmap(file='pic1.png')
racf <- acf(x, par1, main='Autocorrelation', xlab='time lag', ylab='ACF', ci.type=par6, ci=par7, sub=paste('(lambda=',par2,', d=',par3,', D=',par4,', CI=', par7, ', CI type=',par6,')',sep=''))
dev.off()
bitmap(file='pic2.png')
rpacf <- pacf(x,par1,main='Partial Autocorrelation',xlab='lags',ylab='PACF')
dev.off()
(myacf <- c(racf$acf))
(mypacf <- c(rpacf$acf))
lengthx <- length(x)
sqrtn <- sqrt(lengthx)
load(file='createtable')
a<-table.start()
a<-table.row.start(a)
a<-table.element(a,'Autocorrelation Function',4,TRUE)
a<-table.row.end(a)
a<-table.row.start(a)
a<-table.element(a,'Time lag k',header=TRUE)
a<-table.element(a,hyperlink('basics.htm','ACF(k)','click here for more information about the Autocorrelation Function'),header=TRUE)
a<-table.element(a,'T-STAT',header=TRUE)
a<-table.element(a,'P-value',header=TRUE)
a<-table.row.end(a)
for (i in 2:(par1+1)) {
a<-table.row.start(a)
a<-table.element(a,i-1,header=TRUE)
a<-table.element(a,round(myacf[i],6))
mytstat <- myacf[i]*sqrtn
a<-table.element(a,round(mytstat,4))
a<-table.element(a,round(1-pt(abs(mytstat),lengthx),6))
a<-table.row.end(a)
}
a<-table.end(a)
table.save(a,file='mytable.tab')
a<-table.start()
a<-table.row.start(a)
a<-table.element(a,'Partial Autocorrelation Function',4,TRUE)
a<-table.row.end(a)
a<-table.row.start(a)
a<-table.element(a,'Time lag k',header=TRUE)
a<-table.element(a,hyperlink('basics.htm','PACF(k)','click here for more information about the Partial Autocorrelation Function'),header=TRUE)
a<-table.element(a,'T-STAT',header=TRUE)
a<-table.element(a,'P-value',header=TRUE)
a<-table.row.end(a)
for (i in 1:par1) {
a<-table.row.start(a)
a<-table.element(a,i,header=TRUE)
a<-table.element(a,round(mypacf[i],6))
mytstat <- mypacf[i]*sqrtn
a<-table.element(a,round(mytstat,4))
a<-table.element(a,round(1-pt(abs(mytstat),lengthx),6))
a<-table.row.end(a)
}
a<-table.end(a)
table.save(a,file='mytable1.tab')