Free Statistics

of Irreproducible Research!

Author's title

Author*The author of this computation has been verified*
R Software Modulerwasp_autocorrelation.wasp
Title produced by software(Partial) Autocorrelation Function
Date of computationFri, 27 Nov 2009 06:39:21 -0700
Cite this page as followsStatistical Computations at FreeStatistics.org, Office for Research Development and Education, URL https://freestatistics.org/blog/index.php?v=date/2009/Nov/27/t12593292050i1agoe3jblq28x.htm/, Retrieved Mon, 29 Apr 2024 20:41:30 +0000
Statistical Computations at FreeStatistics.org, Office for Research Development and Education, URL https://freestatistics.org/blog/index.php?pk=60749, Retrieved Mon, 29 Apr 2024 20:41:30 +0000
QR Codes:

Original text written by user:
IsPrivate?No (this computation is public)
User-defined keywordsshwws8
Estimated Impact145
Family? (F = Feedback message, R = changed R code, M = changed R Module, P = changed Parameters, D = changed Data)
-     [Multiple Regression] [Q1 The Seatbeltlaw] [2007-11-14 19:27:43] [8cd6641b921d30ebe00b648d1481bba0]
- RMPD  [Multiple Regression] [Seatbelt] [2009-11-12 13:54:52] [b98453cac15ba1066b407e146608df68]
-    D    [Multiple Regression] [] [2009-11-20 13:47:03] [5482608004c1d7bbf873930172393a2d]
- RMPD        [(Partial) Autocorrelation Function] [] [2009-11-27 13:39:21] [efdfe680cd785c4af09f858b30f777ec] [Current]
-   P           [(Partial) Autocorrelation Function] [workshop 8] [2009-11-28 12:43:04] [eaf42bcf5162b5692bb3c7f9d4636222]
Feedback Forum

Post a new message
Dataseries X:
6539
6699
6962
6981
7024
6940
6774
6671
6965
6969
6822
6878
6691
6837
7018
7167
7076
7171
7093
6971
7142
7047
6999
6650
6475
6437
6639
6422
6272
6232
6003
5673
6050
5977
5796
5752
5609
5839
6069
6006
5809
5797
5502
5568
5864
5764
5615
5615
5681
5915
6334
6494
6620
6578
6495
6538
6737
6651
6530
6563


Summary of computational transaction
Raw Inputview raw input (R code)
Raw Outputview raw output of R engine
Computing time1 seconds
R Server'Gwilym Jenkins' @ 72.249.127.135

\begin{tabular}{lllllllll}
\hline
Summary of computational transaction \tabularnewline
Raw Input & view raw input (R code)  \tabularnewline
Raw Output & view raw output of R engine  \tabularnewline
Computing time & 1 seconds \tabularnewline
R Server & 'Gwilym Jenkins' @ 72.249.127.135 \tabularnewline
\hline
\end{tabular}
%Source: https://freestatistics.org/blog/index.php?pk=60749&T=0

[TABLE]
[ROW][C]Summary of computational transaction[/C][/ROW]
[ROW][C]Raw Input[/C][C]view raw input (R code) [/C][/ROW]
[ROW][C]Raw Output[/C][C]view raw output of R engine [/C][/ROW]
[ROW][C]Computing time[/C][C]1 seconds[/C][/ROW]
[ROW][C]R Server[/C][C]'Gwilym Jenkins' @ 72.249.127.135[/C][/ROW]
[/TABLE]
Source: https://freestatistics.org/blog/index.php?pk=60749&T=0

Globally Unique Identifier (entire table): ba.freestatistics.org/blog/index.php?pk=60749&T=0

As an alternative you can also use a QR Code:  

The GUIDs for individual cells are displayed in the table below:

Summary of computational transaction
Raw Inputview raw input (R code)
Raw Outputview raw output of R engine
Computing time1 seconds
R Server'Gwilym Jenkins' @ 72.249.127.135


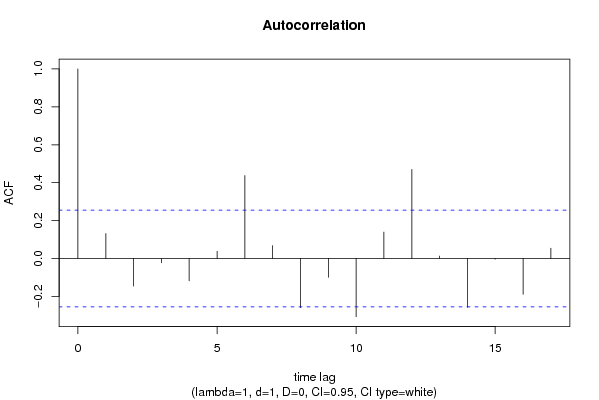
Autocorrelation Function
Time lag kACF(k)T-STATP-value
10.1316061.01090.158099
2-0.145613-1.11850.133948
3-0.023035-0.17690.430082
4-0.117769-0.90460.184677
50.03750.2880.387163
60.4373563.35940.000687
70.0679180.52170.30192
8-0.259815-1.99570.025296
9-0.099824-0.76680.223141
10-0.307159-2.35930.010818
110.1391641.06890.144726
120.4697523.60820.000318
130.0124710.09580.462005
14-0.25858-1.98620.025832
15-0.004127-0.03170.487408
16-0.188971-1.45150.075967
170.053920.41420.340126

\begin{tabular}{lllllllll}
\hline
Autocorrelation Function \tabularnewline
Time lag k & ACF(k) & T-STAT & P-value \tabularnewline
1 & 0.131606 & 1.0109 & 0.158099 \tabularnewline
2 & -0.145613 & -1.1185 & 0.133948 \tabularnewline
3 & -0.023035 & -0.1769 & 0.430082 \tabularnewline
4 & -0.117769 & -0.9046 & 0.184677 \tabularnewline
5 & 0.0375 & 0.288 & 0.387163 \tabularnewline
6 & 0.437356 & 3.3594 & 0.000687 \tabularnewline
7 & 0.067918 & 0.5217 & 0.30192 \tabularnewline
8 & -0.259815 & -1.9957 & 0.025296 \tabularnewline
9 & -0.099824 & -0.7668 & 0.223141 \tabularnewline
10 & -0.307159 & -2.3593 & 0.010818 \tabularnewline
11 & 0.139164 & 1.0689 & 0.144726 \tabularnewline
12 & 0.469752 & 3.6082 & 0.000318 \tabularnewline
13 & 0.012471 & 0.0958 & 0.462005 \tabularnewline
14 & -0.25858 & -1.9862 & 0.025832 \tabularnewline
15 & -0.004127 & -0.0317 & 0.487408 \tabularnewline
16 & -0.188971 & -1.4515 & 0.075967 \tabularnewline
17 & 0.05392 & 0.4142 & 0.340126 \tabularnewline
\hline
\end{tabular}
%Source: https://freestatistics.org/blog/index.php?pk=60749&T=1

[TABLE]
[ROW][C]Autocorrelation Function[/C][/ROW]
[ROW][C]Time lag k[/C][C]ACF(k)[/C][C]T-STAT[/C][C]P-value[/C][/ROW]
[ROW][C]1[/C][C]0.131606[/C][C]1.0109[/C][C]0.158099[/C][/ROW]
[ROW][C]2[/C][C]-0.145613[/C][C]-1.1185[/C][C]0.133948[/C][/ROW]
[ROW][C]3[/C][C]-0.023035[/C][C]-0.1769[/C][C]0.430082[/C][/ROW]
[ROW][C]4[/C][C]-0.117769[/C][C]-0.9046[/C][C]0.184677[/C][/ROW]
[ROW][C]5[/C][C]0.0375[/C][C]0.288[/C][C]0.387163[/C][/ROW]
[ROW][C]6[/C][C]0.437356[/C][C]3.3594[/C][C]0.000687[/C][/ROW]
[ROW][C]7[/C][C]0.067918[/C][C]0.5217[/C][C]0.30192[/C][/ROW]
[ROW][C]8[/C][C]-0.259815[/C][C]-1.9957[/C][C]0.025296[/C][/ROW]
[ROW][C]9[/C][C]-0.099824[/C][C]-0.7668[/C][C]0.223141[/C][/ROW]
[ROW][C]10[/C][C]-0.307159[/C][C]-2.3593[/C][C]0.010818[/C][/ROW]
[ROW][C]11[/C][C]0.139164[/C][C]1.0689[/C][C]0.144726[/C][/ROW]
[ROW][C]12[/C][C]0.469752[/C][C]3.6082[/C][C]0.000318[/C][/ROW]
[ROW][C]13[/C][C]0.012471[/C][C]0.0958[/C][C]0.462005[/C][/ROW]
[ROW][C]14[/C][C]-0.25858[/C][C]-1.9862[/C][C]0.025832[/C][/ROW]
[ROW][C]15[/C][C]-0.004127[/C][C]-0.0317[/C][C]0.487408[/C][/ROW]
[ROW][C]16[/C][C]-0.188971[/C][C]-1.4515[/C][C]0.075967[/C][/ROW]
[ROW][C]17[/C][C]0.05392[/C][C]0.4142[/C][C]0.340126[/C][/ROW]
[/TABLE]
Source: https://freestatistics.org/blog/index.php?pk=60749&T=1

Globally Unique Identifier (entire table): ba.freestatistics.org/blog/index.php?pk=60749&T=1

As an alternative you can also use a QR Code:  

The GUIDs for individual cells are displayed in the table below:

Autocorrelation Function
Time lag kACF(k)T-STATP-value
10.1316061.01090.158099
2-0.145613-1.11850.133948
3-0.023035-0.17690.430082
4-0.117769-0.90460.184677
50.03750.2880.387163
60.4373563.35940.000687
70.0679180.52170.30192
8-0.259815-1.99570.025296
9-0.099824-0.76680.223141
10-0.307159-2.35930.010818
110.1391641.06890.144726
120.4697523.60820.000318
130.0124710.09580.462005
14-0.25858-1.98620.025832
15-0.004127-0.03170.487408
16-0.188971-1.45150.075967
170.053920.41420.340126


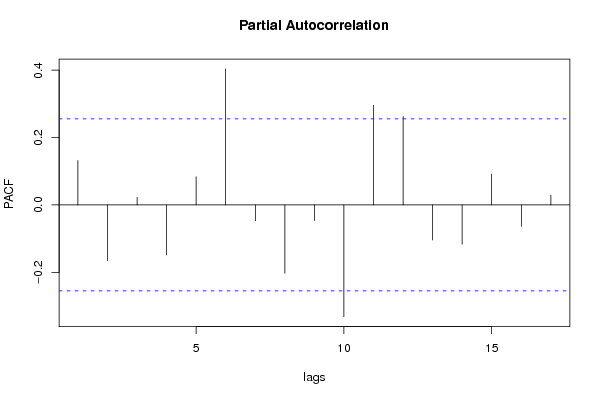
Partial Autocorrelation Function
Time lag kPACF(k)T-STATP-value
10.1316061.01090.158099
2-0.165805-1.27360.103904
30.0221070.16980.432871
4-0.148344-1.13940.12956
50.0835450.64170.261769
60.4036213.10030.001481
7-0.047102-0.36180.359398
8-0.203034-1.55950.062109
9-0.046218-0.3550.361924
10-0.331553-2.54670.006752
110.2961792.2750.013278
120.2628222.01880.024032
13-0.103755-0.7970.214337
14-0.116366-0.89380.187524
150.0917480.70470.241875
16-0.063423-0.48720.313974
170.0291270.22370.411871

\begin{tabular}{lllllllll}
\hline
Partial Autocorrelation Function \tabularnewline
Time lag k & PACF(k) & T-STAT & P-value \tabularnewline
1 & 0.131606 & 1.0109 & 0.158099 \tabularnewline
2 & -0.165805 & -1.2736 & 0.103904 \tabularnewline
3 & 0.022107 & 0.1698 & 0.432871 \tabularnewline
4 & -0.148344 & -1.1394 & 0.12956 \tabularnewline
5 & 0.083545 & 0.6417 & 0.261769 \tabularnewline
6 & 0.403621 & 3.1003 & 0.001481 \tabularnewline
7 & -0.047102 & -0.3618 & 0.359398 \tabularnewline
8 & -0.203034 & -1.5595 & 0.062109 \tabularnewline
9 & -0.046218 & -0.355 & 0.361924 \tabularnewline
10 & -0.331553 & -2.5467 & 0.006752 \tabularnewline
11 & 0.296179 & 2.275 & 0.013278 \tabularnewline
12 & 0.262822 & 2.0188 & 0.024032 \tabularnewline
13 & -0.103755 & -0.797 & 0.214337 \tabularnewline
14 & -0.116366 & -0.8938 & 0.187524 \tabularnewline
15 & 0.091748 & 0.7047 & 0.241875 \tabularnewline
16 & -0.063423 & -0.4872 & 0.313974 \tabularnewline
17 & 0.029127 & 0.2237 & 0.411871 \tabularnewline
\hline
\end{tabular}
%Source: https://freestatistics.org/blog/index.php?pk=60749&T=2

[TABLE]
[ROW][C]Partial Autocorrelation Function[/C][/ROW]
[ROW][C]Time lag k[/C][C]PACF(k)[/C][C]T-STAT[/C][C]P-value[/C][/ROW]
[ROW][C]1[/C][C]0.131606[/C][C]1.0109[/C][C]0.158099[/C][/ROW]
[ROW][C]2[/C][C]-0.165805[/C][C]-1.2736[/C][C]0.103904[/C][/ROW]
[ROW][C]3[/C][C]0.022107[/C][C]0.1698[/C][C]0.432871[/C][/ROW]
[ROW][C]4[/C][C]-0.148344[/C][C]-1.1394[/C][C]0.12956[/C][/ROW]
[ROW][C]5[/C][C]0.083545[/C][C]0.6417[/C][C]0.261769[/C][/ROW]
[ROW][C]6[/C][C]0.403621[/C][C]3.1003[/C][C]0.001481[/C][/ROW]
[ROW][C]7[/C][C]-0.047102[/C][C]-0.3618[/C][C]0.359398[/C][/ROW]
[ROW][C]8[/C][C]-0.203034[/C][C]-1.5595[/C][C]0.062109[/C][/ROW]
[ROW][C]9[/C][C]-0.046218[/C][C]-0.355[/C][C]0.361924[/C][/ROW]
[ROW][C]10[/C][C]-0.331553[/C][C]-2.5467[/C][C]0.006752[/C][/ROW]
[ROW][C]11[/C][C]0.296179[/C][C]2.275[/C][C]0.013278[/C][/ROW]
[ROW][C]12[/C][C]0.262822[/C][C]2.0188[/C][C]0.024032[/C][/ROW]
[ROW][C]13[/C][C]-0.103755[/C][C]-0.797[/C][C]0.214337[/C][/ROW]
[ROW][C]14[/C][C]-0.116366[/C][C]-0.8938[/C][C]0.187524[/C][/ROW]
[ROW][C]15[/C][C]0.091748[/C][C]0.7047[/C][C]0.241875[/C][/ROW]
[ROW][C]16[/C][C]-0.063423[/C][C]-0.4872[/C][C]0.313974[/C][/ROW]
[ROW][C]17[/C][C]0.029127[/C][C]0.2237[/C][C]0.411871[/C][/ROW]
[/TABLE]
Source: https://freestatistics.org/blog/index.php?pk=60749&T=2

Globally Unique Identifier (entire table): ba.freestatistics.org/blog/index.php?pk=60749&T=2

As an alternative you can also use a QR Code:  

The GUIDs for individual cells are displayed in the table below:

Partial Autocorrelation Function
Time lag kPACF(k)T-STATP-value
10.1316061.01090.158099
2-0.165805-1.27360.103904
30.0221070.16980.432871
4-0.148344-1.13940.12956
50.0835450.64170.261769
60.4036213.10030.001481
7-0.047102-0.36180.359398
8-0.203034-1.55950.062109
9-0.046218-0.3550.361924
10-0.331553-2.54670.006752
110.2961792.2750.013278
120.2628222.01880.024032
13-0.103755-0.7970.214337
14-0.116366-0.89380.187524
150.0917480.70470.241875
16-0.063423-0.48720.313974
170.0291270.22370.411871


Parameters (Session):
par1 = Default ; par2 = 1 ; par3 = 1 ; par4 = 0 ; par5 = 12 ; par6 = White Noise ; par7 = 0.95 ;
Parameters (R input):
par1 = Default ; par2 = 1 ; par3 = 1 ; par4 = 0 ; par5 = 12 ; par6 = White Noise ; par7 = 0.95 ;
R code (references can be found in the software module):
if (par1 == 'Default') {
par1 = 10*log10(length(x))
} else {
par1 <- as.numeric(par1)
}
par2 <- as.numeric(par2)
par3 <- as.numeric(par3)
par4 <- as.numeric(par4)
par5 <- as.numeric(par5)
if (par6 == 'White Noise') par6 <- 'white' else par6 <- 'ma'
par7 <- as.numeric(par7)
if (par2 == 0) {
x <- log(x)
} else {
x <- (x ^ par2 - 1) / par2
}
if (par3 > 0) x <- diff(x,lag=1,difference=par3)
if (par4 > 0) x <- diff(x,lag=par5,difference=par4)
bitmap(file='pic1.png')
racf <- acf(x, par1, main='Autocorrelation', xlab='time lag', ylab='ACF', ci.type=par6, ci=par7, sub=paste('(lambda=',par2,', d=',par3,', D=',par4,', CI=', par7, ', CI type=',par6,')',sep=''))
dev.off()
bitmap(file='pic2.png')
rpacf <- pacf(x,par1,main='Partial Autocorrelation',xlab='lags',ylab='PACF')
dev.off()
(myacf <- c(racf$acf))
(mypacf <- c(rpacf$acf))
lengthx <- length(x)
sqrtn <- sqrt(lengthx)
load(file='createtable')
a<-table.start()
a<-table.row.start(a)
a<-table.element(a,'Autocorrelation Function',4,TRUE)
a<-table.row.end(a)
a<-table.row.start(a)
a<-table.element(a,'Time lag k',header=TRUE)
a<-table.element(a,hyperlink('basics.htm','ACF(k)','click here for more information about the Autocorrelation Function'),header=TRUE)
a<-table.element(a,'T-STAT',header=TRUE)
a<-table.element(a,'P-value',header=TRUE)
a<-table.row.end(a)
for (i in 2:(par1+1)) {
a<-table.row.start(a)
a<-table.element(a,i-1,header=TRUE)
a<-table.element(a,round(myacf[i],6))
mytstat <- myacf[i]*sqrtn
a<-table.element(a,round(mytstat,4))
a<-table.element(a,round(1-pt(abs(mytstat),lengthx),6))
a<-table.row.end(a)
}
a<-table.end(a)
table.save(a,file='mytable.tab')
a<-table.start()
a<-table.row.start(a)
a<-table.element(a,'Partial Autocorrelation Function',4,TRUE)
a<-table.row.end(a)
a<-table.row.start(a)
a<-table.element(a,'Time lag k',header=TRUE)
a<-table.element(a,hyperlink('basics.htm','PACF(k)','click here for more information about the Partial Autocorrelation Function'),header=TRUE)
a<-table.element(a,'T-STAT',header=TRUE)
a<-table.element(a,'P-value',header=TRUE)
a<-table.row.end(a)
for (i in 1:par1) {
a<-table.row.start(a)
a<-table.element(a,i,header=TRUE)
a<-table.element(a,round(mypacf[i],6))
mytstat <- mypacf[i]*sqrtn
a<-table.element(a,round(mytstat,4))
a<-table.element(a,round(1-pt(abs(mytstat),lengthx),6))
a<-table.row.end(a)
}
a<-table.end(a)
table.save(a,file='mytable1.tab')