| Multiple Linear Regression - Estimated Regression Equation |
| Yt[t] = + 548.326582278481 -48.8164556962025X[t] + 0.945569620252883M1[t] + 45.0367088607595M2[t] + 54.4367088607595M3[t] + 45.6367088607595M4[t] + 30.2367088607595M5[t] + 14.8367088607595M6[t] + 17.2367088607595M7[t] + 19.4367088607595M8[t] + 15.2367088607595M9[t] + 6.43670886075953M10[t] + 1.43670886075952M11[t] + e[t] |
| Multiple Linear Regression - Ordinary Least Squares | |||||
| Variable | Parameter | S.D. | T-STAT H0: parameter = 0 | 2-tail p-value | 1-tail p-value |
| (Intercept) | 548.326582278481 | 16.168896 | 33.9124 | 0 | 0 |
| X | -48.8164556962025 | 10.739561 | -4.5455 | 3.7e-05 | 1.9e-05 |
| M1 | 0.945569620252883 | 21.118103 | 0.0448 | 0.964472 | 0.482236 |
| M2 | 45.0367088607595 | 22.148853 | 2.0334 | 0.047565 | 0.023782 |
| M3 | 54.4367088607595 | 22.148853 | 2.4578 | 0.017642 | 0.008821 |
| M4 | 45.6367088607595 | 22.148853 | 2.0605 | 0.044797 | 0.022399 |
| M5 | 30.2367088607595 | 22.148853 | 1.3652 | 0.178568 | 0.089284 |
| M6 | 14.8367088607595 | 22.148853 | 0.6699 | 0.506155 | 0.253077 |
| M7 | 17.2367088607595 | 22.148853 | 0.7782 | 0.440258 | 0.220129 |
| M8 | 19.4367088607595 | 22.148853 | 0.8775 | 0.38456 | 0.19228 |
| M9 | 15.2367088607595 | 22.148853 | 0.6879 | 0.494812 | 0.247406 |
| M10 | 6.43670886075953 | 22.148853 | 0.2906 | 0.772601 | 0.3863 |
| M11 | 1.43670886075952 | 22.148853 | 0.0649 | 0.94855 | 0.474275 |
| Multiple Linear Regression - Regression Statistics | |
| Multiple R | 0.676505460555468 |
| R-squared | 0.457659638161366 |
| Adjusted R-squared | 0.322074547701707 |
| F-TEST (value) | 3.37544221573194 |
| F-TEST (DF numerator) | 12 |
| F-TEST (DF denominator) | 48 |
| p-value | 0.00128608346648806 |
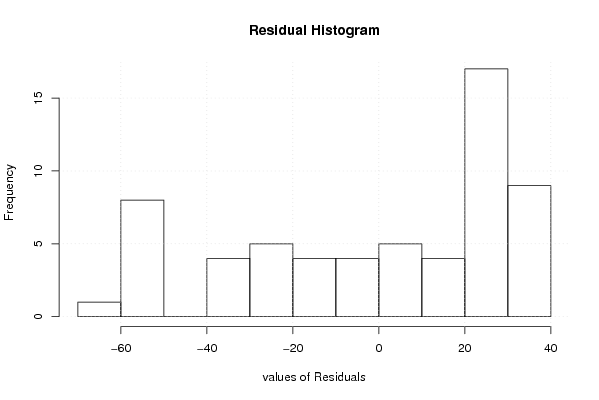
| Multiple Linear Regression - Residual Statistics | |
| Residual Standard Deviation | 34.8553494462629 |
| Sum Squared Residuals | 58314.9784810127 |
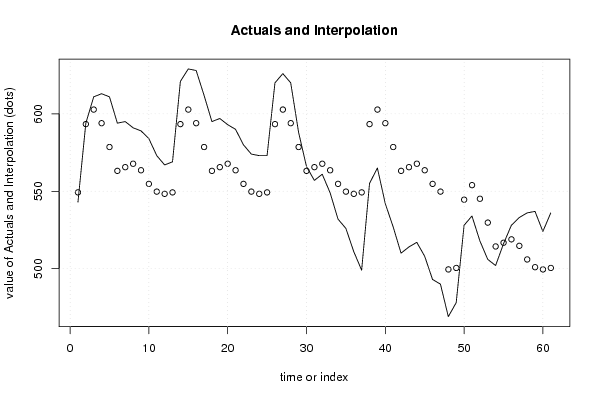
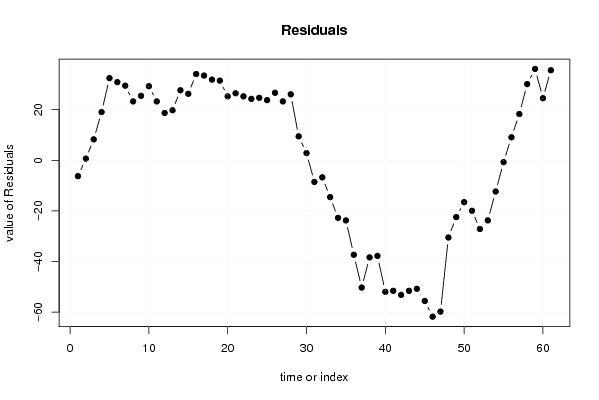
| Multiple Linear Regression - Actuals, Interpolation, and Residuals | |||
| Time or Index | Actuals | Interpolation Forecast | Residuals Prediction Error |
| 1 | 543 | 549.272151898736 | -6.27215189873589 |
| 2 | 594 | 593.36329113924 | 0.6367088607595 |
| 3 | 611 | 602.76329113924 | 8.23670886075943 |
| 4 | 613 | 593.96329113924 | 19.0367088607595 |
| 5 | 611 | 578.56329113924 | 32.4367088607595 |
| 6 | 594 | 563.16329113924 | 30.8367088607595 |
| 7 | 595 | 565.56329113924 | 29.4367088607595 |
| 8 | 591 | 567.76329113924 | 23.2367088607595 |
| 9 | 589 | 563.56329113924 | 25.4367088607595 |
| 10 | 584 | 554.76329113924 | 29.2367088607595 |
| 11 | 573 | 549.76329113924 | 23.2367088607595 |
| 12 | 567 | 548.326582278481 | 18.6734177215190 |
| 13 | 569 | 549.272151898734 | 19.7278481012662 |
| 14 | 621 | 593.36329113924 | 27.6367088607595 |
| 15 | 629 | 602.76329113924 | 26.2367088607595 |
| 16 | 628 | 593.96329113924 | 34.0367088607595 |
| 17 | 612 | 578.56329113924 | 33.4367088607595 |
| 18 | 595 | 563.16329113924 | 31.8367088607595 |
| 19 | 597 | 565.56329113924 | 31.4367088607595 |
| 20 | 593 | 567.76329113924 | 25.2367088607595 |
| 21 | 590 | 563.56329113924 | 26.4367088607595 |
| 22 | 580 | 554.76329113924 | 25.2367088607595 |
| 23 | 574 | 549.76329113924 | 24.2367088607595 |
| 24 | 573 | 548.326582278481 | 24.6734177215190 |
| 25 | 573 | 549.272151898734 | 23.7278481012662 |
| 26 | 620 | 593.36329113924 | 26.6367088607595 |
| 27 | 626 | 602.76329113924 | 23.2367088607595 |
| 28 | 620 | 593.96329113924 | 26.0367088607595 |
| 29 | 588 | 578.56329113924 | 9.4367088607595 |
| 30 | 566 | 563.16329113924 | 2.83670886075950 |
| 31 | 557 | 565.56329113924 | -8.5632911392405 |
| 32 | 561 | 567.76329113924 | -6.76329113924049 |
| 33 | 549 | 563.56329113924 | -14.5632911392405 |
| 34 | 532 | 554.76329113924 | -22.7632911392405 |
| 35 | 526 | 549.76329113924 | -23.7632911392405 |
| 36 | 511 | 548.326582278481 | -37.326582278481 |
| 37 | 499 | 549.272151898734 | -50.2721518987338 |
| 38 | 555 | 593.36329113924 | -38.3632911392405 |
| 39 | 565 | 602.76329113924 | -37.7632911392405 |
| 40 | 542 | 593.96329113924 | -51.9632911392405 |
| 41 | 527 | 578.56329113924 | -51.5632911392405 |
| 42 | 510 | 563.16329113924 | -53.1632911392405 |
| 43 | 514 | 565.56329113924 | -51.5632911392405 |
| 44 | 517 | 567.76329113924 | -50.7632911392405 |
| 45 | 508 | 563.56329113924 | -55.5632911392405 |
| 46 | 493 | 554.76329113924 | -61.7632911392405 |
| 47 | 490 | 549.76329113924 | -59.7632911392405 |
| 48 | 469 | 499.510126582279 | -30.5101265822785 |
| 49 | 478 | 500.455696202531 | -22.4556962025313 |
| 50 | 528 | 544.546835443038 | -16.546835443038 |
| 51 | 534 | 553.946835443038 | -19.9468354430380 |
| 52 | 518 | 545.146835443038 | -27.1468354430380 |
| 53 | 506 | 529.746835443038 | -23.7468354430380 |
| 54 | 502 | 514.346835443038 | -12.3468354430380 |
| 55 | 516 | 516.746835443038 | -0.746835443038022 |
| 56 | 528 | 518.946835443038 | 9.05316455696198 |
| 57 | 533 | 514.746835443038 | 18.253164556962 |
| 58 | 536 | 505.946835443038 | 30.0531645569620 |
| 59 | 537 | 500.946835443038 | 36.053164556962 |
| 60 | 524 | 499.510126582279 | 24.4898734177215 |
| 61 | 536 | 500.455696202531 | 35.5443037974686 |
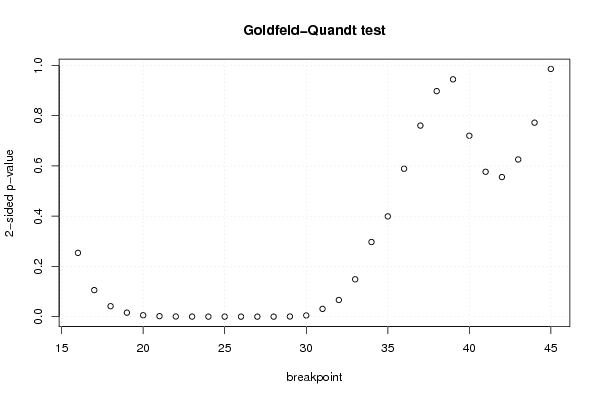
| Goldfeld-Quandt test for Heteroskedasticity | |||
| p-values | Alternative Hypothesis | ||
| breakpoint index | greater | 2-sided | less |
| 16 | 0.127033487868323 | 0.254066975736646 | 0.872966512131677 |
| 17 | 0.0528231358280137 | 0.105646271656027 | 0.947176864171986 |
| 18 | 0.0208432336224651 | 0.0416864672449301 | 0.979156766377535 |
| 19 | 0.00801138951655168 | 0.0160227790331034 | 0.991988610483448 |
| 20 | 0.00284610917457617 | 0.00569221834915233 | 0.997153890825424 |
| 21 | 0.00100205409339170 | 0.00200410818678339 | 0.998997945906608 |
| 22 | 0.000361248924233579 | 0.000722497848467159 | 0.999638751075766 |
| 23 | 0.000123048130542147 | 0.000246096261084294 | 0.999876951869458 |
| 24 | 5.06523531574319e-05 | 0.000101304706314864 | 0.999949347646843 |
| 25 | 5.08076254960606e-05 | 0.000101615250992121 | 0.999949192374504 |
| 26 | 4.67070319199194e-05 | 9.34140638398389e-05 | 0.99995329296808 |
| 27 | 3.61050458323834e-05 | 7.22100916647668e-05 | 0.999963894954168 |
| 28 | 5.84154312178197e-05 | 0.000116830862435639 | 0.999941584568782 |
| 29 | 0.000360551838054588 | 0.000721103676109175 | 0.999639448161945 |
| 30 | 0.00241005650294787 | 0.00482011300589573 | 0.997589943497052 |
| 31 | 0.0155049911583652 | 0.0310099823167304 | 0.984495008841635 |
| 32 | 0.0332522575750782 | 0.0665045151501565 | 0.966747742424922 |
| 33 | 0.0743933208812975 | 0.148786641762595 | 0.925606679118703 |
| 34 | 0.148640787577965 | 0.297281575155930 | 0.851359212422035 |
| 35 | 0.199692056753496 | 0.399384113506992 | 0.800307943246504 |
| 36 | 0.294507973213609 | 0.589015946427219 | 0.70549202678639 |
| 37 | 0.380404540619725 | 0.760809081239449 | 0.619595459380275 |
| 38 | 0.449016042030111 | 0.898032084060222 | 0.550983957969889 |
| 39 | 0.52751909574456 | 0.94496180851088 | 0.47248090425544 |
| 40 | 0.639834197231778 | 0.720331605536445 | 0.360165802768222 |
| 41 | 0.711540803480342 | 0.576918393039315 | 0.288459196519658 |
| 42 | 0.722075239789891 | 0.555849520420219 | 0.277924760210109 |
| 43 | 0.687038100694656 | 0.625923798610687 | 0.312961899305344 |
| 44 | 0.613824950317476 | 0.772350099365049 | 0.386175049682524 |
| 45 | 0.493151073666961 | 0.986302147333923 | 0.506848926333039 |
| Meta Analysis of Goldfeld-Quandt test for Heteroskedasticity | |||
| Description | # significant tests | % significant tests | OK/NOK |
| 1% type I error level | 11 | 0.366666666666667 | NOK |
| 5% type I error level | 14 | 0.466666666666667 | NOK |
| 10% type I error level | 15 | 0.5 | NOK |