| Multiple Linear Regression - Estimated Regression Equation |
| Omzet[t] = + 69.4259210526316 + 2.7171052631579Uitvoer[t] + 9.73680921052626M1[t] + 11.0355921052631M2[t] + 25.214375M3[t] + 19.7297368421053M4[t] + 18.0919407894737M5[t] + 29.2438815789473M6[t] -1.65391447368423M7[t] -7.4717105263158M8[t] + 15.9636513157895M9[t] + 22.5790131578947M10[t] + 16.5212171052632M11[t] + 1.14121710526316t + e[t] |
| Multiple Linear Regression - Ordinary Least Squares | |||||
| Variable | Parameter | S.D. | T-STAT H0: parameter = 0 | 2-tail p-value | 1-tail p-value |
| (Intercept) | 69.4259210526316 | 7.656133 | 9.068 | 0 | 0 |
| Uitvoer | 2.7171052631579 | 6.394931 | 0.4249 | 0.672902 | 0.336451 |
| M1 | 9.73680921052626 | 9.187627 | 1.0598 | 0.294781 | 0.14739 |
| M2 | 11.0355921052631 | 9.170611 | 1.2034 | 0.234992 | 0.117496 |
| M3 | 25.214375 | 9.157078 | 2.7535 | 0.008413 | 0.004206 |
| M4 | 19.7297368421053 | 9.216329 | 2.1407 | 0.037628 | 0.018814 |
| M5 | 18.0919407894737 | 9.140523 | 1.9793 | 0.053784 | 0.026892 |
| M6 | 29.2438815789473 | 9.373174 | 3.12 | 0.00312 | 0.00156 |
| M7 | -1.65391447368423 | 9.147976 | -0.1808 | 0.857322 | 0.428661 |
| M8 | -7.4717105263158 | 9.142076 | -0.8173 | 0.417977 | 0.208988 |
| M9 | 15.9636513157895 | 9.119786 | 1.7504 | 0.08671 | 0.043355 |
| M10 | 22.5790131578947 | 9.239718 | 2.4437 | 0.018433 | 0.009216 |
| M11 | 16.5212171052632 | 9.105658 | 1.8144 | 0.076142 | 0.038071 |
| t | 1.14121710526316 | 0.179405 | 6.3611 | 0 | 0 |
| Multiple Linear Regression - Regression Statistics | |
| Multiple R | 0.878199108374596 |
| R-squared | 0.771233673949935 |
| Adjusted R-squared | 0.706582320935786 |
| F-TEST (value) | 11.9291188504771 |
| F-TEST (DF numerator) | 13 |
| F-TEST (DF denominator) | 46 |
| p-value | 1.04085629004658e-10 |
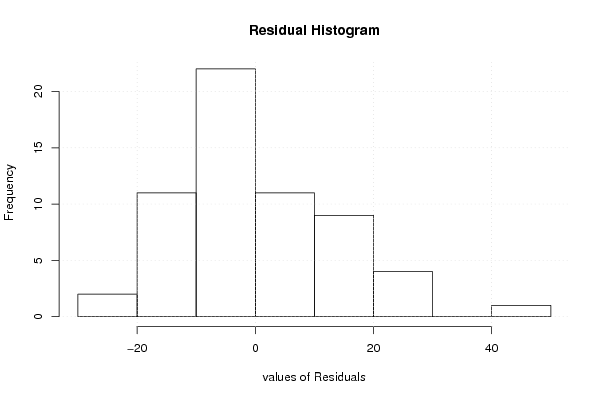
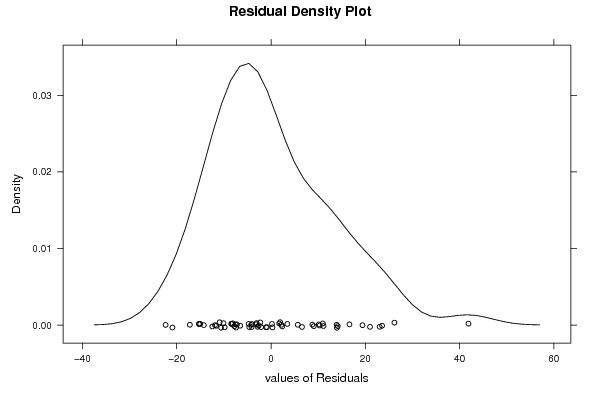
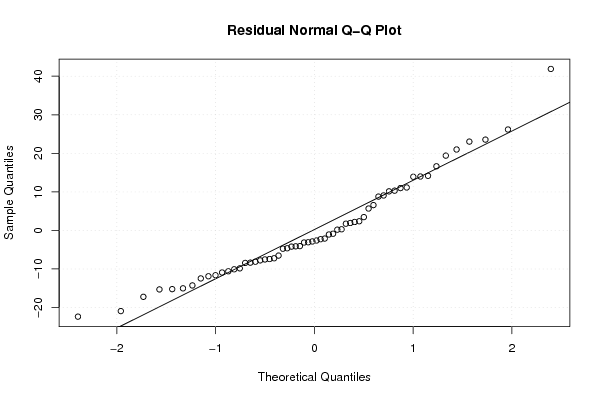
| Multiple Linear Regression - Residual Statistics | |
| Residual Standard Deviation | 14.3945146815591 |
| Sum Squared Residuals | 9531.29443421052 |
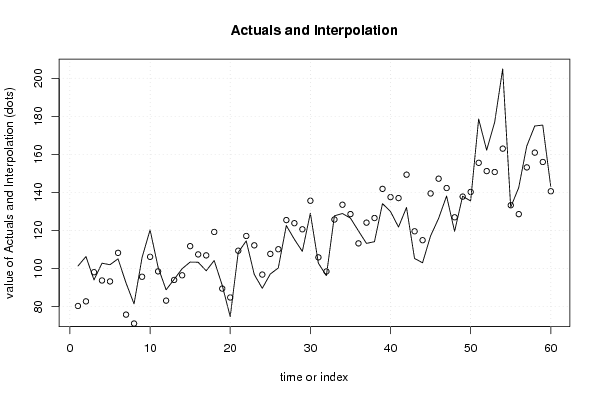
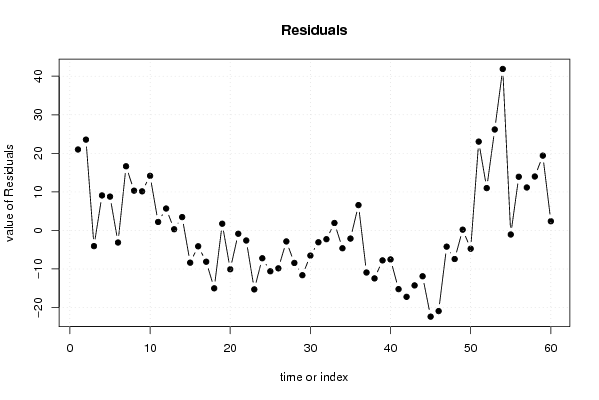
| Multiple Linear Regression - Actuals, Interpolation, and Residuals | |||
| Time or Index | Actuals | Interpolation Forecast | Residuals Prediction Error |
| 1 | 101.3 | 80.3039473684212 | 20.9960526315788 |
| 2 | 106.3 | 82.743947368421 | 23.556052631579 |
| 3 | 94 | 98.063947368421 | -4.06394736842103 |
| 4 | 102.8 | 93.7205263157895 | 9.07947368421052 |
| 5 | 102 | 93.223947368421 | 8.77605263157896 |
| 6 | 105.1 | 108.234210526316 | -3.13421052631583 |
| 7 | 92.4 | 75.7605263157895 | 16.6394736842105 |
| 8 | 81.4 | 71.083947368421 | 10.3160526315790 |
| 9 | 105.8 | 95.6605263157895 | 10.1394736842105 |
| 10 | 120.3 | 106.134210526316 | 14.1657894736842 |
| 11 | 100.7 | 98.5005263157895 | 2.19947368421053 |
| 12 | 88.8 | 83.1205263157895 | 5.67947368421054 |
| 13 | 94.3 | 93.998552631579 | 0.301447368421092 |
| 14 | 99.9 | 96.438552631579 | 3.46144736842105 |
| 15 | 103.4 | 111.758552631579 | -8.35855263157894 |
| 16 | 103.3 | 107.415131578947 | -4.11513157894737 |
| 17 | 98.8 | 106.918552631579 | -8.11855263157896 |
| 18 | 104.2 | 119.211710526316 | -15.0117105263158 |
| 19 | 91.2 | 89.4551315789474 | 1.74486842105265 |
| 20 | 74.7 | 84.778552631579 | -10.0785526315789 |
| 21 | 108.5 | 109.355131578947 | -0.855131578947372 |
| 22 | 114.5 | 117.111710526316 | -2.61171052631578 |
| 23 | 96.9 | 112.195131578947 | -15.2951315789474 |
| 24 | 89.6 | 96.8151315789474 | -7.21513157894738 |
| 25 | 97.1 | 107.693157894737 | -10.5931578947368 |
| 26 | 100.3 | 110.133157894737 | -9.83315789473684 |
| 27 | 122.6 | 125.453157894737 | -2.85315789473685 |
| 28 | 115.4 | 123.826842105263 | -8.42684210526314 |
| 29 | 109 | 120.613157894737 | -11.6131578947368 |
| 30 | 129.1 | 135.623421052632 | -6.52342105263157 |
| 31 | 102.8 | 105.866842105263 | -3.06684210526315 |
| 32 | 96.2 | 98.4731578947369 | -2.27315789473685 |
| 33 | 127.7 | 125.766842105263 | 1.93315789473684 |
| 34 | 128.9 | 133.523421052632 | -4.62342105263158 |
| 35 | 126.5 | 128.606842105263 | -2.10684210526316 |
| 36 | 119.8 | 113.226842105263 | 6.57315789473683 |
| 37 | 113.2 | 124.104868421053 | -10.9048684210526 |
| 38 | 114.1 | 126.544868421053 | -12.4448684210526 |
| 39 | 134.1 | 141.864868421053 | -7.76486842105265 |
| 40 | 130 | 137.521447368421 | -7.52144736842104 |
| 41 | 121.8 | 137.024868421053 | -15.2248684210526 |
| 42 | 132.1 | 149.318026315789 | -17.2180263157895 |
| 43 | 105.3 | 119.561447368421 | -14.2614473684211 |
| 44 | 103 | 114.884868421053 | -11.8848684210527 |
| 45 | 117.1 | 139.461447368421 | -22.3614473684211 |
| 46 | 126.3 | 147.218026315789 | -20.9180263157895 |
| 47 | 138.1 | 142.301447368421 | -4.20144736842106 |
| 48 | 119.5 | 126.921447368421 | -7.42144736842106 |
| 49 | 138 | 137.799473684210 | 0.200526315789507 |
| 50 | 135.5 | 140.239473684211 | -4.73947368421053 |
| 51 | 178.6 | 155.559473684211 | 23.0405263157895 |
| 52 | 162.2 | 151.216052631579 | 10.9839473684210 |
| 53 | 176.9 | 150.719473684211 | 26.1805263157895 |
| 54 | 204.9 | 163.012631578947 | 41.8873684210526 |
| 55 | 132.2 | 133.256052631579 | -1.05605263157896 |
| 56 | 142.5 | 128.579473684211 | 13.9205263157895 |
| 57 | 164.3 | 153.156052631579 | 11.1439473684211 |
| 58 | 174.9 | 160.912631578947 | 13.9873684210526 |
| 59 | 175.4 | 155.996052631579 | 19.4039473684211 |
| 60 | 143 | 140.616052631579 | 2.38394736842104 |
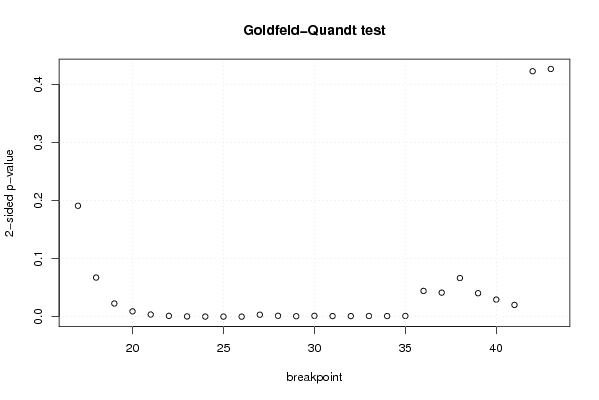
| Goldfeld-Quandt test for Heteroskedasticity | |||
| p-values | Alternative Hypothesis | ||
| breakpoint index | greater | 2-sided | less |
| 17 | 0.095485951931507 | 0.190971903863014 | 0.904514048068493 |
| 18 | 0.0336619457870656 | 0.0673238915741311 | 0.966338054212935 |
| 19 | 0.0113212257780773 | 0.0226424515561546 | 0.988678774221923 |
| 20 | 0.00456502298296293 | 0.00913004596592585 | 0.995434977017037 |
| 21 | 0.00184566097187101 | 0.00369132194374201 | 0.99815433902813 |
| 22 | 0.000674315990673293 | 0.00134863198134659 | 0.999325684009327 |
| 23 | 0.000197948343236005 | 0.000395896686472011 | 0.999802051656764 |
| 24 | 5.52006808433995e-05 | 0.000110401361686799 | 0.999944799319157 |
| 25 | 1.35594276635181e-05 | 2.71188553270361e-05 | 0.999986440572336 |
| 26 | 3.20813177835689e-06 | 6.41626355671378e-06 | 0.999996791868222 |
| 27 | 0.00166747032661439 | 0.00333494065322877 | 0.998332529673386 |
| 28 | 0.000734268213903925 | 0.00146853642780785 | 0.999265731786096 |
| 29 | 0.000370697082947868 | 0.000741394165895736 | 0.999629302917052 |
| 30 | 0.000711071799560891 | 0.00142214359912178 | 0.99928892820044 |
| 31 | 0.00049130586242005 | 0.0009826117248401 | 0.99950869413758 |
| 32 | 0.000463387276866277 | 0.000926774553732553 | 0.999536612723134 |
| 33 | 0.000580925908628456 | 0.00116185181725691 | 0.999419074091372 |
| 34 | 0.000509959116617443 | 0.00101991823323489 | 0.999490040883383 |
| 35 | 0.000617402399788 | 0.001234804799576 | 0.999382597600212 |
| 36 | 0.0221626625196755 | 0.0443253250393511 | 0.977837337480324 |
| 37 | 0.0206910576958606 | 0.0413821153917213 | 0.97930894230414 |
| 38 | 0.0332434089604381 | 0.0664868179208762 | 0.966756591039562 |
| 39 | 0.0201748534168948 | 0.0403497068337896 | 0.979825146583105 |
| 40 | 0.0146974187154036 | 0.0293948374308072 | 0.985302581284596 |
| 41 | 0.010103405518916 | 0.020206811037832 | 0.989896594481084 |
| 42 | 0.211315558121126 | 0.422631116242252 | 0.788684441878874 |
| 43 | 0.213279777283600 | 0.426559554567201 | 0.7867202227164 |
| Meta Analysis of Goldfeld-Quandt test for Heteroskedasticity | |||
| Description | # significant tests | % significant tests | OK/NOK |
| 1% type I error level | 16 | 0.592592592592593 | NOK |
| 5% type I error level | 22 | 0.814814814814815 | NOK |
| 10% type I error level | 24 | 0.888888888888889 | NOK |