Free Statistics

of Irreproducible Research!

Author's title

Author*The author of this computation has been verified*
R Software Modulerwasp_autocorrelation.wasp
Title produced by software(Partial) Autocorrelation Function
Date of computationFri, 27 Nov 2009 02:59:55 -0700
Cite this page as followsStatistical Computations at FreeStatistics.org, Office for Research Development and Education, URL https://freestatistics.org/blog/index.php?v=date/2009/Nov/27/t1259316091ud70lx4ftmrwdtx.htm/, Retrieved Mon, 29 Apr 2024 22:42:15 +0000
Statistical Computations at FreeStatistics.org, Office for Research Development and Education, URL https://freestatistics.org/blog/index.php?pk=60518, Retrieved Mon, 29 Apr 2024 22:42:15 +0000
QR Codes:

Original text written by user:
IsPrivate?No (this computation is public)
User-defined keywords
Estimated Impact124
Family? (F = Feedback message, R = changed R code, M = changed R Module, P = changed Parameters, D = changed Data)
-       [(Partial) Autocorrelation Function] [ws8 module2] [2009-11-27 09:59:55] [b243db81ea3e1f02fb3382887fb0f701] [Current]
Feedback Forum

Post a new message
Dataseries X:
29571
30167
30524
30996
31033
31198
30937
31649
33115
34106
33926
33382
32851
32948
36112
36113
35210
35193
34383
35349
37058
38076
36630
36045
35638
35114
35465
35254
35299
35916
36683
37288
38536
38977
36407
34955
34951
32680
34791
34178
35213
34871
35299
35443
37108
36419
34471
33868
34385
33643
34627
32919
35500
36110
37086
37711
40427
39884
38512
38767


Summary of computational transaction
Raw Inputview raw input (R code)
Raw Outputview raw output of R engine
Computing time1 seconds
R Server'Gwilym Jenkins' @ 72.249.127.135

\begin{tabular}{lllllllll}
\hline
Summary of computational transaction \tabularnewline
Raw Input & view raw input (R code)  \tabularnewline
Raw Output & view raw output of R engine  \tabularnewline
Computing time & 1 seconds \tabularnewline
R Server & 'Gwilym Jenkins' @ 72.249.127.135 \tabularnewline
\hline
\end{tabular}
%Source: https://freestatistics.org/blog/index.php?pk=60518&T=0

[TABLE]
[ROW][C]Summary of computational transaction[/C][/ROW]
[ROW][C]Raw Input[/C][C]view raw input (R code) [/C][/ROW]
[ROW][C]Raw Output[/C][C]view raw output of R engine [/C][/ROW]
[ROW][C]Computing time[/C][C]1 seconds[/C][/ROW]
[ROW][C]R Server[/C][C]'Gwilym Jenkins' @ 72.249.127.135[/C][/ROW]
[/TABLE]
Source: https://freestatistics.org/blog/index.php?pk=60518&T=0

Globally Unique Identifier (entire table): ba.freestatistics.org/blog/index.php?pk=60518&T=0

As an alternative you can also use a QR Code:  

The GUIDs for individual cells are displayed in the table below:

Summary of computational transaction
Raw Inputview raw input (R code)
Raw Outputview raw output of R engine
Computing time1 seconds
R Server'Gwilym Jenkins' @ 72.249.127.135


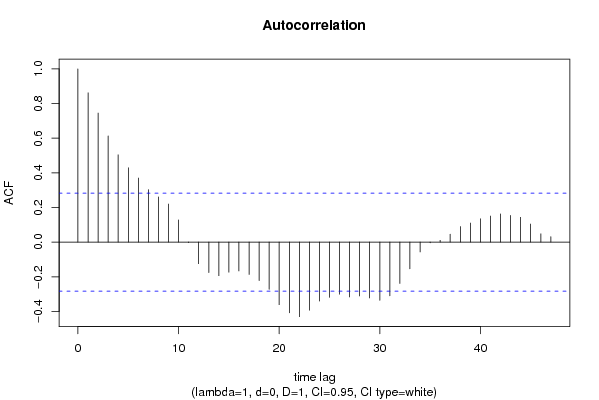
Autocorrelation Function
Time lag kACF(k)T-STATP-value
10.8619515.97180
20.7450845.16212e-06
30.6131054.24774.9e-05
40.5044753.49510.000515
50.4292312.97380.002295
60.3697162.56150.00681
70.3027392.09740.020623
80.2612521.810.038279
90.219431.52030.067504
100.1281430.88780.189538
11-0.002824-0.01960.492237
12-0.124594-0.86320.196157
13-0.175621-1.21670.114826
14-0.194087-1.34470.092525
15-0.173938-1.20510.11704
16-0.166253-1.15180.127548
17-0.18663-1.2930.101099
18-0.221975-1.53790.065321
19-0.272362-1.8870.032609
20-0.361168-2.50220.007901
21-0.408012-2.82680.003418
22-0.430358-2.98160.002247
23-0.392887-2.7220.004508
24-0.340653-2.36010.011191
25-0.318574-2.20710.016059
26-0.300669-2.08310.021296
27-0.316826-2.1950.016515
28-0.310423-2.15070.018283
29-0.322542-2.23460.015066
30-0.336221-2.32940.012046
31-0.309781-2.14620.018469
32-0.238578-1.65290.052438
33-0.153956-1.06660.145736
34-0.056358-0.39050.348963
35-0.004319-0.02990.488125
360.0102040.07070.471967
370.0460360.31890.375575
380.0901260.62440.267658
390.1100460.76240.224771
400.1344360.93140.178153
410.1504681.04250.151208
420.1627891.12780.132498
430.1539021.06630.145819
440.1430860.99130.163247
450.1041240.72140.237085
460.0478490.33150.370852
470.0314170.21770.414306
48NANANA

\begin{tabular}{lllllllll}
\hline
Autocorrelation Function \tabularnewline
Time lag k & ACF(k) & T-STAT & P-value \tabularnewline
1 & 0.861951 & 5.9718 & 0 \tabularnewline
2 & 0.745084 & 5.1621 & 2e-06 \tabularnewline
3 & 0.613105 & 4.2477 & 4.9e-05 \tabularnewline
4 & 0.504475 & 3.4951 & 0.000515 \tabularnewline
5 & 0.429231 & 2.9738 & 0.002295 \tabularnewline
6 & 0.369716 & 2.5615 & 0.00681 \tabularnewline
7 & 0.302739 & 2.0974 & 0.020623 \tabularnewline
8 & 0.261252 & 1.81 & 0.038279 \tabularnewline
9 & 0.21943 & 1.5203 & 0.067504 \tabularnewline
10 & 0.128143 & 0.8878 & 0.189538 \tabularnewline
11 & -0.002824 & -0.0196 & 0.492237 \tabularnewline
12 & -0.124594 & -0.8632 & 0.196157 \tabularnewline
13 & -0.175621 & -1.2167 & 0.114826 \tabularnewline
14 & -0.194087 & -1.3447 & 0.092525 \tabularnewline
15 & -0.173938 & -1.2051 & 0.11704 \tabularnewline
16 & -0.166253 & -1.1518 & 0.127548 \tabularnewline
17 & -0.18663 & -1.293 & 0.101099 \tabularnewline
18 & -0.221975 & -1.5379 & 0.065321 \tabularnewline
19 & -0.272362 & -1.887 & 0.032609 \tabularnewline
20 & -0.361168 & -2.5022 & 0.007901 \tabularnewline
21 & -0.408012 & -2.8268 & 0.003418 \tabularnewline
22 & -0.430358 & -2.9816 & 0.002247 \tabularnewline
23 & -0.392887 & -2.722 & 0.004508 \tabularnewline
24 & -0.340653 & -2.3601 & 0.011191 \tabularnewline
25 & -0.318574 & -2.2071 & 0.016059 \tabularnewline
26 & -0.300669 & -2.0831 & 0.021296 \tabularnewline
27 & -0.316826 & -2.195 & 0.016515 \tabularnewline
28 & -0.310423 & -2.1507 & 0.018283 \tabularnewline
29 & -0.322542 & -2.2346 & 0.015066 \tabularnewline
30 & -0.336221 & -2.3294 & 0.012046 \tabularnewline
31 & -0.309781 & -2.1462 & 0.018469 \tabularnewline
32 & -0.238578 & -1.6529 & 0.052438 \tabularnewline
33 & -0.153956 & -1.0666 & 0.145736 \tabularnewline
34 & -0.056358 & -0.3905 & 0.348963 \tabularnewline
35 & -0.004319 & -0.0299 & 0.488125 \tabularnewline
36 & 0.010204 & 0.0707 & 0.471967 \tabularnewline
37 & 0.046036 & 0.3189 & 0.375575 \tabularnewline
38 & 0.090126 & 0.6244 & 0.267658 \tabularnewline
39 & 0.110046 & 0.7624 & 0.224771 \tabularnewline
40 & 0.134436 & 0.9314 & 0.178153 \tabularnewline
41 & 0.150468 & 1.0425 & 0.151208 \tabularnewline
42 & 0.162789 & 1.1278 & 0.132498 \tabularnewline
43 & 0.153902 & 1.0663 & 0.145819 \tabularnewline
44 & 0.143086 & 0.9913 & 0.163247 \tabularnewline
45 & 0.104124 & 0.7214 & 0.237085 \tabularnewline
46 & 0.047849 & 0.3315 & 0.370852 \tabularnewline
47 & 0.031417 & 0.2177 & 0.414306 \tabularnewline
48 & NA & NA & NA \tabularnewline
\hline
\end{tabular}
%Source: https://freestatistics.org/blog/index.php?pk=60518&T=1

[TABLE]
[ROW][C]Autocorrelation Function[/C][/ROW]
[ROW][C]Time lag k[/C][C]ACF(k)[/C][C]T-STAT[/C][C]P-value[/C][/ROW]
[ROW][C]1[/C][C]0.861951[/C][C]5.9718[/C][C]0[/C][/ROW]
[ROW][C]2[/C][C]0.745084[/C][C]5.1621[/C][C]2e-06[/C][/ROW]
[ROW][C]3[/C][C]0.613105[/C][C]4.2477[/C][C]4.9e-05[/C][/ROW]
[ROW][C]4[/C][C]0.504475[/C][C]3.4951[/C][C]0.000515[/C][/ROW]
[ROW][C]5[/C][C]0.429231[/C][C]2.9738[/C][C]0.002295[/C][/ROW]
[ROW][C]6[/C][C]0.369716[/C][C]2.5615[/C][C]0.00681[/C][/ROW]
[ROW][C]7[/C][C]0.302739[/C][C]2.0974[/C][C]0.020623[/C][/ROW]
[ROW][C]8[/C][C]0.261252[/C][C]1.81[/C][C]0.038279[/C][/ROW]
[ROW][C]9[/C][C]0.21943[/C][C]1.5203[/C][C]0.067504[/C][/ROW]
[ROW][C]10[/C][C]0.128143[/C][C]0.8878[/C][C]0.189538[/C][/ROW]
[ROW][C]11[/C][C]-0.002824[/C][C]-0.0196[/C][C]0.492237[/C][/ROW]
[ROW][C]12[/C][C]-0.124594[/C][C]-0.8632[/C][C]0.196157[/C][/ROW]
[ROW][C]13[/C][C]-0.175621[/C][C]-1.2167[/C][C]0.114826[/C][/ROW]
[ROW][C]14[/C][C]-0.194087[/C][C]-1.3447[/C][C]0.092525[/C][/ROW]
[ROW][C]15[/C][C]-0.173938[/C][C]-1.2051[/C][C]0.11704[/C][/ROW]
[ROW][C]16[/C][C]-0.166253[/C][C]-1.1518[/C][C]0.127548[/C][/ROW]
[ROW][C]17[/C][C]-0.18663[/C][C]-1.293[/C][C]0.101099[/C][/ROW]
[ROW][C]18[/C][C]-0.221975[/C][C]-1.5379[/C][C]0.065321[/C][/ROW]
[ROW][C]19[/C][C]-0.272362[/C][C]-1.887[/C][C]0.032609[/C][/ROW]
[ROW][C]20[/C][C]-0.361168[/C][C]-2.5022[/C][C]0.007901[/C][/ROW]
[ROW][C]21[/C][C]-0.408012[/C][C]-2.8268[/C][C]0.003418[/C][/ROW]
[ROW][C]22[/C][C]-0.430358[/C][C]-2.9816[/C][C]0.002247[/C][/ROW]
[ROW][C]23[/C][C]-0.392887[/C][C]-2.722[/C][C]0.004508[/C][/ROW]
[ROW][C]24[/C][C]-0.340653[/C][C]-2.3601[/C][C]0.011191[/C][/ROW]
[ROW][C]25[/C][C]-0.318574[/C][C]-2.2071[/C][C]0.016059[/C][/ROW]
[ROW][C]26[/C][C]-0.300669[/C][C]-2.0831[/C][C]0.021296[/C][/ROW]
[ROW][C]27[/C][C]-0.316826[/C][C]-2.195[/C][C]0.016515[/C][/ROW]
[ROW][C]28[/C][C]-0.310423[/C][C]-2.1507[/C][C]0.018283[/C][/ROW]
[ROW][C]29[/C][C]-0.322542[/C][C]-2.2346[/C][C]0.015066[/C][/ROW]
[ROW][C]30[/C][C]-0.336221[/C][C]-2.3294[/C][C]0.012046[/C][/ROW]
[ROW][C]31[/C][C]-0.309781[/C][C]-2.1462[/C][C]0.018469[/C][/ROW]
[ROW][C]32[/C][C]-0.238578[/C][C]-1.6529[/C][C]0.052438[/C][/ROW]
[ROW][C]33[/C][C]-0.153956[/C][C]-1.0666[/C][C]0.145736[/C][/ROW]
[ROW][C]34[/C][C]-0.056358[/C][C]-0.3905[/C][C]0.348963[/C][/ROW]
[ROW][C]35[/C][C]-0.004319[/C][C]-0.0299[/C][C]0.488125[/C][/ROW]
[ROW][C]36[/C][C]0.010204[/C][C]0.0707[/C][C]0.471967[/C][/ROW]
[ROW][C]37[/C][C]0.046036[/C][C]0.3189[/C][C]0.375575[/C][/ROW]
[ROW][C]38[/C][C]0.090126[/C][C]0.6244[/C][C]0.267658[/C][/ROW]
[ROW][C]39[/C][C]0.110046[/C][C]0.7624[/C][C]0.224771[/C][/ROW]
[ROW][C]40[/C][C]0.134436[/C][C]0.9314[/C][C]0.178153[/C][/ROW]
[ROW][C]41[/C][C]0.150468[/C][C]1.0425[/C][C]0.151208[/C][/ROW]
[ROW][C]42[/C][C]0.162789[/C][C]1.1278[/C][C]0.132498[/C][/ROW]
[ROW][C]43[/C][C]0.153902[/C][C]1.0663[/C][C]0.145819[/C][/ROW]
[ROW][C]44[/C][C]0.143086[/C][C]0.9913[/C][C]0.163247[/C][/ROW]
[ROW][C]45[/C][C]0.104124[/C][C]0.7214[/C][C]0.237085[/C][/ROW]
[ROW][C]46[/C][C]0.047849[/C][C]0.3315[/C][C]0.370852[/C][/ROW]
[ROW][C]47[/C][C]0.031417[/C][C]0.2177[/C][C]0.414306[/C][/ROW]
[ROW][C]48[/C][C]NA[/C][C]NA[/C][C]NA[/C][/ROW]
[/TABLE]
Source: https://freestatistics.org/blog/index.php?pk=60518&T=1

Globally Unique Identifier (entire table): ba.freestatistics.org/blog/index.php?pk=60518&T=1

As an alternative you can also use a QR Code:  

The GUIDs for individual cells are displayed in the table below:

Autocorrelation Function
Time lag kACF(k)T-STATP-value
10.8619515.97180
20.7450845.16212e-06
30.6131054.24774.9e-05
40.5044753.49510.000515
50.4292312.97380.002295
60.3697162.56150.00681
70.3027392.09740.020623
80.2612521.810.038279
90.219431.52030.067504
100.1281430.88780.189538
11-0.002824-0.01960.492237
12-0.124594-0.86320.196157
13-0.175621-1.21670.114826
14-0.194087-1.34470.092525
15-0.173938-1.20510.11704
16-0.166253-1.15180.127548
17-0.18663-1.2930.101099
18-0.221975-1.53790.065321
19-0.272362-1.8870.032609
20-0.361168-2.50220.007901
21-0.408012-2.82680.003418
22-0.430358-2.98160.002247
23-0.392887-2.7220.004508
24-0.340653-2.36010.011191
25-0.318574-2.20710.016059
26-0.300669-2.08310.021296
27-0.316826-2.1950.016515
28-0.310423-2.15070.018283
29-0.322542-2.23460.015066
30-0.336221-2.32940.012046
31-0.309781-2.14620.018469
32-0.238578-1.65290.052438
33-0.153956-1.06660.145736
34-0.056358-0.39050.348963
35-0.004319-0.02990.488125
360.0102040.07070.471967
370.0460360.31890.375575
380.0901260.62440.267658
390.1100460.76240.224771
400.1344360.93140.178153
410.1504681.04250.151208
420.1627891.12780.132498
430.1539021.06630.145819
440.1430860.99130.163247
450.1041240.72140.237085
460.0478490.33150.370852
470.0314170.21770.414306
48NANANA


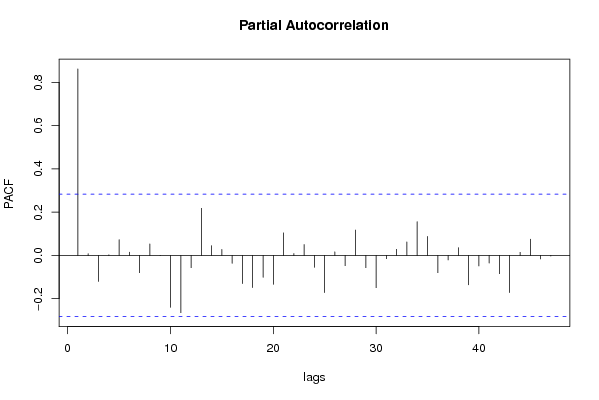
Partial Autocorrelation Function
Time lag kPACF(k)T-STATP-value
10.8619515.97180
20.0082650.05730.477286
3-0.12037-0.83390.204221
40.0027460.0190.492449
50.072750.5040.308273
60.0147880.10250.459412
7-0.079572-0.55130.291997
80.0534180.37010.356472
9-0.000724-0.0050.498009
10-0.239567-1.65980.051741
11-0.264508-1.83260.036537
12-0.056814-0.39360.347802
130.2178661.50940.068873
140.0449550.31150.378401
150.0277660.19240.424133
16-0.036436-0.25240.40089
17-0.130229-0.90230.185714
18-0.148293-1.02740.15469
19-0.100841-0.69860.244071
20-0.133621-0.92580.179602
210.1043350.72290.236638
220.0088430.06130.475701
230.0503830.34910.364285
24-0.055138-0.3820.35207
25-0.171608-1.18890.120157
260.0165210.11450.454674
27-0.047352-0.32810.372144
280.1173560.81310.210098
29-0.0566-0.39210.348346
30-0.14877-1.03070.153921
31-0.014773-0.10230.459453
320.0285420.19770.422041
330.0623490.4320.333849
340.1559351.08030.142692
350.087730.60780.27309
36-0.07985-0.55320.291341
37-0.020607-0.14280.443535
380.0360160.24950.40201
39-0.135588-0.93940.17612
40-0.04866-0.33710.368745
41-0.034995-0.24250.404732
42-0.084053-0.58230.281534
43-0.171791-1.19020.119911
440.0144880.10040.460232
450.0749910.51960.302881
46-0.016337-0.11320.455178
47-0.00299-0.02070.49178
48NANANA

\begin{tabular}{lllllllll}
\hline
Partial Autocorrelation Function \tabularnewline
Time lag k & PACF(k) & T-STAT & P-value \tabularnewline
1 & 0.861951 & 5.9718 & 0 \tabularnewline
2 & 0.008265 & 0.0573 & 0.477286 \tabularnewline
3 & -0.12037 & -0.8339 & 0.204221 \tabularnewline
4 & 0.002746 & 0.019 & 0.492449 \tabularnewline
5 & 0.07275 & 0.504 & 0.308273 \tabularnewline
6 & 0.014788 & 0.1025 & 0.459412 \tabularnewline
7 & -0.079572 & -0.5513 & 0.291997 \tabularnewline
8 & 0.053418 & 0.3701 & 0.356472 \tabularnewline
9 & -0.000724 & -0.005 & 0.498009 \tabularnewline
10 & -0.239567 & -1.6598 & 0.051741 \tabularnewline
11 & -0.264508 & -1.8326 & 0.036537 \tabularnewline
12 & -0.056814 & -0.3936 & 0.347802 \tabularnewline
13 & 0.217866 & 1.5094 & 0.068873 \tabularnewline
14 & 0.044955 & 0.3115 & 0.378401 \tabularnewline
15 & 0.027766 & 0.1924 & 0.424133 \tabularnewline
16 & -0.036436 & -0.2524 & 0.40089 \tabularnewline
17 & -0.130229 & -0.9023 & 0.185714 \tabularnewline
18 & -0.148293 & -1.0274 & 0.15469 \tabularnewline
19 & -0.100841 & -0.6986 & 0.244071 \tabularnewline
20 & -0.133621 & -0.9258 & 0.179602 \tabularnewline
21 & 0.104335 & 0.7229 & 0.236638 \tabularnewline
22 & 0.008843 & 0.0613 & 0.475701 \tabularnewline
23 & 0.050383 & 0.3491 & 0.364285 \tabularnewline
24 & -0.055138 & -0.382 & 0.35207 \tabularnewline
25 & -0.171608 & -1.1889 & 0.120157 \tabularnewline
26 & 0.016521 & 0.1145 & 0.454674 \tabularnewline
27 & -0.047352 & -0.3281 & 0.372144 \tabularnewline
28 & 0.117356 & 0.8131 & 0.210098 \tabularnewline
29 & -0.0566 & -0.3921 & 0.348346 \tabularnewline
30 & -0.14877 & -1.0307 & 0.153921 \tabularnewline
31 & -0.014773 & -0.1023 & 0.459453 \tabularnewline
32 & 0.028542 & 0.1977 & 0.422041 \tabularnewline
33 & 0.062349 & 0.432 & 0.333849 \tabularnewline
34 & 0.155935 & 1.0803 & 0.142692 \tabularnewline
35 & 0.08773 & 0.6078 & 0.27309 \tabularnewline
36 & -0.07985 & -0.5532 & 0.291341 \tabularnewline
37 & -0.020607 & -0.1428 & 0.443535 \tabularnewline
38 & 0.036016 & 0.2495 & 0.40201 \tabularnewline
39 & -0.135588 & -0.9394 & 0.17612 \tabularnewline
40 & -0.04866 & -0.3371 & 0.368745 \tabularnewline
41 & -0.034995 & -0.2425 & 0.404732 \tabularnewline
42 & -0.084053 & -0.5823 & 0.281534 \tabularnewline
43 & -0.171791 & -1.1902 & 0.119911 \tabularnewline
44 & 0.014488 & 0.1004 & 0.460232 \tabularnewline
45 & 0.074991 & 0.5196 & 0.302881 \tabularnewline
46 & -0.016337 & -0.1132 & 0.455178 \tabularnewline
47 & -0.00299 & -0.0207 & 0.49178 \tabularnewline
48 & NA & NA & NA \tabularnewline
\hline
\end{tabular}
%Source: https://freestatistics.org/blog/index.php?pk=60518&T=2

[TABLE]
[ROW][C]Partial Autocorrelation Function[/C][/ROW]
[ROW][C]Time lag k[/C][C]PACF(k)[/C][C]T-STAT[/C][C]P-value[/C][/ROW]
[ROW][C]1[/C][C]0.861951[/C][C]5.9718[/C][C]0[/C][/ROW]
[ROW][C]2[/C][C]0.008265[/C][C]0.0573[/C][C]0.477286[/C][/ROW]
[ROW][C]3[/C][C]-0.12037[/C][C]-0.8339[/C][C]0.204221[/C][/ROW]
[ROW][C]4[/C][C]0.002746[/C][C]0.019[/C][C]0.492449[/C][/ROW]
[ROW][C]5[/C][C]0.07275[/C][C]0.504[/C][C]0.308273[/C][/ROW]
[ROW][C]6[/C][C]0.014788[/C][C]0.1025[/C][C]0.459412[/C][/ROW]
[ROW][C]7[/C][C]-0.079572[/C][C]-0.5513[/C][C]0.291997[/C][/ROW]
[ROW][C]8[/C][C]0.053418[/C][C]0.3701[/C][C]0.356472[/C][/ROW]
[ROW][C]9[/C][C]-0.000724[/C][C]-0.005[/C][C]0.498009[/C][/ROW]
[ROW][C]10[/C][C]-0.239567[/C][C]-1.6598[/C][C]0.051741[/C][/ROW]
[ROW][C]11[/C][C]-0.264508[/C][C]-1.8326[/C][C]0.036537[/C][/ROW]
[ROW][C]12[/C][C]-0.056814[/C][C]-0.3936[/C][C]0.347802[/C][/ROW]
[ROW][C]13[/C][C]0.217866[/C][C]1.5094[/C][C]0.068873[/C][/ROW]
[ROW][C]14[/C][C]0.044955[/C][C]0.3115[/C][C]0.378401[/C][/ROW]
[ROW][C]15[/C][C]0.027766[/C][C]0.1924[/C][C]0.424133[/C][/ROW]
[ROW][C]16[/C][C]-0.036436[/C][C]-0.2524[/C][C]0.40089[/C][/ROW]
[ROW][C]17[/C][C]-0.130229[/C][C]-0.9023[/C][C]0.185714[/C][/ROW]
[ROW][C]18[/C][C]-0.148293[/C][C]-1.0274[/C][C]0.15469[/C][/ROW]
[ROW][C]19[/C][C]-0.100841[/C][C]-0.6986[/C][C]0.244071[/C][/ROW]
[ROW][C]20[/C][C]-0.133621[/C][C]-0.9258[/C][C]0.179602[/C][/ROW]
[ROW][C]21[/C][C]0.104335[/C][C]0.7229[/C][C]0.236638[/C][/ROW]
[ROW][C]22[/C][C]0.008843[/C][C]0.0613[/C][C]0.475701[/C][/ROW]
[ROW][C]23[/C][C]0.050383[/C][C]0.3491[/C][C]0.364285[/C][/ROW]
[ROW][C]24[/C][C]-0.055138[/C][C]-0.382[/C][C]0.35207[/C][/ROW]
[ROW][C]25[/C][C]-0.171608[/C][C]-1.1889[/C][C]0.120157[/C][/ROW]
[ROW][C]26[/C][C]0.016521[/C][C]0.1145[/C][C]0.454674[/C][/ROW]
[ROW][C]27[/C][C]-0.047352[/C][C]-0.3281[/C][C]0.372144[/C][/ROW]
[ROW][C]28[/C][C]0.117356[/C][C]0.8131[/C][C]0.210098[/C][/ROW]
[ROW][C]29[/C][C]-0.0566[/C][C]-0.3921[/C][C]0.348346[/C][/ROW]
[ROW][C]30[/C][C]-0.14877[/C][C]-1.0307[/C][C]0.153921[/C][/ROW]
[ROW][C]31[/C][C]-0.014773[/C][C]-0.1023[/C][C]0.459453[/C][/ROW]
[ROW][C]32[/C][C]0.028542[/C][C]0.1977[/C][C]0.422041[/C][/ROW]
[ROW][C]33[/C][C]0.062349[/C][C]0.432[/C][C]0.333849[/C][/ROW]
[ROW][C]34[/C][C]0.155935[/C][C]1.0803[/C][C]0.142692[/C][/ROW]
[ROW][C]35[/C][C]0.08773[/C][C]0.6078[/C][C]0.27309[/C][/ROW]
[ROW][C]36[/C][C]-0.07985[/C][C]-0.5532[/C][C]0.291341[/C][/ROW]
[ROW][C]37[/C][C]-0.020607[/C][C]-0.1428[/C][C]0.443535[/C][/ROW]
[ROW][C]38[/C][C]0.036016[/C][C]0.2495[/C][C]0.40201[/C][/ROW]
[ROW][C]39[/C][C]-0.135588[/C][C]-0.9394[/C][C]0.17612[/C][/ROW]
[ROW][C]40[/C][C]-0.04866[/C][C]-0.3371[/C][C]0.368745[/C][/ROW]
[ROW][C]41[/C][C]-0.034995[/C][C]-0.2425[/C][C]0.404732[/C][/ROW]
[ROW][C]42[/C][C]-0.084053[/C][C]-0.5823[/C][C]0.281534[/C][/ROW]
[ROW][C]43[/C][C]-0.171791[/C][C]-1.1902[/C][C]0.119911[/C][/ROW]
[ROW][C]44[/C][C]0.014488[/C][C]0.1004[/C][C]0.460232[/C][/ROW]
[ROW][C]45[/C][C]0.074991[/C][C]0.5196[/C][C]0.302881[/C][/ROW]
[ROW][C]46[/C][C]-0.016337[/C][C]-0.1132[/C][C]0.455178[/C][/ROW]
[ROW][C]47[/C][C]-0.00299[/C][C]-0.0207[/C][C]0.49178[/C][/ROW]
[ROW][C]48[/C][C]NA[/C][C]NA[/C][C]NA[/C][/ROW]
[/TABLE]
Source: https://freestatistics.org/blog/index.php?pk=60518&T=2

Globally Unique Identifier (entire table): ba.freestatistics.org/blog/index.php?pk=60518&T=2

As an alternative you can also use a QR Code:  

The GUIDs for individual cells are displayed in the table below:

Partial Autocorrelation Function
Time lag kPACF(k)T-STATP-value
10.8619515.97180
20.0082650.05730.477286
3-0.12037-0.83390.204221
40.0027460.0190.492449
50.072750.5040.308273
60.0147880.10250.459412
7-0.079572-0.55130.291997
80.0534180.37010.356472
9-0.000724-0.0050.498009
10-0.239567-1.65980.051741
11-0.264508-1.83260.036537
12-0.056814-0.39360.347802
130.2178661.50940.068873
140.0449550.31150.378401
150.0277660.19240.424133
16-0.036436-0.25240.40089
17-0.130229-0.90230.185714
18-0.148293-1.02740.15469
19-0.100841-0.69860.244071
20-0.133621-0.92580.179602
210.1043350.72290.236638
220.0088430.06130.475701
230.0503830.34910.364285
24-0.055138-0.3820.35207
25-0.171608-1.18890.120157
260.0165210.11450.454674
27-0.047352-0.32810.372144
280.1173560.81310.210098
29-0.0566-0.39210.348346
30-0.14877-1.03070.153921
31-0.014773-0.10230.459453
320.0285420.19770.422041
330.0623490.4320.333849
340.1559351.08030.142692
350.087730.60780.27309
36-0.07985-0.55320.291341
37-0.020607-0.14280.443535
380.0360160.24950.40201
39-0.135588-0.93940.17612
40-0.04866-0.33710.368745
41-0.034995-0.24250.404732
42-0.084053-0.58230.281534
43-0.171791-1.19020.119911
440.0144880.10040.460232
450.0749910.51960.302881
46-0.016337-0.11320.455178
47-0.00299-0.02070.49178
48NANANA


Parameters (Session):
par1 = 48 ; par2 = 1 ; par3 = 0 ; par4 = 1 ; par5 = 12 ; par6 = White Noise ; par7 = 0.95 ;
Parameters (R input):
par1 = 48 ; par2 = 1 ; par3 = 0 ; par4 = 1 ; par5 = 12 ; par6 = White Noise ; par7 = 0.95 ;
R code (references can be found in the software module):
if (par1 == 'Default') {
par1 = 10*log10(length(x))
} else {
par1 <- as.numeric(par1)
}
par2 <- as.numeric(par2)
par3 <- as.numeric(par3)
par4 <- as.numeric(par4)
par5 <- as.numeric(par5)
if (par6 == 'White Noise') par6 <- 'white' else par6 <- 'ma'
par7 <- as.numeric(par7)
if (par2 == 0) {
x <- log(x)
} else {
x <- (x ^ par2 - 1) / par2
}
if (par3 > 0) x <- diff(x,lag=1,difference=par3)
if (par4 > 0) x <- diff(x,lag=par5,difference=par4)
bitmap(file='pic1.png')
racf <- acf(x, par1, main='Autocorrelation', xlab='time lag', ylab='ACF', ci.type=par6, ci=par7, sub=paste('(lambda=',par2,', d=',par3,', D=',par4,', CI=', par7, ', CI type=',par6,')',sep=''))
dev.off()
bitmap(file='pic2.png')
rpacf <- pacf(x,par1,main='Partial Autocorrelation',xlab='lags',ylab='PACF')
dev.off()
(myacf <- c(racf$acf))
(mypacf <- c(rpacf$acf))
lengthx <- length(x)
sqrtn <- sqrt(lengthx)
load(file='createtable')
a<-table.start()
a<-table.row.start(a)
a<-table.element(a,'Autocorrelation Function',4,TRUE)
a<-table.row.end(a)
a<-table.row.start(a)
a<-table.element(a,'Time lag k',header=TRUE)
a<-table.element(a,hyperlink('basics.htm','ACF(k)','click here for more information about the Autocorrelation Function'),header=TRUE)
a<-table.element(a,'T-STAT',header=TRUE)
a<-table.element(a,'P-value',header=TRUE)
a<-table.row.end(a)
for (i in 2:(par1+1)) {
a<-table.row.start(a)
a<-table.element(a,i-1,header=TRUE)
a<-table.element(a,round(myacf[i],6))
mytstat <- myacf[i]*sqrtn
a<-table.element(a,round(mytstat,4))
a<-table.element(a,round(1-pt(abs(mytstat),lengthx),6))
a<-table.row.end(a)
}
a<-table.end(a)
table.save(a,file='mytable.tab')
a<-table.start()
a<-table.row.start(a)
a<-table.element(a,'Partial Autocorrelation Function',4,TRUE)
a<-table.row.end(a)
a<-table.row.start(a)
a<-table.element(a,'Time lag k',header=TRUE)
a<-table.element(a,hyperlink('basics.htm','PACF(k)','click here for more information about the Partial Autocorrelation Function'),header=TRUE)
a<-table.element(a,'T-STAT',header=TRUE)
a<-table.element(a,'P-value',header=TRUE)
a<-table.row.end(a)
for (i in 1:par1) {
a<-table.row.start(a)
a<-table.element(a,i,header=TRUE)
a<-table.element(a,round(mypacf[i],6))
mytstat <- mypacf[i]*sqrtn
a<-table.element(a,round(mytstat,4))
a<-table.element(a,round(1-pt(abs(mytstat),lengthx),6))
a<-table.row.end(a)
}
a<-table.end(a)
table.save(a,file='mytable1.tab')