Free Statistics

of Irreproducible Research!

Author's title

Author*The author of this computation has been verified*
R Software Modulerwasp_autocorrelation.wasp
Title produced by software(Partial) Autocorrelation Function
Date of computationFri, 27 Nov 2009 01:35:59 -0700
Cite this page as followsStatistical Computations at FreeStatistics.org, Office for Research Development and Education, URL https://freestatistics.org/blog/index.php?v=date/2009/Nov/27/t12593110457oj9vjplddq80fx.htm/, Retrieved Mon, 29 Apr 2024 19:10:39 +0000
Statistical Computations at FreeStatistics.org, Office for Research Development and Education, URL https://freestatistics.org/blog/index.php?pk=60472, Retrieved Mon, 29 Apr 2024 19:10:39 +0000
QR Codes:

Original text written by user:
IsPrivate?No (this computation is public)
User-defined keywordsIntegration
Estimated Impact179
Family? (F = Feedback message, R = changed R code, M = changed R Module, P = changed Parameters, D = changed Data)
-       [(Partial) Autocorrelation Function] [Identifying Integ...] [2009-11-27 08:35:59] [64e929ed9a52e44aa31e1ff8e49d1c0b] [Current]
Feedback Forum

Post a new message
Dataseries X:
699.8
871.2
842.6
809.2
847.1
857
839.9
967.4
1037.2
1062.3
899.3
1129.6
845.7
1173.9
1073.8
1024.7
912.9
1055
936.4
920.6
1059.3
1164.1
823.9
1076.6
833.5
996
852.8
758.5
760.4
826.8
941.7
1097.8
802.8
839.7
791
1063.1
1138.4
888.6
931.1
863.2
936.2
701.7
873.8
696.8
658.1
706.7
458.5
685.7
660.1
774.9
787.4
486.9
310.8
619.5
550.2
463.4
630.4
729
485.6
453.7


Summary of computational transaction
Raw Inputview raw input (R code)
Raw Outputview raw output of R engine
Computing time1 seconds
R Server'Gwilym Jenkins' @ 72.249.127.135

\begin{tabular}{lllllllll}
\hline
Summary of computational transaction \tabularnewline
Raw Input & view raw input (R code)  \tabularnewline
Raw Output & view raw output of R engine  \tabularnewline
Computing time & 1 seconds \tabularnewline
R Server & 'Gwilym Jenkins' @ 72.249.127.135 \tabularnewline
\hline
\end{tabular}
%Source: https://freestatistics.org/blog/index.php?pk=60472&T=0

[TABLE]
[ROW][C]Summary of computational transaction[/C][/ROW]
[ROW][C]Raw Input[/C][C]view raw input (R code) [/C][/ROW]
[ROW][C]Raw Output[/C][C]view raw output of R engine [/C][/ROW]
[ROW][C]Computing time[/C][C]1 seconds[/C][/ROW]
[ROW][C]R Server[/C][C]'Gwilym Jenkins' @ 72.249.127.135[/C][/ROW]
[/TABLE]
Source: https://freestatistics.org/blog/index.php?pk=60472&T=0

Globally Unique Identifier (entire table): ba.freestatistics.org/blog/index.php?pk=60472&T=0

As an alternative you can also use a QR Code:  

The GUIDs for individual cells are displayed in the table below:

Summary of computational transaction
Raw Inputview raw input (R code)
Raw Outputview raw output of R engine
Computing time1 seconds
R Server'Gwilym Jenkins' @ 72.249.127.135


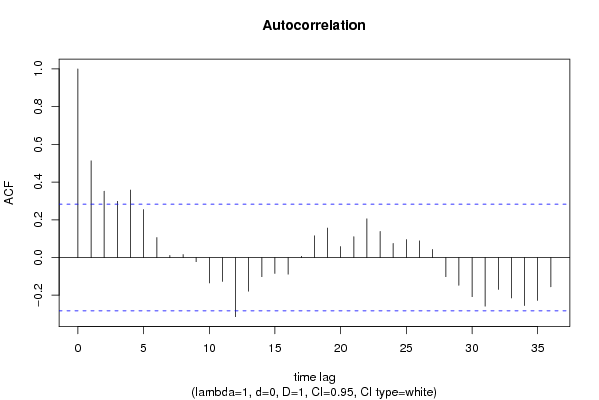
Autocorrelation Function
Time lag kACF(k)T-STATP-value
10.512663.55180.000435
20.3518332.43760.009271
30.2982732.06650.0221
40.3576332.47780.008396
50.2543571.76220.042198
60.1061490.73540.23283
70.0113020.07830.468956
80.0158340.10970.456552
9-0.022248-0.15410.439074
10-0.135085-0.93590.177006
11-0.126973-0.87970.191705
12-0.313631-2.17290.017378
13-0.178373-1.23580.111273
14-0.101795-0.70530.242031
15-0.084801-0.58750.279805
16-0.088591-0.61380.271131
170.0060920.04220.483256
180.1149620.79650.214838
190.1560911.08140.142454
200.0581360.40280.344451
210.1104070.76490.224031
220.205111.4210.080884
230.1385080.95960.171031
240.074390.51540.304323
250.094950.65780.256895
260.0882560.61150.271892
270.0425260.29460.384774
28-0.101738-0.70490.242152
29-0.147653-1.0230.155726
30-0.207911-1.44050.078115
31-0.258019-1.78760.040077
32-0.16911-1.17160.123565
33-0.214643-1.48710.071766
34-0.254958-1.76640.041844
35-0.227733-1.57780.060592
36-0.155466-1.07710.14341

\begin{tabular}{lllllllll}
\hline
Autocorrelation Function \tabularnewline
Time lag k & ACF(k) & T-STAT & P-value \tabularnewline
1 & 0.51266 & 3.5518 & 0.000435 \tabularnewline
2 & 0.351833 & 2.4376 & 0.009271 \tabularnewline
3 & 0.298273 & 2.0665 & 0.0221 \tabularnewline
4 & 0.357633 & 2.4778 & 0.008396 \tabularnewline
5 & 0.254357 & 1.7622 & 0.042198 \tabularnewline
6 & 0.106149 & 0.7354 & 0.23283 \tabularnewline
7 & 0.011302 & 0.0783 & 0.468956 \tabularnewline
8 & 0.015834 & 0.1097 & 0.456552 \tabularnewline
9 & -0.022248 & -0.1541 & 0.439074 \tabularnewline
10 & -0.135085 & -0.9359 & 0.177006 \tabularnewline
11 & -0.126973 & -0.8797 & 0.191705 \tabularnewline
12 & -0.313631 & -2.1729 & 0.017378 \tabularnewline
13 & -0.178373 & -1.2358 & 0.111273 \tabularnewline
14 & -0.101795 & -0.7053 & 0.242031 \tabularnewline
15 & -0.084801 & -0.5875 & 0.279805 \tabularnewline
16 & -0.088591 & -0.6138 & 0.271131 \tabularnewline
17 & 0.006092 & 0.0422 & 0.483256 \tabularnewline
18 & 0.114962 & 0.7965 & 0.214838 \tabularnewline
19 & 0.156091 & 1.0814 & 0.142454 \tabularnewline
20 & 0.058136 & 0.4028 & 0.344451 \tabularnewline
21 & 0.110407 & 0.7649 & 0.224031 \tabularnewline
22 & 0.20511 & 1.421 & 0.080884 \tabularnewline
23 & 0.138508 & 0.9596 & 0.171031 \tabularnewline
24 & 0.07439 & 0.5154 & 0.304323 \tabularnewline
25 & 0.09495 & 0.6578 & 0.256895 \tabularnewline
26 & 0.088256 & 0.6115 & 0.271892 \tabularnewline
27 & 0.042526 & 0.2946 & 0.384774 \tabularnewline
28 & -0.101738 & -0.7049 & 0.242152 \tabularnewline
29 & -0.147653 & -1.023 & 0.155726 \tabularnewline
30 & -0.207911 & -1.4405 & 0.078115 \tabularnewline
31 & -0.258019 & -1.7876 & 0.040077 \tabularnewline
32 & -0.16911 & -1.1716 & 0.123565 \tabularnewline
33 & -0.214643 & -1.4871 & 0.071766 \tabularnewline
34 & -0.254958 & -1.7664 & 0.041844 \tabularnewline
35 & -0.227733 & -1.5778 & 0.060592 \tabularnewline
36 & -0.155466 & -1.0771 & 0.14341 \tabularnewline
\hline
\end{tabular}
%Source: https://freestatistics.org/blog/index.php?pk=60472&T=1

[TABLE]
[ROW][C]Autocorrelation Function[/C][/ROW]
[ROW][C]Time lag k[/C][C]ACF(k)[/C][C]T-STAT[/C][C]P-value[/C][/ROW]
[ROW][C]1[/C][C]0.51266[/C][C]3.5518[/C][C]0.000435[/C][/ROW]
[ROW][C]2[/C][C]0.351833[/C][C]2.4376[/C][C]0.009271[/C][/ROW]
[ROW][C]3[/C][C]0.298273[/C][C]2.0665[/C][C]0.0221[/C][/ROW]
[ROW][C]4[/C][C]0.357633[/C][C]2.4778[/C][C]0.008396[/C][/ROW]
[ROW][C]5[/C][C]0.254357[/C][C]1.7622[/C][C]0.042198[/C][/ROW]
[ROW][C]6[/C][C]0.106149[/C][C]0.7354[/C][C]0.23283[/C][/ROW]
[ROW][C]7[/C][C]0.011302[/C][C]0.0783[/C][C]0.468956[/C][/ROW]
[ROW][C]8[/C][C]0.015834[/C][C]0.1097[/C][C]0.456552[/C][/ROW]
[ROW][C]9[/C][C]-0.022248[/C][C]-0.1541[/C][C]0.439074[/C][/ROW]
[ROW][C]10[/C][C]-0.135085[/C][C]-0.9359[/C][C]0.177006[/C][/ROW]
[ROW][C]11[/C][C]-0.126973[/C][C]-0.8797[/C][C]0.191705[/C][/ROW]
[ROW][C]12[/C][C]-0.313631[/C][C]-2.1729[/C][C]0.017378[/C][/ROW]
[ROW][C]13[/C][C]-0.178373[/C][C]-1.2358[/C][C]0.111273[/C][/ROW]
[ROW][C]14[/C][C]-0.101795[/C][C]-0.7053[/C][C]0.242031[/C][/ROW]
[ROW][C]15[/C][C]-0.084801[/C][C]-0.5875[/C][C]0.279805[/C][/ROW]
[ROW][C]16[/C][C]-0.088591[/C][C]-0.6138[/C][C]0.271131[/C][/ROW]
[ROW][C]17[/C][C]0.006092[/C][C]0.0422[/C][C]0.483256[/C][/ROW]
[ROW][C]18[/C][C]0.114962[/C][C]0.7965[/C][C]0.214838[/C][/ROW]
[ROW][C]19[/C][C]0.156091[/C][C]1.0814[/C][C]0.142454[/C][/ROW]
[ROW][C]20[/C][C]0.058136[/C][C]0.4028[/C][C]0.344451[/C][/ROW]
[ROW][C]21[/C][C]0.110407[/C][C]0.7649[/C][C]0.224031[/C][/ROW]
[ROW][C]22[/C][C]0.20511[/C][C]1.421[/C][C]0.080884[/C][/ROW]
[ROW][C]23[/C][C]0.138508[/C][C]0.9596[/C][C]0.171031[/C][/ROW]
[ROW][C]24[/C][C]0.07439[/C][C]0.5154[/C][C]0.304323[/C][/ROW]
[ROW][C]25[/C][C]0.09495[/C][C]0.6578[/C][C]0.256895[/C][/ROW]
[ROW][C]26[/C][C]0.088256[/C][C]0.6115[/C][C]0.271892[/C][/ROW]
[ROW][C]27[/C][C]0.042526[/C][C]0.2946[/C][C]0.384774[/C][/ROW]
[ROW][C]28[/C][C]-0.101738[/C][C]-0.7049[/C][C]0.242152[/C][/ROW]
[ROW][C]29[/C][C]-0.147653[/C][C]-1.023[/C][C]0.155726[/C][/ROW]
[ROW][C]30[/C][C]-0.207911[/C][C]-1.4405[/C][C]0.078115[/C][/ROW]
[ROW][C]31[/C][C]-0.258019[/C][C]-1.7876[/C][C]0.040077[/C][/ROW]
[ROW][C]32[/C][C]-0.16911[/C][C]-1.1716[/C][C]0.123565[/C][/ROW]
[ROW][C]33[/C][C]-0.214643[/C][C]-1.4871[/C][C]0.071766[/C][/ROW]
[ROW][C]34[/C][C]-0.254958[/C][C]-1.7664[/C][C]0.041844[/C][/ROW]
[ROW][C]35[/C][C]-0.227733[/C][C]-1.5778[/C][C]0.060592[/C][/ROW]
[ROW][C]36[/C][C]-0.155466[/C][C]-1.0771[/C][C]0.14341[/C][/ROW]
[/TABLE]
Source: https://freestatistics.org/blog/index.php?pk=60472&T=1

Globally Unique Identifier (entire table): ba.freestatistics.org/blog/index.php?pk=60472&T=1

As an alternative you can also use a QR Code:  

The GUIDs for individual cells are displayed in the table below:

Autocorrelation Function
Time lag kACF(k)T-STATP-value
10.512663.55180.000435
20.3518332.43760.009271
30.2982732.06650.0221
40.3576332.47780.008396
50.2543571.76220.042198
60.1061490.73540.23283
70.0113020.07830.468956
80.0158340.10970.456552
9-0.022248-0.15410.439074
10-0.135085-0.93590.177006
11-0.126973-0.87970.191705
12-0.313631-2.17290.017378
13-0.178373-1.23580.111273
14-0.101795-0.70530.242031
15-0.084801-0.58750.279805
16-0.088591-0.61380.271131
170.0060920.04220.483256
180.1149620.79650.214838
190.1560911.08140.142454
200.0581360.40280.344451
210.1104070.76490.224031
220.205111.4210.080884
230.1385080.95960.171031
240.074390.51540.304323
250.094950.65780.256895
260.0882560.61150.271892
270.0425260.29460.384774
28-0.101738-0.70490.242152
29-0.147653-1.0230.155726
30-0.207911-1.44050.078115
31-0.258019-1.78760.040077
32-0.16911-1.17160.123565
33-0.214643-1.48710.071766
34-0.254958-1.76640.041844
35-0.227733-1.57780.060592
36-0.155466-1.07710.14341


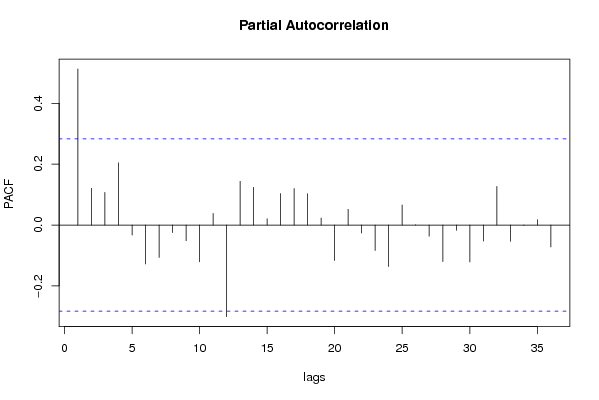
Partial Autocorrelation Function
Time lag kPACF(k)T-STATP-value
10.512663.55180.000435
20.1207470.83660.203494
30.1070710.74180.230908
40.2042141.41480.081786
5-0.032719-0.22670.410817
6-0.127846-0.88570.190087
7-0.10656-0.73830.231972
8-0.024554-0.17010.432816
9-0.05152-0.35690.361351
10-0.120921-0.83780.203158
110.038210.26470.396176
12-0.300859-2.08440.021234
130.1434490.99380.162642
140.1239940.85910.197289
150.0205940.14270.443569
160.1034740.71690.238458
170.1196990.82930.205521
180.1029940.71360.239477
190.0229570.1590.437149
20-0.116643-0.80810.211502
210.0516420.35780.361035
22-0.026203-0.18150.428355
23-0.083486-0.57840.282847
24-0.136198-0.94360.175048
250.0659460.45690.324906
260.0007060.00490.498058
27-0.036645-0.25390.400334
28-0.119821-0.83010.205284
29-0.017456-0.12090.452121
30-0.121269-0.84020.202488
31-0.052562-0.36420.358668
320.1267110.87790.192191
33-0.05357-0.37110.356082
34-0.001287-0.00890.496461
350.0176370.12220.451629
36-0.072082-0.49940.30989

\begin{tabular}{lllllllll}
\hline
Partial Autocorrelation Function \tabularnewline
Time lag k & PACF(k) & T-STAT & P-value \tabularnewline
1 & 0.51266 & 3.5518 & 0.000435 \tabularnewline
2 & 0.120747 & 0.8366 & 0.203494 \tabularnewline
3 & 0.107071 & 0.7418 & 0.230908 \tabularnewline
4 & 0.204214 & 1.4148 & 0.081786 \tabularnewline
5 & -0.032719 & -0.2267 & 0.410817 \tabularnewline
6 & -0.127846 & -0.8857 & 0.190087 \tabularnewline
7 & -0.10656 & -0.7383 & 0.231972 \tabularnewline
8 & -0.024554 & -0.1701 & 0.432816 \tabularnewline
9 & -0.05152 & -0.3569 & 0.361351 \tabularnewline
10 & -0.120921 & -0.8378 & 0.203158 \tabularnewline
11 & 0.03821 & 0.2647 & 0.396176 \tabularnewline
12 & -0.300859 & -2.0844 & 0.021234 \tabularnewline
13 & 0.143449 & 0.9938 & 0.162642 \tabularnewline
14 & 0.123994 & 0.8591 & 0.197289 \tabularnewline
15 & 0.020594 & 0.1427 & 0.443569 \tabularnewline
16 & 0.103474 & 0.7169 & 0.238458 \tabularnewline
17 & 0.119699 & 0.8293 & 0.205521 \tabularnewline
18 & 0.102994 & 0.7136 & 0.239477 \tabularnewline
19 & 0.022957 & 0.159 & 0.437149 \tabularnewline
20 & -0.116643 & -0.8081 & 0.211502 \tabularnewline
21 & 0.051642 & 0.3578 & 0.361035 \tabularnewline
22 & -0.026203 & -0.1815 & 0.428355 \tabularnewline
23 & -0.083486 & -0.5784 & 0.282847 \tabularnewline
24 & -0.136198 & -0.9436 & 0.175048 \tabularnewline
25 & 0.065946 & 0.4569 & 0.324906 \tabularnewline
26 & 0.000706 & 0.0049 & 0.498058 \tabularnewline
27 & -0.036645 & -0.2539 & 0.400334 \tabularnewline
28 & -0.119821 & -0.8301 & 0.205284 \tabularnewline
29 & -0.017456 & -0.1209 & 0.452121 \tabularnewline
30 & -0.121269 & -0.8402 & 0.202488 \tabularnewline
31 & -0.052562 & -0.3642 & 0.358668 \tabularnewline
32 & 0.126711 & 0.8779 & 0.192191 \tabularnewline
33 & -0.05357 & -0.3711 & 0.356082 \tabularnewline
34 & -0.001287 & -0.0089 & 0.496461 \tabularnewline
35 & 0.017637 & 0.1222 & 0.451629 \tabularnewline
36 & -0.072082 & -0.4994 & 0.30989 \tabularnewline
\hline
\end{tabular}
%Source: https://freestatistics.org/blog/index.php?pk=60472&T=2

[TABLE]
[ROW][C]Partial Autocorrelation Function[/C][/ROW]
[ROW][C]Time lag k[/C][C]PACF(k)[/C][C]T-STAT[/C][C]P-value[/C][/ROW]
[ROW][C]1[/C][C]0.51266[/C][C]3.5518[/C][C]0.000435[/C][/ROW]
[ROW][C]2[/C][C]0.120747[/C][C]0.8366[/C][C]0.203494[/C][/ROW]
[ROW][C]3[/C][C]0.107071[/C][C]0.7418[/C][C]0.230908[/C][/ROW]
[ROW][C]4[/C][C]0.204214[/C][C]1.4148[/C][C]0.081786[/C][/ROW]
[ROW][C]5[/C][C]-0.032719[/C][C]-0.2267[/C][C]0.410817[/C][/ROW]
[ROW][C]6[/C][C]-0.127846[/C][C]-0.8857[/C][C]0.190087[/C][/ROW]
[ROW][C]7[/C][C]-0.10656[/C][C]-0.7383[/C][C]0.231972[/C][/ROW]
[ROW][C]8[/C][C]-0.024554[/C][C]-0.1701[/C][C]0.432816[/C][/ROW]
[ROW][C]9[/C][C]-0.05152[/C][C]-0.3569[/C][C]0.361351[/C][/ROW]
[ROW][C]10[/C][C]-0.120921[/C][C]-0.8378[/C][C]0.203158[/C][/ROW]
[ROW][C]11[/C][C]0.03821[/C][C]0.2647[/C][C]0.396176[/C][/ROW]
[ROW][C]12[/C][C]-0.300859[/C][C]-2.0844[/C][C]0.021234[/C][/ROW]
[ROW][C]13[/C][C]0.143449[/C][C]0.9938[/C][C]0.162642[/C][/ROW]
[ROW][C]14[/C][C]0.123994[/C][C]0.8591[/C][C]0.197289[/C][/ROW]
[ROW][C]15[/C][C]0.020594[/C][C]0.1427[/C][C]0.443569[/C][/ROW]
[ROW][C]16[/C][C]0.103474[/C][C]0.7169[/C][C]0.238458[/C][/ROW]
[ROW][C]17[/C][C]0.119699[/C][C]0.8293[/C][C]0.205521[/C][/ROW]
[ROW][C]18[/C][C]0.102994[/C][C]0.7136[/C][C]0.239477[/C][/ROW]
[ROW][C]19[/C][C]0.022957[/C][C]0.159[/C][C]0.437149[/C][/ROW]
[ROW][C]20[/C][C]-0.116643[/C][C]-0.8081[/C][C]0.211502[/C][/ROW]
[ROW][C]21[/C][C]0.051642[/C][C]0.3578[/C][C]0.361035[/C][/ROW]
[ROW][C]22[/C][C]-0.026203[/C][C]-0.1815[/C][C]0.428355[/C][/ROW]
[ROW][C]23[/C][C]-0.083486[/C][C]-0.5784[/C][C]0.282847[/C][/ROW]
[ROW][C]24[/C][C]-0.136198[/C][C]-0.9436[/C][C]0.175048[/C][/ROW]
[ROW][C]25[/C][C]0.065946[/C][C]0.4569[/C][C]0.324906[/C][/ROW]
[ROW][C]26[/C][C]0.000706[/C][C]0.0049[/C][C]0.498058[/C][/ROW]
[ROW][C]27[/C][C]-0.036645[/C][C]-0.2539[/C][C]0.400334[/C][/ROW]
[ROW][C]28[/C][C]-0.119821[/C][C]-0.8301[/C][C]0.205284[/C][/ROW]
[ROW][C]29[/C][C]-0.017456[/C][C]-0.1209[/C][C]0.452121[/C][/ROW]
[ROW][C]30[/C][C]-0.121269[/C][C]-0.8402[/C][C]0.202488[/C][/ROW]
[ROW][C]31[/C][C]-0.052562[/C][C]-0.3642[/C][C]0.358668[/C][/ROW]
[ROW][C]32[/C][C]0.126711[/C][C]0.8779[/C][C]0.192191[/C][/ROW]
[ROW][C]33[/C][C]-0.05357[/C][C]-0.3711[/C][C]0.356082[/C][/ROW]
[ROW][C]34[/C][C]-0.001287[/C][C]-0.0089[/C][C]0.496461[/C][/ROW]
[ROW][C]35[/C][C]0.017637[/C][C]0.1222[/C][C]0.451629[/C][/ROW]
[ROW][C]36[/C][C]-0.072082[/C][C]-0.4994[/C][C]0.30989[/C][/ROW]
[/TABLE]
Source: https://freestatistics.org/blog/index.php?pk=60472&T=2

Globally Unique Identifier (entire table): ba.freestatistics.org/blog/index.php?pk=60472&T=2

As an alternative you can also use a QR Code:  

The GUIDs for individual cells are displayed in the table below:

Partial Autocorrelation Function
Time lag kPACF(k)T-STATP-value
10.512663.55180.000435
20.1207470.83660.203494
30.1070710.74180.230908
40.2042141.41480.081786
5-0.032719-0.22670.410817
6-0.127846-0.88570.190087
7-0.10656-0.73830.231972
8-0.024554-0.17010.432816
9-0.05152-0.35690.361351
10-0.120921-0.83780.203158
110.038210.26470.396176
12-0.300859-2.08440.021234
130.1434490.99380.162642
140.1239940.85910.197289
150.0205940.14270.443569
160.1034740.71690.238458
170.1196990.82930.205521
180.1029940.71360.239477
190.0229570.1590.437149
20-0.116643-0.80810.211502
210.0516420.35780.361035
22-0.026203-0.18150.428355
23-0.083486-0.57840.282847
24-0.136198-0.94360.175048
250.0659460.45690.324906
260.0007060.00490.498058
27-0.036645-0.25390.400334
28-0.119821-0.83010.205284
29-0.017456-0.12090.452121
30-0.121269-0.84020.202488
31-0.052562-0.36420.358668
320.1267110.87790.192191
33-0.05357-0.37110.356082
34-0.001287-0.00890.496461
350.0176370.12220.451629
36-0.072082-0.49940.30989


Parameters (Session):
par1 = 36 ; par2 = 1 ; par3 = 0 ; par4 = 1 ; par5 = 12 ; par6 = White Noise ; par7 = 0.95 ;
Parameters (R input):
par1 = 36 ; par2 = 1 ; par3 = 0 ; par4 = 1 ; par5 = 12 ; par6 = White Noise ; par7 = 0.95 ;
R code (references can be found in the software module):
if (par1 == 'Default') {
par1 = 10*log10(length(x))
} else {
par1 <- as.numeric(par1)
}
par2 <- as.numeric(par2)
par3 <- as.numeric(par3)
par4 <- as.numeric(par4)
par5 <- as.numeric(par5)
if (par6 == 'White Noise') par6 <- 'white' else par6 <- 'ma'
par7 <- as.numeric(par7)
if (par2 == 0) {
x <- log(x)
} else {
x <- (x ^ par2 - 1) / par2
}
if (par3 > 0) x <- diff(x,lag=1,difference=par3)
if (par4 > 0) x <- diff(x,lag=par5,difference=par4)
bitmap(file='pic1.png')
racf <- acf(x, par1, main='Autocorrelation', xlab='time lag', ylab='ACF', ci.type=par6, ci=par7, sub=paste('(lambda=',par2,', d=',par3,', D=',par4,', CI=', par7, ', CI type=',par6,')',sep=''))
dev.off()
bitmap(file='pic2.png')
rpacf <- pacf(x,par1,main='Partial Autocorrelation',xlab='lags',ylab='PACF')
dev.off()
(myacf <- c(racf$acf))
(mypacf <- c(rpacf$acf))
lengthx <- length(x)
sqrtn <- sqrt(lengthx)
load(file='createtable')
a<-table.start()
a<-table.row.start(a)
a<-table.element(a,'Autocorrelation Function',4,TRUE)
a<-table.row.end(a)
a<-table.row.start(a)
a<-table.element(a,'Time lag k',header=TRUE)
a<-table.element(a,hyperlink('basics.htm','ACF(k)','click here for more information about the Autocorrelation Function'),header=TRUE)
a<-table.element(a,'T-STAT',header=TRUE)
a<-table.element(a,'P-value',header=TRUE)
a<-table.row.end(a)
for (i in 2:(par1+1)) {
a<-table.row.start(a)
a<-table.element(a,i-1,header=TRUE)
a<-table.element(a,round(myacf[i],6))
mytstat <- myacf[i]*sqrtn
a<-table.element(a,round(mytstat,4))
a<-table.element(a,round(1-pt(abs(mytstat),lengthx),6))
a<-table.row.end(a)
}
a<-table.end(a)
table.save(a,file='mytable.tab')
a<-table.start()
a<-table.row.start(a)
a<-table.element(a,'Partial Autocorrelation Function',4,TRUE)
a<-table.row.end(a)
a<-table.row.start(a)
a<-table.element(a,'Time lag k',header=TRUE)
a<-table.element(a,hyperlink('basics.htm','PACF(k)','click here for more information about the Partial Autocorrelation Function'),header=TRUE)
a<-table.element(a,'T-STAT',header=TRUE)
a<-table.element(a,'P-value',header=TRUE)
a<-table.row.end(a)
for (i in 1:par1) {
a<-table.row.start(a)
a<-table.element(a,i,header=TRUE)
a<-table.element(a,round(mypacf[i],6))
mytstat <- mypacf[i]*sqrtn
a<-table.element(a,round(mytstat,4))
a<-table.element(a,round(1-pt(abs(mytstat),lengthx),6))
a<-table.row.end(a)
}
a<-table.end(a)
table.save(a,file='mytable1.tab')