| Multiple Linear Regression - Estimated Regression Equation |
| Y[t] = + 8.6179974317817 -0.784077046548957X[t] -0.131680096308189M1[t] -0.288490850722311M2[t] -0.423709309791332M3[t] -0.176201605136436M4[t] + 0.0501722311396466M5[t] + 0.276087640449438M6[t] + 0.223595345104334M7[t] + 0.0640584269662919M8[t] -0.159796950240770M9[t] -0.316607704654896M10[t] -0.0188707865168539M11[t] + 0.00385537720706263t + e[t] |
| Multiple Linear Regression - Ordinary Least Squares | |||||
| Variable | Parameter | S.D. | T-STAT H0: parameter = 0 | 2-tail p-value | 1-tail p-value |
| (Intercept) | 8.6179974317817 | 0.389086 | 22.1494 | 0 | 0 |
| X | -0.784077046548957 | 0.249202 | -3.1463 | 0.002898 | 0.001449 |
| M1 | -0.131680096308189 | 0.364768 | -0.361 | 0.719754 | 0.359877 |
| M2 | -0.288490850722311 | 0.365305 | -0.7897 | 0.43374 | 0.21687 |
| M3 | -0.423709309791332 | 0.362866 | -1.1677 | 0.248955 | 0.124477 |
| M4 | -0.176201605136436 | 0.362764 | -0.4857 | 0.629472 | 0.314736 |
| M5 | 0.0501722311396466 | 0.360405 | 0.1392 | 0.889891 | 0.444946 |
| M6 | 0.276087640449438 | 0.360898 | 0.765 | 0.448177 | 0.224089 |
| M7 | 0.223595345104334 | 0.360859 | 0.6196 | 0.538565 | 0.269283 |
| M8 | 0.0640584269662919 | 0.359909 | 0.178 | 0.859516 | 0.429758 |
| M9 | -0.159796950240770 | 0.359486 | -0.4445 | 0.658754 | 0.329377 |
| M10 | -0.316607704654896 | 0.359682 | -0.8802 | 0.383303 | 0.191651 |
| M11 | -0.0188707865168539 | 0.35939 | -0.0525 | 0.958351 | 0.479176 |
| t | 0.00385537720706263 | 0.007897 | 0.4882 | 0.627716 | 0.313858 |
| Multiple Linear Regression - Regression Statistics | |
| Multiple R | 0.650277121162806 |
| R-squared | 0.422860334307787 |
| Adjusted R-squared | 0.259755646177378 |
| F-TEST (value) | 2.59257007971282 |
| F-TEST (DF numerator) | 13 |
| F-TEST (DF denominator) | 46 |
| p-value | 0.00877358101141823 |
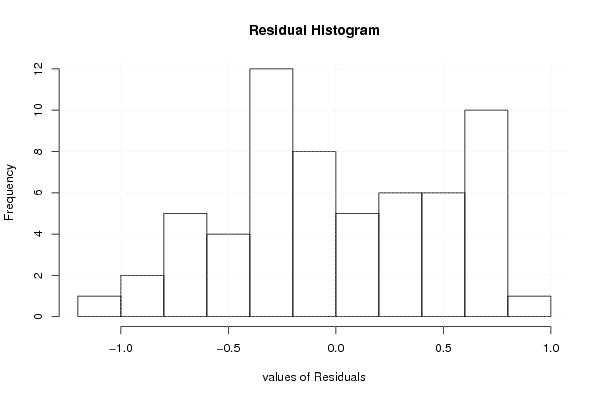
| Multiple Linear Regression - Residual Statistics | |
| Residual Standard Deviation | 0.567813318395598 |
| Sum Squared Residuals | 14.8309503691814 |
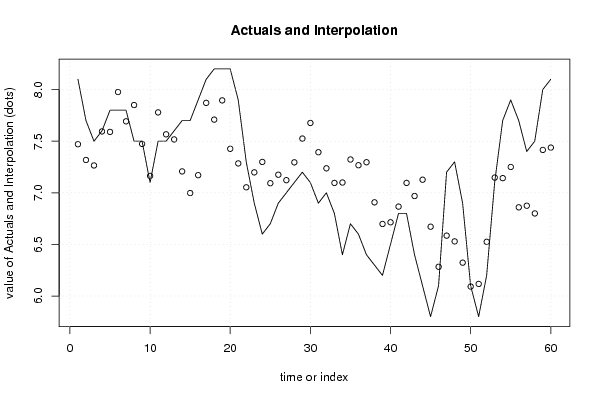
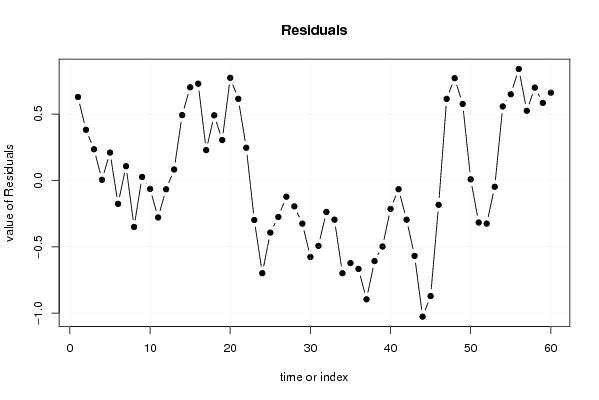
| Multiple Linear Regression - Actuals, Interpolation, and Residuals | |||
| Time or Index | Actuals | Interpolation Forecast | Residuals Prediction Error |
| 1 | 8.1 | 7.47087255216695 | 0.629127447833052 |
| 2 | 7.7 | 7.31791717495987 | 0.382082825040129 |
| 3 | 7.5 | 7.26496179775281 | 0.235038202247192 |
| 4 | 7.6 | 7.59473258426966 | 0.00526741573033712 |
| 5 | 7.8 | 7.58973868378812 | 0.210261316211878 |
| 6 | 7.8 | 7.97632487961477 | -0.176324879614767 |
| 7 | 7.8 | 7.69246484751204 | 0.107535152487962 |
| 8 | 7.5 | 7.85041412520064 | -0.350414125200642 |
| 9 | 7.5 | 7.47359871589085 | 0.0264012841091502 |
| 10 | 7.1 | 7.163827929374 | -0.0638279293739963 |
| 11 | 7.5 | 7.77905104333868 | -0.279051043338684 |
| 12 | 7.5 | 7.56655409309791 | -0.0665540930979128 |
| 13 | 7.6 | 7.51713707865168 | 0.0828629213483181 |
| 14 | 7.7 | 7.20736629213483 | 0.492633707865169 |
| 15 | 7.7 | 6.99759550561798 | 0.702404494382023 |
| 16 | 7.9 | 7.17055088282504 | 0.729449117174961 |
| 17 | 8.1 | 7.87122632423756 | 0.22877367576244 |
| 18 | 8.2 | 7.70895858747993 | 0.491041412520064 |
| 19 | 8.2 | 7.89554478330658 | 0.304455216693418 |
| 20 | 8.2 | 7.42623242375602 | 0.773767576243981 |
| 21 | 7.9 | 7.28464012841091 | 0.615359871589086 |
| 22 | 7.3 | 7.05327704654896 | 0.246722953451044 |
| 23 | 6.9 | 7.19805393258427 | -0.298053932584269 |
| 24 | 6.6 | 7.29918780096308 | -0.699187800963082 |
| 25 | 6.7 | 7.09295537720706 | -0.392955377207059 |
| 26 | 6.9 | 7.17522311396469 | -0.275223113964687 |
| 27 | 7 | 7.12226773675762 | -0.122267736757625 |
| 28 | 7.1 | 7.29522311396469 | -0.195223113964687 |
| 29 | 7.2 | 7.52545232744783 | -0.325452327447833 |
| 30 | 7.1 | 7.67681540930979 | -0.576815409309792 |
| 31 | 6.9 | 7.39295537720706 | -0.492955377207062 |
| 32 | 7 | 7.23727383627608 | -0.237273836276083 |
| 33 | 6.8 | 7.09568154093098 | -0.295681540930979 |
| 34 | 6.4 | 7.0995415730337 | -0.699541573033708 |
| 35 | 6.7 | 7.32272616372392 | -0.622726163723916 |
| 36 | 6.6 | 7.26704462279294 | -0.667044622792938 |
| 37 | 6.4 | 7.2960353130016 | -0.896035313001602 |
| 38 | 6.3 | 6.90785682182986 | -0.607856821829856 |
| 39 | 6.2 | 6.698086035313 | -0.498086035313002 |
| 40 | 6.5 | 6.71422600321027 | -0.214226003210273 |
| 41 | 6.8 | 6.86604751203852 | -0.0660475120385234 |
| 42 | 6.8 | 7.09581829855538 | -0.295818298555377 |
| 43 | 6.4 | 6.96877367576244 | -0.56877367576244 |
| 44 | 6.1 | 7.12672295345104 | -1.02672295345104 |
| 45 | 5.8 | 6.67149983948636 | -0.871499839486357 |
| 46 | 6.1 | 6.2833213483146 | -0.183321348314607 |
| 47 | 7.2 | 6.58491364365971 | 0.615086356340289 |
| 48 | 7.3 | 6.52923210272873 | 0.770767897271267 |
| 49 | 6.9 | 6.32299967897271 | 0.57700032102729 |
| 50 | 6.1 | 6.09163659711075 | 0.00836340288924503 |
| 51 | 5.8 | 6.11708892455859 | -0.317088924558588 |
| 52 | 6.2 | 6.52526741573034 | -0.325267415730337 |
| 53 | 7.1 | 7.14753515248796 | -0.0475351524879622 |
| 54 | 7.7 | 7.14208282504013 | 0.557917174959871 |
| 55 | 7.9 | 7.25026131621188 | 0.649738683788121 |
| 56 | 7.7 | 6.85935666131621 | 0.840643338683788 |
| 57 | 7.4 | 6.8745797752809 | 0.525420224719100 |
| 58 | 7.5 | 6.80003210272873 | 0.699967897271267 |
| 59 | 8 | 7.41525521669342 | 0.58474478330658 |
| 60 | 8.1 | 7.43798138041734 | 0.662018619582663 |
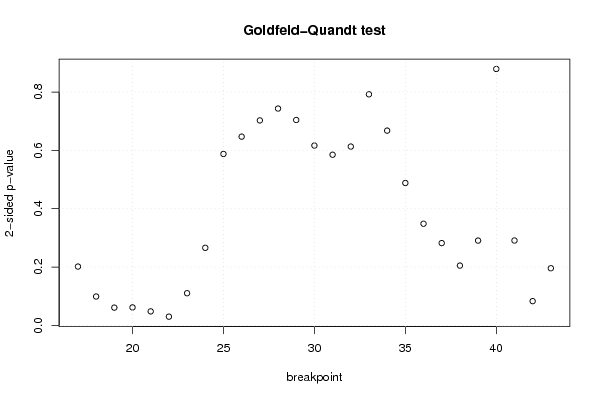
| Goldfeld-Quandt test for Heteroskedasticity | |||
| p-values | Alternative Hypothesis | ||
| breakpoint index | greater | 2-sided | less |
| 17 | 0.100879655468819 | 0.201759310937637 | 0.899120344531181 |
| 18 | 0.0495432551261383 | 0.0990865102522766 | 0.950456744873862 |
| 19 | 0.0305354518330083 | 0.0610709036660167 | 0.969464548166992 |
| 20 | 0.0308579667733648 | 0.0617159335467296 | 0.969142033226635 |
| 21 | 0.0241002327187309 | 0.0482004654374618 | 0.975899767281269 |
| 22 | 0.0150526659620523 | 0.0301053319241047 | 0.984947334037948 |
| 23 | 0.0552117741279051 | 0.110423548255810 | 0.944788225872095 |
| 24 | 0.132976293495268 | 0.265952586990536 | 0.867023706504732 |
| 25 | 0.293839719833587 | 0.587679439667174 | 0.706160280166413 |
| 26 | 0.323498417700895 | 0.646996835401789 | 0.676501582299105 |
| 27 | 0.351346968588563 | 0.702693937177126 | 0.648653031411437 |
| 28 | 0.371630920516040 | 0.743261841032079 | 0.62836907948396 |
| 29 | 0.352037740300088 | 0.704075480600175 | 0.647962259699912 |
| 30 | 0.308245660700952 | 0.616491321401905 | 0.691754339299048 |
| 31 | 0.292534597222568 | 0.585069194445135 | 0.707465402777432 |
| 32 | 0.306519034381953 | 0.613038068763907 | 0.693480965618047 |
| 33 | 0.396021320454333 | 0.792042640908666 | 0.603978679545667 |
| 34 | 0.333822386026490 | 0.667644772052981 | 0.66617761397351 |
| 35 | 0.244090549992733 | 0.488181099985465 | 0.755909450007267 |
| 36 | 0.174289210024020 | 0.348578420048039 | 0.82571078997598 |
| 37 | 0.141085635300336 | 0.282171270600672 | 0.858914364699664 |
| 38 | 0.102570291113581 | 0.205140582227162 | 0.897429708886419 |
| 39 | 0.145399497863562 | 0.290798995727124 | 0.854600502136438 |
| 40 | 0.560507913361408 | 0.878984173277184 | 0.439492086638592 |
| 41 | 0.854487258376502 | 0.291025483246996 | 0.145512741623498 |
| 42 | 0.95840180725519 | 0.0831963854896197 | 0.0415981927448099 |
| 43 | 0.902002258140743 | 0.195995483718514 | 0.0979977418592572 |
| Meta Analysis of Goldfeld-Quandt test for Heteroskedasticity | |||
| Description | # significant tests | % significant tests | OK/NOK |
| 1% type I error level | 0 | 0 | OK |
| 5% type I error level | 2 | 0.0740740740740741 | NOK |
| 10% type I error level | 6 | 0.222222222222222 | NOK |