| Multiple Linear Regression - Estimated Regression Equation |
| Y[t] = + 24.9913736952300 -0.00450103556579507X[t] + 0.832983649674458`Y(t-1)`[t] -0.0571738582741973`Y(t-2)`[t] -0.232786626019946`Y(t-3)`[t] + 0.228951294811920`Y(t-4)`[t] + 0.0226526075029203t + e[t] |
| Multiple Linear Regression - Ordinary Least Squares | |||||
| Variable | Parameter | S.D. | T-STAT H0: parameter = 0 | 2-tail p-value | 1-tail p-value |
| (Intercept) | 24.9913736952300 | 10.294385 | 2.4277 | 0.018839 | 0.009419 |
| X | -0.00450103556579507 | 0.004947 | -0.9099 | 0.367258 | 0.183629 |
| `Y(t-1)` | 0.832983649674458 | 0.135743 | 6.1365 | 0 | 0 |
| `Y(t-2)` | -0.0571738582741973 | 0.178307 | -0.3206 | 0.749813 | 0.374906 |
| `Y(t-3)` | -0.232786626019946 | 0.180137 | -1.2923 | 0.202203 | 0.101102 |
| `Y(t-4)` | 0.228951294811920 | 0.13434 | 1.7043 | 0.09454 | 0.04727 |
| t | 0.0226526075029203 | 0.012086 | 1.8743 | 0.066741 | 0.03337 |
| Multiple Linear Regression - Regression Statistics | |
| Multiple R | 0.989693018832834 |
| R-squared | 0.979492271526448 |
| Adjusted R-squared | 0.977031344109622 |
| F-TEST (value) | 398.017537953093 |
| F-TEST (DF numerator) | 6 |
| F-TEST (DF denominator) | 50 |
| p-value | 0 |
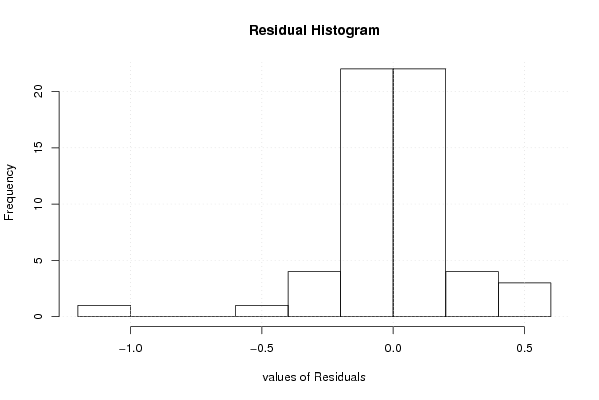
| Multiple Linear Regression - Residual Statistics | |
| Residual Standard Deviation | 0.253351340812442 |
| Sum Squared Residuals | 3.2093450945731 |
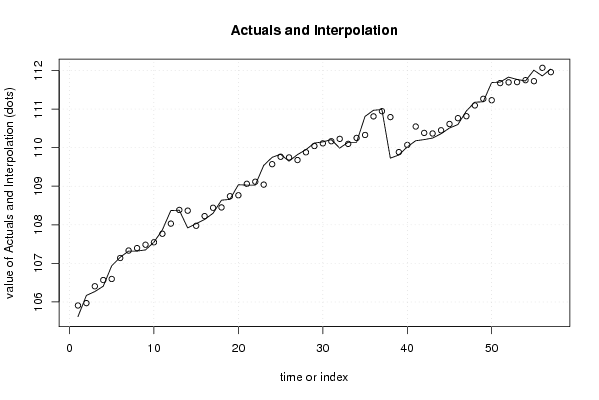
| Multiple Linear Regression - Actuals, Interpolation, and Residuals | |||
| Time or Index | Actuals | Interpolation Forecast | Residuals Prediction Error |
| 1 | 105.62 | 105.909556464123 | -0.289556464122704 |
| 2 | 106.17 | 105.970792181225 | 0.199207818774814 |
| 3 | 106.27 | 106.407996695428 | -0.137996695428173 |
| 4 | 106.41 | 106.568696767885 | -0.158696767885347 |
| 5 | 106.94 | 106.596737168437 | 0.343262831563244 |
| 6 | 107.16 | 107.140252809085 | 0.0197471909147292 |
| 7 | 107.32 | 107.333035858797 | -0.0130358587974443 |
| 8 | 107.32 | 107.396496501248 | -0.0764965012481687 |
| 9 | 107.35 | 107.484678465875 | -0.134678465874600 |
| 10 | 107.55 | 107.547694525346 | 0.00230547465391893 |
| 11 | 107.87 | 107.768305036109 | 0.101694963891410 |
| 12 | 108.37 | 108.031082197765 | 0.33891780223521 |
| 13 | 108.38 | 108.386001171749 | -0.00600117174898755 |
| 14 | 107.92 | 108.366761851086 | -0.446761851085839 |
| 15 | 108.03 | 107.974964200647 | 0.05503579935279 |
| 16 | 108.14 | 108.225937361696 | -0.0859373616955538 |
| 17 | 108.3 | 108.441770055077 | -0.141770055077426 |
| 18 | 108.64 | 108.450719550465 | 0.189280449535359 |
| 19 | 108.66 | 108.740985507442 | -0.0809855074419642 |
| 20 | 109.04 | 108.766036424608 | 0.273963575391751 |
| 21 | 109.03 | 109.063004427526 | -0.0330044275261714 |
| 22 | 109.03 | 109.116996126921 | -0.0869961269214201 |
| 23 | 109.54 | 109.042387370762 | 0.497612629238232 |
| 24 | 109.75 | 109.572034351338 | 0.177965648662209 |
| 25 | 109.83 | 109.764226340530 | 0.0657736594696631 |
| 26 | 109.65 | 109.746870490776 | -0.0968704907764538 |
| 27 | 109.82 | 109.679066221335 | 0.140933778664978 |
| 28 | 109.95 | 109.880193522839 | 0.069806477161267 |
| 29 | 110.12 | 110.042412723295 | 0.0775872767046766 |
| 30 | 110.15 | 110.110983271139 | 0.0390167288614961 |
| 31 | 110.21 | 110.166972455293 | 0.0430275447070031 |
| 32 | 109.99 | 110.227763735441 | -0.237763735440703 |
| 33 | 110.14 | 110.098008168350 | 0.0419918316495721 |
| 34 | 110.14 | 110.251853089454 | -0.111853089454194 |
| 35 | 110.81 | 110.328494204779 | 0.481505795220788 |
| 36 | 110.97 | 110.811175637796 | 0.158824362204449 |
| 37 | 110.99 | 110.946217944697 | 0.0437820553029272 |
| 38 | 109.73 | 110.791698761526 | -1.06169876152646 |
| 39 | 109.81 | 109.884391056912 | -0.0743910569119973 |
| 40 | 110.02 | 110.070451225203 | -0.0504512252029452 |
| 41 | 110.18 | 110.547933579171 | -0.367933579170848 |
| 42 | 110.21 | 110.381964856789 | -0.171964856788717 |
| 43 | 110.25 | 110.367519921817 | -0.117519921816746 |
| 44 | 110.36 | 110.450479682502 | -0.0904796825019399 |
| 45 | 110.51 | 110.613502064465 | -0.103502064464917 |
| 46 | 110.6 | 110.76452296484 | -0.164522964840062 |
| 47 | 110.95 | 110.814659377530 | 0.135340622470497 |
| 48 | 111.18 | 111.094352748633 | 0.0856472513667392 |
| 49 | 111.19 | 111.266054379230 | -0.0760543792303016 |
| 50 | 111.69 | 111.229633655535 | 0.460366344465301 |
| 51 | 111.7 | 111.674363677023 | 0.025636322977022 |
| 52 | 111.83 | 111.693332356689 | 0.136667643311365 |
| 53 | 111.77 | 111.699334938915 | 0.0706650610853777 |
| 54 | 111.73 | 111.749537452190 | -0.0195374521897772 |
| 55 | 112.01 | 111.723240447188 | 0.286759552812021 |
| 56 | 111.86 | 112.068851352161 | -0.208851352161338 |
| 57 | 112.04 | 111.957014625318 | 0.0829853746823928 |
| Goldfeld-Quandt test for Heteroskedasticity | |||
| p-values | Alternative Hypothesis | ||
| breakpoint index | greater | 2-sided | less |
| 10 | 0.343887050882068 | 0.687774101764135 | 0.656112949117932 |
| 11 | 0.196242850758297 | 0.392485701516594 | 0.803757149241703 |
| 12 | 0.114542358901213 | 0.229084717802426 | 0.885457641098787 |
| 13 | 0.2824376980459 | 0.5648753960918 | 0.7175623019541 |
| 14 | 0.536132660446009 | 0.927734679107981 | 0.463867339553991 |
| 15 | 0.419048359201166 | 0.838096718402332 | 0.580951640798834 |
| 16 | 0.40486546848887 | 0.80973093697774 | 0.59513453151113 |
| 17 | 0.371756543957006 | 0.743513087914013 | 0.628243456042993 |
| 18 | 0.282944096634609 | 0.565888193269219 | 0.71705590336539 |
| 19 | 0.236031448776554 | 0.472062897553109 | 0.763968551223446 |
| 20 | 0.187305799334444 | 0.374611598668888 | 0.812694200665556 |
| 21 | 0.151174015487692 | 0.302348030975384 | 0.848825984512308 |
| 22 | 0.113990647804410 | 0.227981295608820 | 0.88600935219559 |
| 23 | 0.198583095752682 | 0.397166191505364 | 0.801416904247318 |
| 24 | 0.159705287650408 | 0.319410575300815 | 0.840294712349593 |
| 25 | 0.113388983117610 | 0.226777966235220 | 0.88661101688239 |
| 26 | 0.105177652581467 | 0.210355305162934 | 0.894822347418533 |
| 27 | 0.0769462346036761 | 0.153892469207352 | 0.923053765396324 |
| 28 | 0.0553633046730464 | 0.110726609346093 | 0.944636695326954 |
| 29 | 0.0380159159246459 | 0.0760318318492917 | 0.961984084075354 |
| 30 | 0.0277570839664933 | 0.0555141679329866 | 0.972242916033507 |
| 31 | 0.0196627503197175 | 0.0393255006394349 | 0.980337249680282 |
| 32 | 0.0240029822852979 | 0.0480059645705958 | 0.975997017714702 |
| 33 | 0.0154650809415682 | 0.0309301618831364 | 0.984534919058432 |
| 34 | 0.010736817713614 | 0.021473635427228 | 0.989263182286386 |
| 35 | 0.0494832176992929 | 0.0989664353985858 | 0.950516782300707 |
| 36 | 0.092245672564766 | 0.184491345129532 | 0.907754327435234 |
| 37 | 0.659991608712508 | 0.680016782574985 | 0.340008391287493 |
| 38 | 0.938116116677975 | 0.123767766644049 | 0.0618838833220246 |
| 39 | 0.927453616026723 | 0.145092767946555 | 0.0725463839732774 |
| 40 | 0.882991167406407 | 0.234017665187186 | 0.117008832593593 |
| 41 | 0.956163381780883 | 0.087673236438233 | 0.0438366182191165 |
| 42 | 0.91865955185206 | 0.162680896295879 | 0.0813404481479394 |
| 43 | 0.903011464580366 | 0.193977070839269 | 0.0969885354196343 |
| 44 | 0.855042917075347 | 0.289914165849305 | 0.144957082924653 |
| 45 | 0.756375786452976 | 0.487248427094048 | 0.243624213547024 |
| 46 | 0.715817940718264 | 0.568364118563471 | 0.284182059281736 |
| 47 | 0.655616975448154 | 0.688766049103692 | 0.344383024551846 |
| Meta Analysis of Goldfeld-Quandt test for Heteroskedasticity | |||
| Description | # significant tests | % significant tests | OK/NOK |
| 1% type I error level | 0 | 0 | OK |
| 5% type I error level | 4 | 0.105263157894737 | NOK |
| 10% type I error level | 8 | 0.210526315789474 | NOK |