| Multiple Linear Regression - Estimated Regression Equation |
| WMan>25[t] = + 0.735025720431746 -0.0210343049789478Infl[t] + 1.53127463437046`Yt-1`[t] -0.87884453464065`Yt-2`[t] + 0.233796372880887`Yt-3`[t] + 0.189859756972755M1[t] + 0.174504533469675M2[t] -0.0105409561502874M3[t] + 0.0117568591029149M4[t] -0.0614529939498516M5[t] -0.0384070699885562M6[t] -0.143835756622776M7[t] + 0.191929657849674M8[t] -0.237988285451912M9[t] -0.0344461062204082M10[t] -0.0984258641635606M11[t] + 0.000182769755273578t + e[t] |
| Multiple Linear Regression - Ordinary Least Squares | |||||
| Variable | Parameter | S.D. | T-STAT H0: parameter = 0 | 2-tail p-value | 1-tail p-value |
| (Intercept) | 0.735025720431746 | 0.579241 | 1.2689 | 0.211795 | 0.105897 |
| Infl | -0.0210343049789478 | 0.020598 | -1.0212 | 0.313303 | 0.156652 |
| `Yt-1` | 1.53127463437046 | 0.16145 | 9.4845 | 0 | 0 |
| `Yt-2` | -0.87884453464065 | 0.260262 | -3.3768 | 0.001644 | 0.000822 |
| `Yt-3` | 0.233796372880887 | 0.174767 | 1.3378 | 0.188532 | 0.094266 |
| M1 | 0.189859756972755 | 0.122122 | 1.5547 | 0.127903 | 0.063951 |
| M2 | 0.174504533469675 | 0.130647 | 1.3357 | 0.189201 | 0.0946 |
| M3 | -0.0105409561502874 | 0.1385 | -0.0761 | 0.939713 | 0.469856 |
| M4 | 0.0117568591029149 | 0.138498 | 0.0849 | 0.932774 | 0.466387 |
| M5 | -0.0614529939498516 | 0.133945 | -0.4588 | 0.648866 | 0.324433 |
| M6 | -0.0384070699885562 | 0.132947 | -0.2889 | 0.774157 | 0.387078 |
| M7 | -0.143835756622776 | 0.131778 | -1.0915 | 0.281584 | 0.140792 |
| M8 | 0.191929657849674 | 0.127343 | 1.5072 | 0.139622 | 0.069811 |
| M9 | -0.237988285451912 | 0.135333 | -1.7585 | 0.086304 | 0.043152 |
| M10 | -0.0344461062204082 | 0.13279 | -0.2594 | 0.796655 | 0.398328 |
| M11 | -0.0984258641635606 | 0.12832 | -0.767 | 0.447565 | 0.223783 |
| t | 0.000182769755273578 | 0.001993 | 0.0917 | 0.927386 | 0.463693 |
| Multiple Linear Regression - Regression Statistics | |
| Multiple R | 0.960363514089563 |
| R-squared | 0.922298079194454 |
| Adjusted R-squared | 0.891217310872236 |
| F-TEST (value) | 29.6742368024135 |
| F-TEST (DF numerator) | 16 |
| F-TEST (DF denominator) | 40 |
| p-value | 0 |
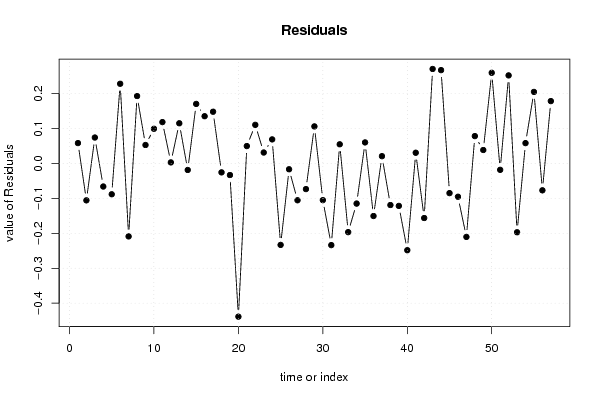
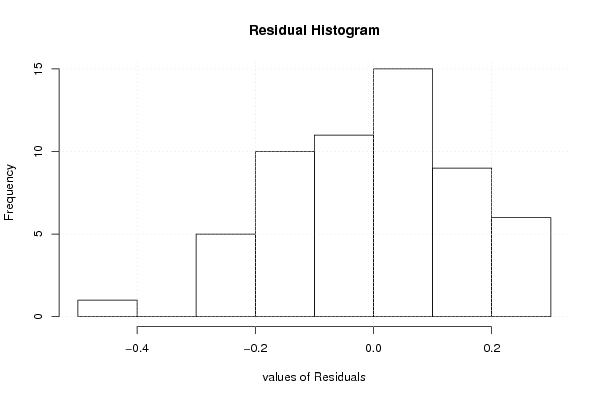
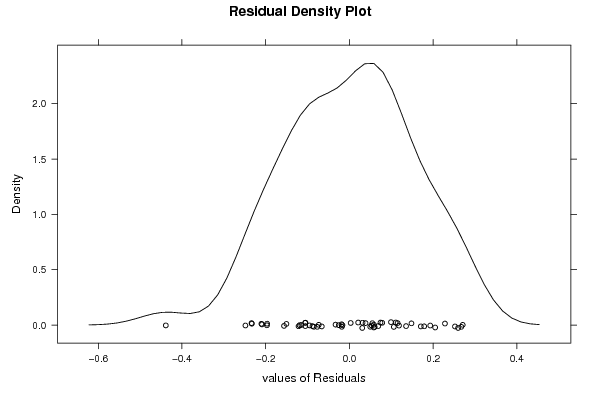
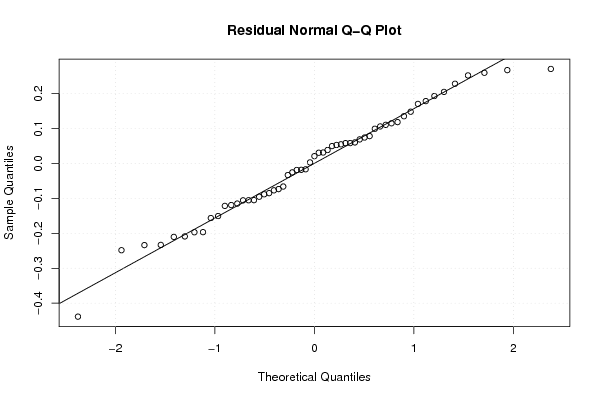
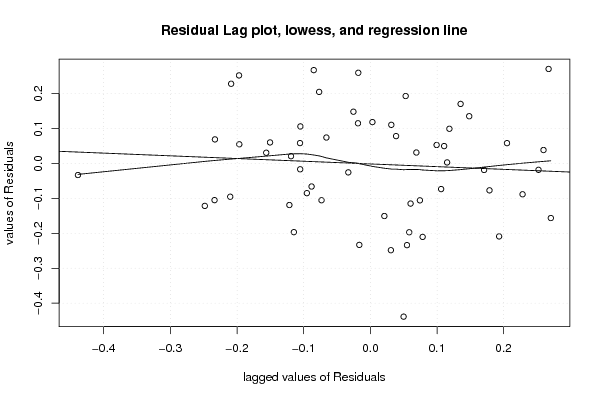
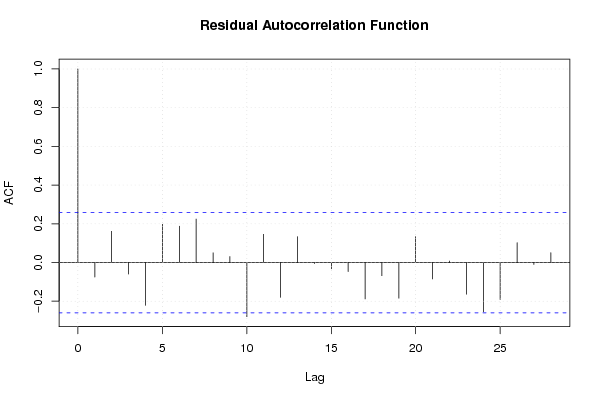
| Multiple Linear Regression - Residual Statistics | |
| Residual Standard Deviation | 0.180375424468064 |
| Sum Squared Residuals | 1.30141175008137 |
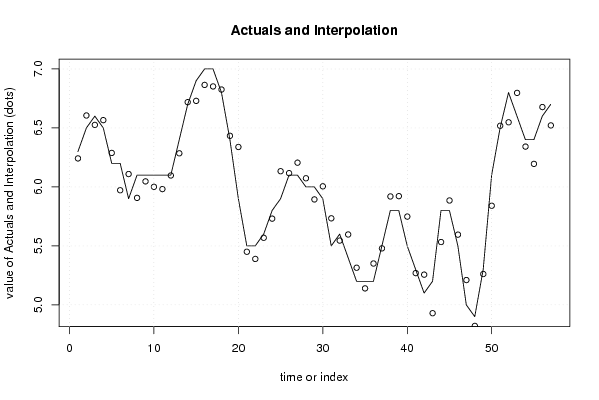
| Multiple Linear Regression - Actuals, Interpolation, and Residuals | |||
| Time or Index | Actuals | Interpolation Forecast | Residuals Prediction Error |
| 1 | 6.3 | 6.24154564974555 | 0.0584543502544519 |
| 2 | 6.5 | 6.60554666103937 | -0.105546661039375 |
| 3 | 6.6 | 6.52568689333466 | 0.0743131066653372 |
| 4 | 6.5 | 6.56597501793455 | -0.0659750179345478 |
| 5 | 6.2 | 6.28817813982265 | -0.0881781398226484 |
| 6 | 6.2 | 5.97170225597181 | 0.228297744028186 |
| 7 | 5.9 | 6.10883349269487 | -0.208833492694868 |
| 8 | 6.1 | 5.90684665275561 | 0.193153347244389 |
| 9 | 6.1 | 6.04701976647558 | 0.0529802335244167 |
| 10 | 6.1 | 6.00063003567418 | 0.099369964325824 |
| 11 | 6.1 | 5.98148889156458 | 0.118511108435421 |
| 12 | 6.1 | 6.09692496946657 | 0.00307503053342833 |
| 13 | 6.4 | 6.2848640656967 | 0.115135934303295 |
| 14 | 6.7 | 6.71855684977056 | -0.0185568497705628 |
| 15 | 6.9 | 6.72942315982481 | 0.170576840175186 |
| 16 | 7 | 6.86464422317945 | 0.135355776820546 |
| 17 | 7 | 6.85173519124251 | 0.14826480875749 |
| 18 | 6.8 | 6.82542498407961 | -0.0254249840796129 |
| 19 | 6.4 | 6.43309691661887 | -0.0330969166188734 |
| 20 | 5.9 | 6.33861444552023 | -0.43861444552023 |
| 21 | 5.5 | 5.45012392456667 | 0.0498760754333326 |
| 22 | 5.5 | 5.38934616847113 | 0.110653831528873 |
| 23 | 5.6 | 5.56860252969064 | 0.0313974703093559 |
| 24 | 5.8 | 5.73102693888996 | 0.0689730611100418 |
| 25 | 5.9 | 6.13312964753433 | -0.233129647534329 |
| 26 | 6.1 | 6.11659195708563 | -0.0165919570856334 |
| 27 | 6.1 | 6.20527270719873 | -0.105272707198725 |
| 28 | 6 | 6.07326059206927 | -0.0732605920692655 |
| 29 | 6 | 5.89386531991090 | 0.106134680089095 |
| 30 | 5.9 | 6.00497846709154 | -0.104978467091538 |
| 31 | 5.5 | 5.73374260197693 | -0.233742601976932 |
| 32 | 5.6 | 5.54506538592054 | 0.0549346140794619 |
| 33 | 5.4 | 5.59661585237944 | -0.196615852379442 |
| 34 | 5.2 | 5.3147863023736 | -0.114786302373605 |
| 35 | 5.2 | 5.13967607053206 | 0.0603239294679375 |
| 36 | 5.2 | 5.35046689281969 | -0.150466892819691 |
| 37 | 5.5 | 5.47902613148628 | 0.0209738685137202 |
| 38 | 5.8 | 5.91902920705382 | -0.119029207053820 |
| 39 | 5.8 | 5.92148179511649 | -0.121481795116494 |
| 40 | 5.5 | 5.74834450109915 | -0.248344501099146 |
| 41 | 5.3 | 5.26924649537162 | 0.0307535046283756 |
| 42 | 5.1 | 5.25618391409998 | -0.156183914099981 |
| 43 | 5.2 | 4.92927876043186 | 0.270721239568141 |
| 44 | 5.8 | 5.53264002696332 | 0.267359973036681 |
| 45 | 5.8 | 5.88492247550114 | -0.084922475501142 |
| 46 | 5.5 | 5.59523749348109 | -0.0952374934810924 |
| 47 | 5 | 5.21023250821271 | -0.210232508212714 |
| 48 | 4.9 | 4.82158119882378 | 0.0784188011762216 |
| 49 | 5.3 | 5.26143450553714 | 0.0385654944628619 |
| 50 | 6.1 | 5.84027532505061 | 0.259724674949391 |
| 51 | 6.5 | 6.5181354445253 | -0.0181354445253040 |
| 52 | 6.8 | 6.54777566571759 | 0.252224334282413 |
| 53 | 6.6 | 6.79697485365231 | -0.196974853652312 |
| 54 | 6.4 | 6.34171037875706 | 0.0582896212429455 |
| 55 | 6.4 | 6.19504822827747 | 0.204951771722533 |
| 56 | 6.6 | 6.6768334888403 | -0.0768334888403017 |
| 57 | 6.7 | 6.52131798107717 | 0.178682018922835 |
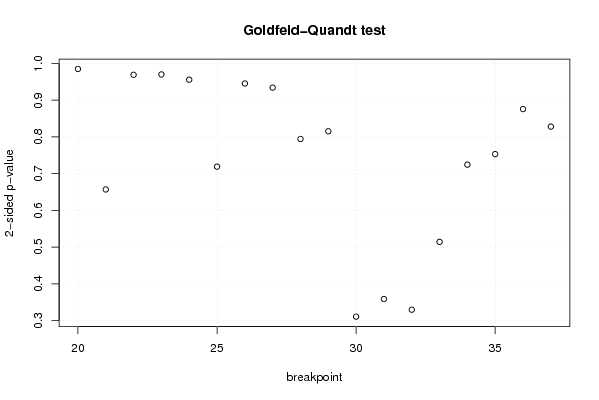
| Goldfeld-Quandt test for Heteroskedasticity | |||
| p-values | Alternative Hypothesis | ||
| breakpoint index | greater | 2-sided | less |
| 20 | 0.492579542751354 | 0.985159085502707 | 0.507420457248646 |
| 21 | 0.328504893616433 | 0.657009787232867 | 0.671495106383567 |
| 22 | 0.484608631307898 | 0.969217262615796 | 0.515391368692102 |
| 23 | 0.485120309768121 | 0.970240619536242 | 0.514879690231879 |
| 24 | 0.477950289256308 | 0.955900578512616 | 0.522049710743692 |
| 25 | 0.640447559412129 | 0.719104881175742 | 0.359552440587871 |
| 26 | 0.527190048967293 | 0.945619902065413 | 0.472809951032707 |
| 27 | 0.467190626800216 | 0.934381253600433 | 0.532809373199784 |
| 28 | 0.397257061499041 | 0.794514122998083 | 0.602742938500959 |
| 29 | 0.592279926467327 | 0.815440147065347 | 0.407720073532673 |
| 30 | 0.844681729036644 | 0.310636541926712 | 0.155318270963356 |
| 31 | 0.820714459297493 | 0.358571081405015 | 0.179285540702507 |
| 32 | 0.835212288403651 | 0.329575423192698 | 0.164787711596349 |
| 33 | 0.742878210279851 | 0.514243579440298 | 0.257121789720149 |
| 34 | 0.63775558575543 | 0.724488828489139 | 0.362244414244570 |
| 35 | 0.623366764594652 | 0.753266470810696 | 0.376633235405348 |
| 36 | 0.562052774481022 | 0.875894451037956 | 0.437947225518978 |
| 37 | 0.414051754613009 | 0.828103509226017 | 0.585948245386991 |
| Meta Analysis of Goldfeld-Quandt test for Heteroskedasticity | |||
| Description | # significant tests | % significant tests | OK/NOK |
| 1% type I error level | 0 | 0 | OK |
| 5% type I error level | 0 | 0 | OK |
| 10% type I error level | 0 | 0 | OK |