| Multiple Linear Regression - Estimated Regression Equation |
| y[t] = + 0.264585623036714 + 0.136019702329563x[t] + 1.1180927364462y1[t] -0.26871069986116y2[t] + 0.274416880874272y3[t] -0.284488421665747y4[t] + 0.289579993080271M1[t] + 0.0893609542088653M2[t] + 0.0956344083568998M3[t] -0.074459306273987M4[t] + 0.0764602746631292M5[t] + 0.105570035656608M6[t] -0.0471979987964152M7[t] + 0.110257357802178M8[t] + 0.027425940682833M9[t] + 0.152467811299498M10[t] + 0.216128371847527M11[t] + 0.00063940059680417t + e[t] |
| Multiple Linear Regression - Ordinary Least Squares | |||||
| Variable | Parameter | S.D. | T-STAT H0: parameter = 0 | 2-tail p-value | 1-tail p-value |
| (Intercept) | 0.264585623036714 | 0.327744 | 0.8073 | 0.424521 | 0.212261 |
| x | 0.136019702329563 | 0.280344 | 0.4852 | 0.630329 | 0.315164 |
| y1 | 1.1180927364462 | 0.155389 | 7.1954 | 0 | 0 |
| y2 | -0.26871069986116 | 0.234661 | -1.1451 | 0.259329 | 0.129665 |
| y3 | 0.274416880874272 | 0.238875 | 1.1488 | 0.257822 | 0.128911 |
| y4 | -0.284488421665747 | 0.187206 | -1.5197 | 0.136876 | 0.068438 |
| M1 | 0.289579993080271 | 0.340349 | 0.8508 | 0.400192 | 0.200096 |
| M2 | 0.0893609542088653 | 0.337754 | 0.2646 | 0.792768 | 0.396384 |
| M3 | 0.0956344083568998 | 0.33734 | 0.2835 | 0.778336 | 0.389168 |
| M4 | -0.074459306273987 | 0.337874 | -0.2204 | 0.826758 | 0.413379 |
| M5 | 0.0764602746631292 | 0.339282 | 0.2254 | 0.822908 | 0.411454 |
| M6 | 0.105570035656608 | 0.339343 | 0.3111 | 0.757424 | 0.378712 |
| M7 | -0.0471979987964152 | 0.338018 | -0.1396 | 0.889688 | 0.444844 |
| M8 | 0.110257357802178 | 0.338332 | 0.3259 | 0.7463 | 0.37315 |
| M9 | 0.027425940682833 | 0.350686 | 0.0782 | 0.938074 | 0.469037 |
| M10 | 0.152467811299498 | 0.350388 | 0.4351 | 0.665922 | 0.332961 |
| M11 | 0.216128371847527 | 0.348872 | 0.6195 | 0.53928 | 0.26964 |
| t | 0.00063940059680417 | 0.008795 | 0.0727 | 0.942425 | 0.471213 |
| Multiple Linear Regression - Regression Statistics | |
| Multiple R | 0.934795605561394 |
| R-squared | 0.873842824176893 |
| Adjusted R-squared | 0.81740408762445 |
| F-TEST (value) | 15.4830330647980 |
| F-TEST (DF numerator) | 17 |
| F-TEST (DF denominator) | 38 |
| p-value | 3.88156173869447e-12 |
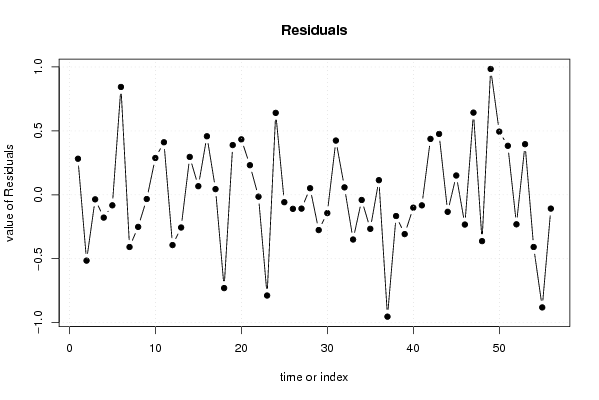
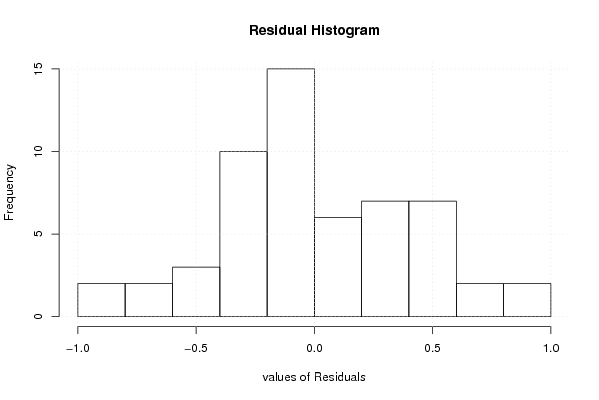
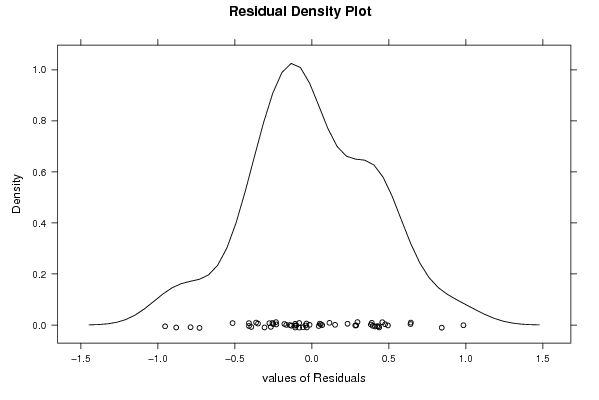
| Multiple Linear Regression - Residual Statistics | |
| Residual Standard Deviation | 0.492188623641708 |
| Sum Squared Residuals | 9.2054863672081 |
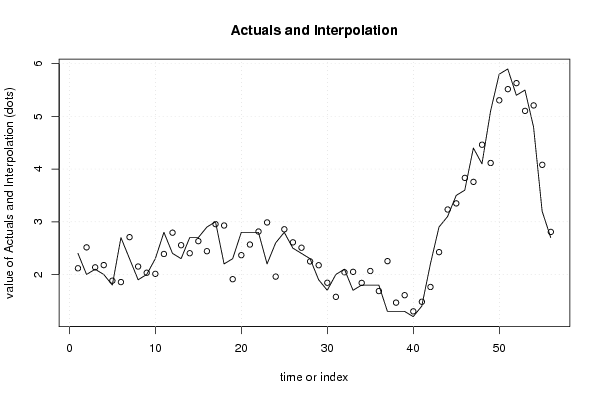
| Multiple Linear Regression - Actuals, Interpolation, and Residuals | |||
| Time or Index | Actuals | Interpolation Forecast | Residuals Prediction Error |
| 1 | 2.4 | 2.11786843552825 | 0.282131564471752 |
| 2 | 2 | 2.51487053102147 | -0.51487053102147 |
| 3 | 2.1 | 2.13543830223016 | -0.0354383022301558 |
| 4 | 2 | 2.17822746323113 | -0.178227463231126 |
| 5 | 1.8 | 1.88219745361858 | -0.0821974536185777 |
| 6 | 2.7 | 1.85643619465946 | 0.843563805340538 |
| 7 | 2.3 | 2.70844263332305 | -0.408442633323055 |
| 8 | 1.9 | 2.15102613205665 | -0.251026132056648 |
| 9 | 2 | 2.03295417802008 | -0.0329541780200847 |
| 10 | 2.3 | 2.01212267097376 | 0.287877329026242 |
| 11 | 2.8 | 2.38900799938292 | 0.410992000617075 |
| 12 | 2.4 | 2.79318924315068 | -0.393189243150680 |
| 13 | 2.3 | 2.5556924144144 | -0.255692414414402 |
| 14 | 2.7 | 2.40364969637706 | 0.296350303622945 |
| 15 | 2.7 | 2.63265975250391 | 0.0673402474960914 |
| 16 | 2.9 | 2.44207483910423 | 0.457925160895766 |
| 17 | 3 | 2.95546796244368 | 0.0445320375563233 |
| 18 | 2.2 | 2.92948888904005 | -0.72948888904005 |
| 19 | 2.3 | 1.91089837221561 | 0.389101627784392 |
| 20 | 2.8 | 2.36631496669883 | 0.433685033301168 |
| 21 | 2.8 | 2.56831590154728 | 0.231684098452717 |
| 22 | 2.8 | 2.8146742482502 | -0.0146742482501972 |
| 23 | 2.2 | 2.98773380766559 | -0.78773380766559 |
| 24 | 2.6 | 1.95914498371428 | 0.640855016285725 |
| 25 | 2.8 | 2.85782789188653 | -0.0578278918865263 |
| 26 | 2.5 | 2.60973239243214 | -0.109732392432137 |
| 27 | 2.4 | 2.50793509162004 | -0.107935091620041 |
| 28 | 2.3 | 2.24837272140824 | 0.0516272785917584 |
| 29 | 1.9 | 2.17577075068823 | -0.275770750688227 |
| 30 | 1.7 | 1.84305872609844 | -0.143058726098443 |
| 31 | 2 | 1.57580297897660 | 0.424197021023405 |
| 32 | 2.1 | 2.04174978689495 | 0.058250213105049 |
| 33 | 1.7 | 2.04966582655013 | -0.349665826550127 |
| 34 | 1.8 | 1.84046168179443 | -0.0404616817944307 |
| 35 | 1.8 | 2.06615035811605 | -0.26615035811605 |
| 36 | 1.8 | 1.68557472236293 | 0.114425277637072 |
| 37 | 1.3 | 2.25305087512329 | -0.953050875123293 |
| 38 | 1.3 | 1.46597602645902 | -0.165976026459016 |
| 39 | 1.3 | 1.60724423113443 | -0.307244231134435 |
| 40 | 1.2 | 1.30058147666322 | -0.100581476663216 |
| 41 | 1.4 | 1.48257539538539 | -0.0825753953853896 |
| 42 | 2.2 | 1.76281417425103 | 0.437185825748971 |
| 43 | 2.9 | 2.42397590149211 | 0.476024098507889 |
| 44 | 3.1 | 3.23309923265235 | -0.133099232652350 |
| 45 | 3.5 | 3.34906409388251 | 0.150935906117495 |
| 46 | 3.6 | 3.83274139898162 | -0.232741398981615 |
| 47 | 4.4 | 3.75710783483543 | 0.642892165164565 |
| 48 | 4.1 | 4.46209105077212 | -0.362091050772117 |
| 49 | 5.1 | 4.11556038304753 | 0.984439616952469 |
| 50 | 5.8 | 5.30577135371032 | 0.494228646289679 |
| 51 | 5.9 | 5.51672262251146 | 0.38327737748854 |
| 52 | 5.4 | 5.63074349959318 | -0.230743499593182 |
| 53 | 5.5 | 5.10398843786413 | 0.396011562135871 |
| 54 | 4.8 | 5.20820201595102 | -0.408202015951016 |
| 55 | 3.2 | 4.08088011399263 | -0.88088011399263 |
| 56 | 2.7 | 2.80780988169722 | -0.107809881697220 |
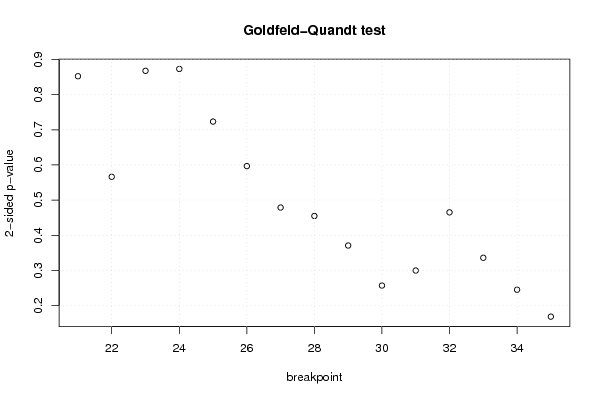
| Goldfeld-Quandt test for Heteroskedasticity | |||
| p-values | Alternative Hypothesis | ||
| breakpoint index | greater | 2-sided | less |
| 21 | 0.426112916016004 | 0.852225832032008 | 0.573887083983996 |
| 22 | 0.283148230297610 | 0.566296460595221 | 0.71685176970239 |
| 23 | 0.433825899197754 | 0.867651798395508 | 0.566174100802246 |
| 24 | 0.436471438853296 | 0.872942877706592 | 0.563528561146704 |
| 25 | 0.361635188100864 | 0.723270376201728 | 0.638364811899136 |
| 26 | 0.298371880372255 | 0.596743760744509 | 0.701628119627745 |
| 27 | 0.23943716999724 | 0.47887433999448 | 0.76056283000276 |
| 28 | 0.227443647291865 | 0.45488729458373 | 0.772556352708135 |
| 29 | 0.185453082070598 | 0.370906164141195 | 0.814546917929402 |
| 30 | 0.128533867041127 | 0.257067734082253 | 0.871466132958873 |
| 31 | 0.149878514711973 | 0.299757029423946 | 0.850121485288027 |
| 32 | 0.232665691484637 | 0.465331382969274 | 0.767334308515363 |
| 33 | 0.168029419546517 | 0.336058839093034 | 0.831970580453483 |
| 34 | 0.122624466132881 | 0.245248932265761 | 0.87737553386712 |
| 35 | 0.0843248786943932 | 0.168649757388786 | 0.915675121305607 |
| Meta Analysis of Goldfeld-Quandt test for Heteroskedasticity | |||
| Description | # significant tests | % significant tests | OK/NOK |
| 1% type I error level | 0 | 0 | OK |
| 5% type I error level | 0 | 0 | OK |
| 10% type I error level | 0 | 0 | OK |