| Multiple Linear Regression - Estimated Regression Equation |
| IndGez[t] = + 1.42438152443353 -0.167230832567180InvlMex[t] + 0.882141236165582`IndGez-1`[t] -0.982303190498912M1[t] -0.97592854981554M2[t] -0.825357250922293M3[t] -1.09592854981554M4[t] -1.13950030258242M5[t] -1.10542923062600M6[t] -0.924286632839504M7[t] -0.988304098246186M8[t] -1.03830409824619M9[t] -0.719197036437907M10[t] -0.861785876383442M11[t] + e[t] |
| Multiple Linear Regression - Ordinary Least Squares | |||||
| Variable | Parameter | S.D. | T-STAT H0: parameter = 0 | 2-tail p-value | 1-tail p-value |
| (Intercept) | 1.42438152443353 | 0.234209 | 6.0817 | 0 | 0 |
| InvlMex | -0.167230832567180 | 0.150408 | -1.1118 | 0.272681 | 0.136341 |
| `IndGez-1` | 0.882141236165582 | 0.042393 | 20.8085 | 0 | 0 |
| M1 | -0.982303190498912 | 0.215471 | -4.5589 | 4.6e-05 | 2.3e-05 |
| M2 | -0.97592854981554 | 0.217225 | -4.4927 | 5.6e-05 | 2.8e-05 |
| M3 | -0.825357250922293 | 0.217242 | -3.7992 | 0.000473 | 0.000236 |
| M4 | -1.09592854981554 | 0.217225 | -5.0451 | 1e-05 | 5e-06 |
| M5 | -1.13950030258242 | 0.217368 | -5.2423 | 5e-06 | 3e-06 |
| M6 | -1.10542923062600 | 0.217907 | -5.0729 | 9e-06 | 4e-06 |
| M7 | -0.924286632839504 | 0.218548 | -4.2292 | 0.000128 | 6.4e-05 |
| M8 | -0.988304098246186 | 0.227301 | -4.348 | 8.9e-05 | 4.4e-05 |
| M9 | -1.03830409824619 | 0.227301 | -4.568 | 4.4e-05 | 2.2e-05 |
| M10 | -0.719197036437907 | 0.227439 | -3.1621 | 0.002945 | 0.001472 |
| M11 | -0.861785876383442 | 0.226923 | -3.7977 | 0.000475 | 0.000237 |
| Multiple Linear Regression - Regression Statistics | |
| Multiple R | 0.962194952626626 |
| R-squared | 0.925819126860156 |
| Adjusted R-squared | 0.902298362206059 |
| F-TEST (value) | 39.3617784317609 |
| F-TEST (DF numerator) | 13 |
| F-TEST (DF denominator) | 41 |
| p-value | 0 |
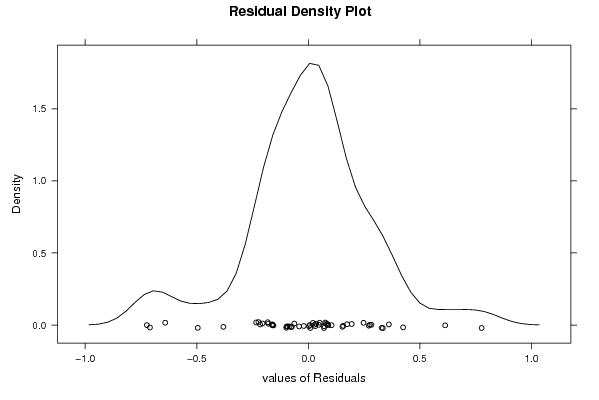
| Multiple Linear Regression - Residual Statistics | |
| Residual Standard Deviation | 0.320861133855173 |
| Sum Squared Residuals | 4.22102655597193 |
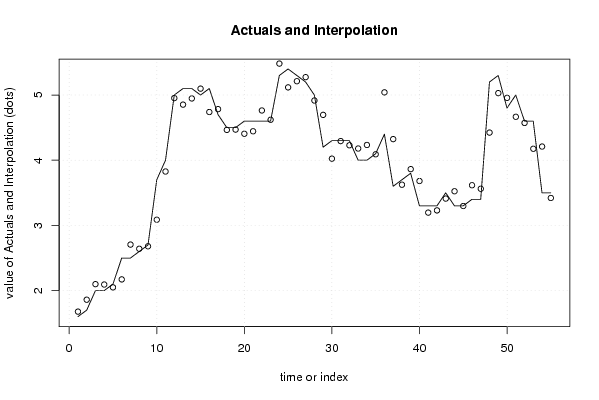
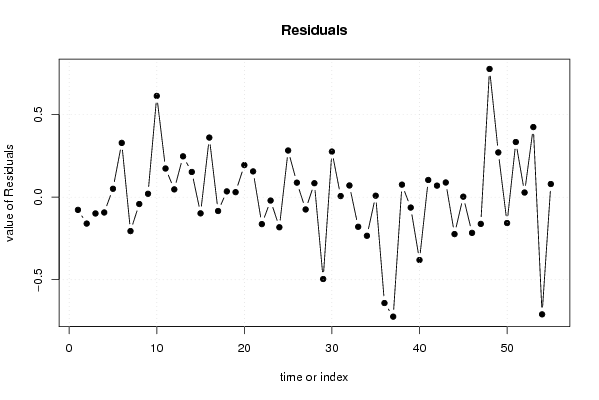
| Multiple Linear Regression - Actuals, Interpolation, and Residuals | |||
| Time or Index | Actuals | Interpolation Forecast | Residuals Prediction Error |
| 1 | 1.6 | 1.67707606456644 | -0.0770760645664356 |
| 2 | 1.7 | 1.85987895248292 | -0.15987895248292 |
| 3 | 2 | 2.09866437499272 | -0.0986643749927234 |
| 4 | 2 | 2.09273544694915 | -0.0927354469491545 |
| 5 | 2.1 | 2.04916369418227 | 0.0508363058177288 |
| 6 | 2.5 | 2.17144888975526 | 0.328551110244742 |
| 7 | 2.5 | 2.70544798200798 | -0.205447982007984 |
| 8 | 2.6 | 2.64143051660130 | -0.0414305166013019 |
| 9 | 2.7 | 2.67964464021786 | 0.0203553597821408 |
| 10 | 3.7 | 3.0869658256427 | 0.613034174357303 |
| 11 | 4 | 3.82651822186274 | 0.173481778137255 |
| 12 | 5 | 4.95294646909586 | 0.0470535309041391 |
| 13 | 5.1 | 4.85278451476253 | 0.247215485237469 |
| 14 | 5.1 | 4.94737327906246 | 0.15262672093754 |
| 15 | 5 | 5.09794457795571 | -0.0979445779557072 |
| 16 | 5.1 | 4.7391591554459 | 0.360840844554098 |
| 17 | 4.7 | 4.78380152629558 | -0.0838015262955758 |
| 18 | 4.5 | 4.46501610378577 | 0.0349838962142288 |
| 19 | 4.5 | 4.46973045433915 | 0.0302695456608515 |
| 20 | 4.6 | 4.40571298893247 | 0.194287011067534 |
| 21 | 4.6 | 4.44392711254902 | 0.156072887450976 |
| 22 | 4.6 | 4.7630341743573 | -0.163034174357303 |
| 23 | 4.6 | 4.62044533441177 | -0.0204453344117677 |
| 24 | 5.3 | 5.48223121079521 | -0.18223121079521 |
| 25 | 5.4 | 5.1174268856122 | 0.282573114387795 |
| 26 | 5.3 | 5.21201564991213 | 0.0879843500878647 |
| 27 | 5.2 | 5.27437282518882 | -0.0743728251888235 |
| 28 | 5 | 4.91558740267902 | 0.084412597320982 |
| 29 | 4.2 | 4.69558740267902 | -0.495587402679018 |
| 30 | 4.3 | 4.02394548570298 | 0.276054514297019 |
| 31 | 4.3 | 4.29330220710603 | 0.00669779289396837 |
| 32 | 4.3 | 4.22928474169935 | 0.070715258300651 |
| 33 | 4 | 4.17928474169935 | -0.179284741699349 |
| 34 | 4 | 4.23374943265795 | -0.233749432657954 |
| 35 | 4.1 | 4.09116059271242 | 0.0088394072875814 |
| 36 | 4.4 | 5.04116059271242 | -0.641160592712419 |
| 37 | 3.6 | 4.32349977306318 | -0.723499773063182 |
| 38 | 3.7 | 3.62416142481409 | 0.0758385751859131 |
| 39 | 3.8 | 3.86294684732389 | -0.0629468473238928 |
| 40 | 3.3 | 3.68058967204720 | -0.380589672047203 |
| 41 | 3.3 | 3.19594730119753 | 0.104052698802471 |
| 42 | 3.3 | 3.23001837315396 | 0.0699816268460437 |
| 43 | 3.5 | 3.41116097094045 | 0.0888390290595506 |
| 44 | 3.3 | 3.52357175276688 | -0.223571752766883 |
| 45 | 3.3 | 3.29714350553377 | 0.00285649446623263 |
| 46 | 3.4 | 3.61625056734205 | -0.216250567342046 |
| 47 | 3.4 | 3.56187585101307 | -0.161875851013069 |
| 48 | 5.2 | 4.42366172739651 | 0.77633827260349 |
| 49 | 5.3 | 5.02921276199565 | 0.270787238004353 |
| 50 | 4.8 | 4.9565706937284 | -0.156570693728398 |
| 51 | 5 | 4.66607137453885 | 0.333928625461147 |
| 52 | 4.6 | 4.57192832287872 | 0.0280716771212774 |
| 53 | 4.6 | 4.17550007564561 | 0.424499924354394 |
| 54 | 3.5 | 4.20957114760203 | -0.709571147602033 |
| 55 | 3.5 | 3.42035838560639 | 0.0796416143936131 |
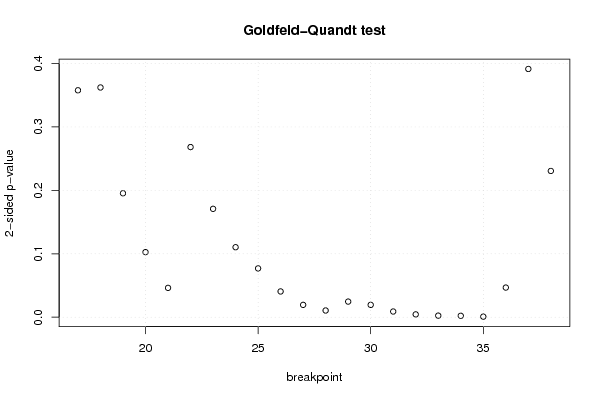
| Goldfeld-Quandt test for Heteroskedasticity | |||
| p-values | Alternative Hypothesis | ||
| breakpoint index | greater | 2-sided | less |
| 17 | 0.178880341166081 | 0.357760682332162 | 0.821119658833919 |
| 18 | 0.181103307737641 | 0.362206615475283 | 0.818896692262359 |
| 19 | 0.0977050454092338 | 0.195410090818468 | 0.902294954590766 |
| 20 | 0.0513025329271525 | 0.102605065854305 | 0.948697467072848 |
| 21 | 0.0231229580446458 | 0.0462459160892916 | 0.976877041955354 |
| 22 | 0.13412888835865 | 0.2682577767173 | 0.86587111164135 |
| 23 | 0.0854344386100902 | 0.170868877220180 | 0.91456556138991 |
| 24 | 0.0551698135868272 | 0.110339627173654 | 0.944830186413173 |
| 25 | 0.038480659361674 | 0.076961318723348 | 0.961519340638326 |
| 26 | 0.0203123529982687 | 0.0406247059965375 | 0.979687647001731 |
| 27 | 0.00972970359330364 | 0.0194594071866073 | 0.990270296406696 |
| 28 | 0.00528936708339018 | 0.0105787341667804 | 0.99471063291661 |
| 29 | 0.0123146804252546 | 0.0246293608505092 | 0.987685319574745 |
| 30 | 0.00973279333350235 | 0.0194655866670047 | 0.990267206666498 |
| 31 | 0.00449762448957547 | 0.00899524897915093 | 0.995502375510425 |
| 32 | 0.00222755636149520 | 0.00445511272299039 | 0.997772443638505 |
| 33 | 0.00123948015100782 | 0.00247896030201563 | 0.998760519848992 |
| 34 | 0.00111384365177268 | 0.00222768730354536 | 0.998886156348227 |
| 35 | 0.000439794117558488 | 0.000879588235116976 | 0.999560205882442 |
| 36 | 0.0233682983587977 | 0.0467365967175955 | 0.976631701641202 |
| 37 | 0.195703567348831 | 0.391407134697662 | 0.804296432651169 |
| 38 | 0.115294210592324 | 0.230588421184649 | 0.884705789407676 |
| Meta Analysis of Goldfeld-Quandt test for Heteroskedasticity | |||
| Description | # significant tests | % significant tests | OK/NOK |
| 1% type I error level | 5 | 0.227272727272727 | NOK |
| 5% type I error level | 12 | 0.545454545454545 | NOK |
| 10% type I error level | 13 | 0.590909090909091 | NOK |