| Multiple Linear Regression - Estimated Regression Equation |
| X1[t] = + 0.185036980311549 + 0.073579736810377X2[t] + 1.11584285808511X3[t] -0.256942291868568X4[t] + 0.278431112422916X5[t] -0.293078735356719X6[t] + e[t] |
| Multiple Linear Regression - Ordinary Least Squares | |||||
| Variable | Parameter | S.D. | T-STAT H0: parameter = 0 | 2-tail p-value | 1-tail p-value |
| (Intercept) | 0.185036980311549 | 0.231657 | 0.7988 | 0.428211 | 0.214106 |
| X2 | 0.073579736810377 | 0.07253 | 1.0145 | 0.315243 | 0.157621 |
| X3 | 1.11584285808511 | 0.13542 | 8.2399 | 0 | 0 |
| X4 | -0.256942291868568 | 0.207051 | -1.241 | 0.220411 | 0.110206 |
| X5 | 0.278431112422916 | 0.211157 | 1.3186 | 0.193312 | 0.096656 |
| X6 | -0.293078735356719 | 0.156309 | -1.875 | 0.06664 | 0.03332 |
| Multiple Linear Regression - Regression Statistics | |
| Multiple R | 0.930382067608297 |
| R-squared | 0.86561079172709 |
| Adjusted R-squared | 0.8521718708998 |
| F-TEST (value) | 64.4107367586582 |
| F-TEST (DF numerator) | 5 |
| F-TEST (DF denominator) | 50 |
| p-value | 0 |
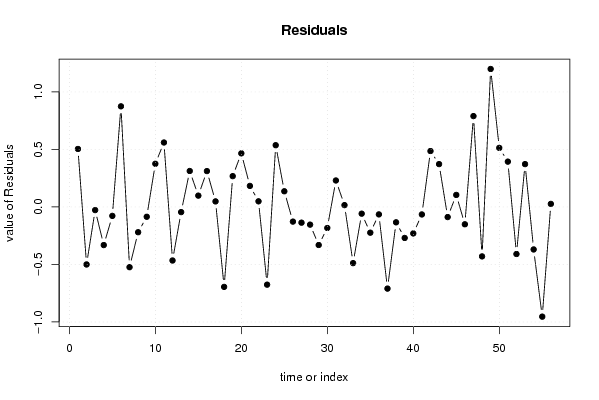
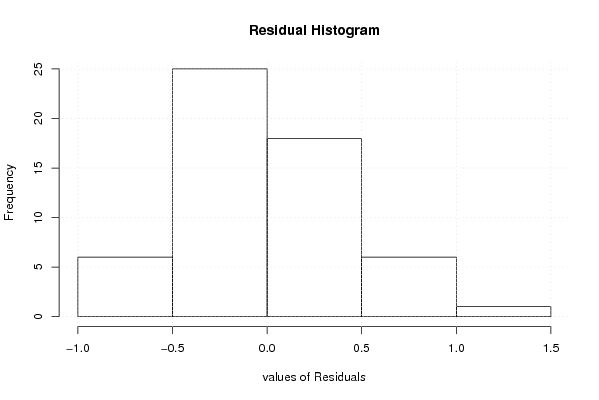
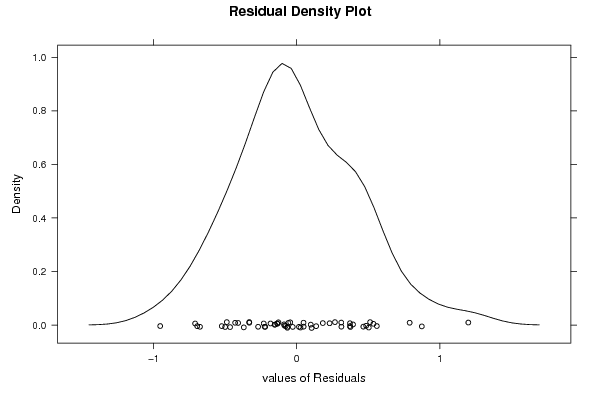
| Multiple Linear Regression - Residual Statistics | |
| Residual Standard Deviation | 0.442858093411831 |
| Sum Squared Residuals | 9.8061645450181 |
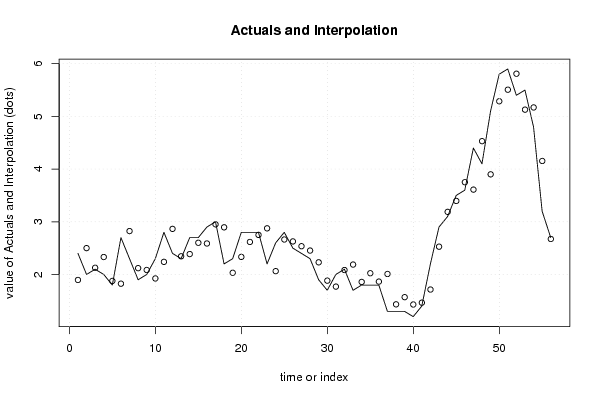
| Multiple Linear Regression - Actuals, Interpolation, and Residuals | |||
| Time or Index | Actuals | Interpolation Forecast | Residuals Prediction Error |
| 1 | 2.4 | 1.89599412621650 | 0.504005873783495 |
| 2 | 2 | 2.50015404715485 | -0.500154047154846 |
| 3 | 2.1 | 2.12747482538019 | -0.0274748253801892 |
| 4 | 2 | 2.33158269188247 | -0.331582691882465 |
| 5 | 1.8 | 1.87777661716823 | -0.077776617168228 |
| 6 | 2.7 | 1.82537688012304 | 0.874623119876957 |
| 7 | 2.3 | 2.82387292599539 | -0.523872925995388 |
| 8 | 1.9 | 2.11990937113072 | -0.219909371130724 |
| 9 | 2 | 2.08555289289608 | -0.0855528928960763 |
| 10 | 2.3 | 1.9247707886618 | 0.375229211338199 |
| 11 | 2.8 | 2.23968846607400 | 0.560311533926003 |
| 12 | 2.4 | 2.86560181294096 | -0.465601812940959 |
| 13 | 2.3 | 2.34501498396384 | -0.0450149839638354 |
| 14 | 2.7 | 2.38749955050719 | 0.312500449492806 |
| 15 | 2.7 | 2.60161911028057 | 0.0983808897194326 |
| 16 | 2.9 | 2.58823057643354 | 0.311769423566464 |
| 17 | 3 | 2.95207946655540 | 0.0479205334446046 |
| 18 | 2.2 | 2.89504379984750 | -0.695043799847505 |
| 19 | 2.3 | 2.03236150667715 | 0.267638493322853 |
| 20 | 2.8 | 2.33417873488164 | 0.465821265118362 |
| 21 | 2.8 | 2.61729636073574 | 0.182703639264255 |
| 22 | 2.8 | 2.75113131432913 | 0.0488686856708722 |
| 23 | 2.2 | 2.87575494436699 | -0.675754944366989 |
| 24 | 2.6 | 2.06338884867809 | 0.536611151321915 |
| 25 | 2.8 | 2.66389136703327 | 0.136108632966732 |
| 26 | 2.5 | 2.62752551760257 | -0.127525517602565 |
| 27 | 2.4 | 2.53669765903566 | -0.136697659035659 |
| 28 | 2.3 | 2.45389514175548 | -0.153895141755482 |
| 29 | 1.9 | 2.23101058591234 | -0.331010585912336 |
| 30 | 1.7 | 1.88295673648764 | -0.182956736487639 |
| 31 | 2 | 1.76991622285626 | 0.230083777143744 |
| 32 | 2.1 | 2.08429413037546 | 0.0157058696245409 |
| 33 | 1.7 | 2.18843477133064 | -0.488434771330645 |
| 34 | 1.8 | 1.85854847970796 | -0.0585484797079644 |
| 35 | 1.8 | 2.02386613342073 | -0.223866133420735 |
| 36 | 1.8 | 1.86484955941008 | -0.0648495594100774 |
| 37 | 1.3 | 2.00992416479506 | -0.709924164795057 |
| 38 | 1.3 | 1.43373182273839 | -0.133731822738388 |
| 39 | 1.3 | 1.56956094235371 | -0.26956094235371 |
| 40 | 1.2 | 1.43034538614225 | -0.230345386142252 |
| 41 | 1.4 | 1.4653004680121 | -0.0653004680121008 |
| 42 | 2.2 | 1.71416326881598 | 0.485836731184022 |
| 43 | 2.9 | 2.52760598566806 | 0.372394014331942 |
| 44 | 3.1 | 3.18813624885303 | -0.0881362488530329 |
| 45 | 3.5 | 3.39557435902905 | 0.104425640970954 |
| 46 | 3.6 | 3.75096183430004 | -0.15096183430004 |
| 47 | 4.4 | 3.610300311096 | 0.789699688903997 |
| 48 | 4.1 | 4.53003706627505 | -0.430037066275055 |
| 49 | 5.1 | 3.90034199245427 | 1.19965800754573 |
| 50 | 5.8 | 5.28670455450261 | 0.513295445497391 |
| 51 | 5.9 | 5.50610429390723 | 0.393895706092768 |
| 52 | 5.4 | 5.8093342900144 | -0.409334290014404 |
| 53 | 5.5 | 5.12754167512432 | 0.372458324875683 |
| 54 | 4.8 | 5.16968277705279 | -0.369682777052794 |
| 55 | 3.2 | 4.15390626221353 | -0.953906262213525 |
| 56 | 2.7 | 2.67350134884305 | 0.0264986511569475 |
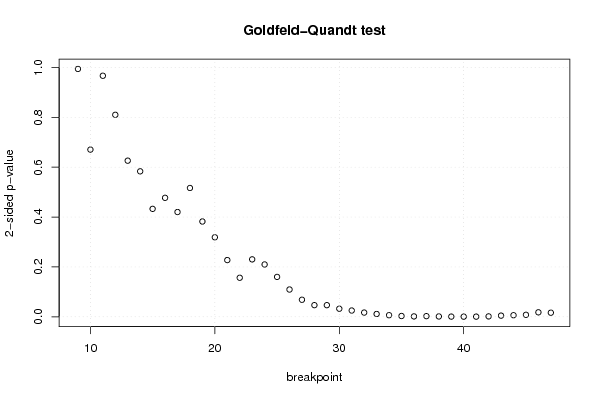
| Goldfeld-Quandt test for Heteroskedasticity | |||
| p-values | Alternative Hypothesis | ||
| breakpoint index | greater | 2-sided | less |
| 9 | 0.496974768679411 | 0.993949537358823 | 0.503025231320589 |
| 10 | 0.33525812504257 | 0.67051625008514 | 0.66474187495743 |
| 11 | 0.483334929740901 | 0.966669859481802 | 0.516665070259099 |
| 12 | 0.405026140458623 | 0.810052280917246 | 0.594973859541377 |
| 13 | 0.313067085638713 | 0.626134171277425 | 0.686932914361287 |
| 14 | 0.291702957379306 | 0.583405914758612 | 0.708297042620694 |
| 15 | 0.216466296204152 | 0.432932592408305 | 0.783533703795848 |
| 16 | 0.238570409634258 | 0.477140819268516 | 0.761429590365742 |
| 17 | 0.210069613222579 | 0.420139226445159 | 0.78993038677742 |
| 18 | 0.258276415672042 | 0.516552831344084 | 0.741723584327958 |
| 19 | 0.19107972013187 | 0.38215944026374 | 0.80892027986813 |
| 20 | 0.159432753429131 | 0.318865506858263 | 0.840567246570869 |
| 21 | 0.113735253324280 | 0.227470506648560 | 0.88626474667572 |
| 22 | 0.0782806326040034 | 0.156561265208007 | 0.921719367395997 |
| 23 | 0.115178083700688 | 0.230356167401376 | 0.884821916299312 |
| 24 | 0.104946813795048 | 0.209893627590096 | 0.895053186204952 |
| 25 | 0.079964605751412 | 0.159929211502824 | 0.920035394248588 |
| 26 | 0.0547237146614571 | 0.109447429322914 | 0.945276285338543 |
| 27 | 0.0341851063691204 | 0.0683702127382408 | 0.96581489363088 |
| 28 | 0.0233631030411595 | 0.046726206082319 | 0.97663689695884 |
| 29 | 0.0233175188109267 | 0.0466350376218534 | 0.976682481189073 |
| 30 | 0.0161936102537599 | 0.0323872205075198 | 0.98380638974624 |
| 31 | 0.0125892433320088 | 0.0251784866640176 | 0.987410756667991 |
| 32 | 0.00848421394679435 | 0.0169684278935887 | 0.991515786053206 |
| 33 | 0.00565132118505816 | 0.0113026423701163 | 0.994348678814942 |
| 34 | 0.00318867771880137 | 0.00637735543760275 | 0.996811322281199 |
| 35 | 0.00160284528968789 | 0.00320569057937579 | 0.998397154710312 |
| 36 | 0.00078229157771132 | 0.00156458315542264 | 0.999217708422289 |
| 37 | 0.00129873383441236 | 0.00259746766882473 | 0.998701266165588 |
| 38 | 0.000693543337269381 | 0.00138708667453876 | 0.99930645666273 |
| 39 | 0.00040240760556238 | 0.00080481521112476 | 0.999597592394438 |
| 40 | 0.000294766327560781 | 0.000589532655121561 | 0.99970523367244 |
| 41 | 0.000322367248992252 | 0.000644734497984504 | 0.999677632751008 |
| 42 | 0.000831085179947803 | 0.00166217035989561 | 0.999168914820052 |
| 43 | 0.00235246909875911 | 0.00470493819751822 | 0.997647530901241 |
| 44 | 0.00317737231068529 | 0.00635474462137059 | 0.996822627689315 |
| 45 | 0.00395303077700117 | 0.00790606155400233 | 0.996046969222999 |
| 46 | 0.00898323892181925 | 0.0179664778436385 | 0.991016761078181 |
| 47 | 0.00822416335619052 | 0.0164483267123810 | 0.99177583664381 |
| Meta Analysis of Goldfeld-Quandt test for Heteroskedasticity | |||
| Description | # significant tests | % significant tests | OK/NOK |
| 1% type I error level | 12 | 0.307692307692308 | NOK |
| 5% type I error level | 20 | 0.512820512820513 | NOK |
| 10% type I error level | 21 | 0.538461538461538 | NOK |