| Multiple Linear Regression - Estimated Regression Equation |
| Y[t] = + 15.1051730064618 + 1.51203729325094`Y[t-1]`[t] -0.615089404620718`Y[t-2]`[t] -0.323100184191052`Y[t-3]`[t] + 0.296459446705439`Y[t-4]`[t] -2.20171905517736M1[t] + 0.712293154424418M2[t] -2.17351756400950M3[t] + 6.28391154924662M4[t] -0.573360721088252M5[t] + 4.54706471258425M6[t] -6.44161928890922M7[t] + 1.40686131961080M8[t] + 1.31742230283138M9[t] + 4.89880448576374M10[t] + 1.11412070259176M11[t] + 0.037816028123414t + e[t] |
| Multiple Linear Regression - Ordinary Least Squares | |||||
| Variable | Parameter | S.D. | T-STAT H0: parameter = 0 | 2-tail p-value | 1-tail p-value |
| (Intercept) | 15.1051730064618 | 9.33752 | 1.6177 | 0.113791 | 0.056896 |
| `Y[t-1]` | 1.51203729325094 | 0.153906 | 9.8244 | 0 | 0 |
| `Y[t-2]` | -0.615089404620718 | 0.280843 | -2.1902 | 0.034558 | 0.017279 |
| `Y[t-3]` | -0.323100184191052 | 0.28643 | -1.128 | 0.266202 | 0.133101 |
| `Y[t-4]` | 0.296459446705439 | 0.160978 | 1.8416 | 0.073146 | 0.036573 |
| M1 | -2.20171905517736 | 2.115769 | -1.0406 | 0.304459 | 0.152229 |
| M2 | 0.712293154424418 | 2.264917 | 0.3145 | 0.754825 | 0.377413 |
| M3 | -2.17351756400950 | 2.441033 | -0.8904 | 0.378706 | 0.189353 |
| M4 | 6.28391154924662 | 2.246145 | 2.7976 | 0.007956 | 0.003978 |
| M5 | -0.573360721088252 | 2.484979 | -0.2307 | 0.81873 | 0.409365 |
| M6 | 4.54706471258425 | 1.943212 | 2.34 | 0.024497 | 0.012248 |
| M7 | -6.44161928890922 | 2.32824 | -2.7667 | 0.008612 | 0.004306 |
| M8 | 1.40686131961080 | 2.335778 | 0.6023 | 0.550454 | 0.275227 |
| M9 | 1.31742230283138 | 2.950369 | 0.4465 | 0.657686 | 0.328843 |
| M10 | 4.89880448576374 | 2.129084 | 2.3009 | 0.026829 | 0.013415 |
| M11 | 1.11412070259176 | 2.324172 | 0.4794 | 0.634358 | 0.317179 |
| t | 0.037816028123414 | 0.025789 | 1.4664 | 0.150564 | 0.075282 |
| Multiple Linear Regression - Regression Statistics | |
| Multiple R | 0.964424788006357 |
| R-squared | 0.930115171721107 |
| Adjusted R-squared | 0.901444472940023 |
| F-TEST (value) | 32.4413150451275 |
| F-TEST (DF numerator) | 16 |
| F-TEST (DF denominator) | 39 |
| p-value | 0 |
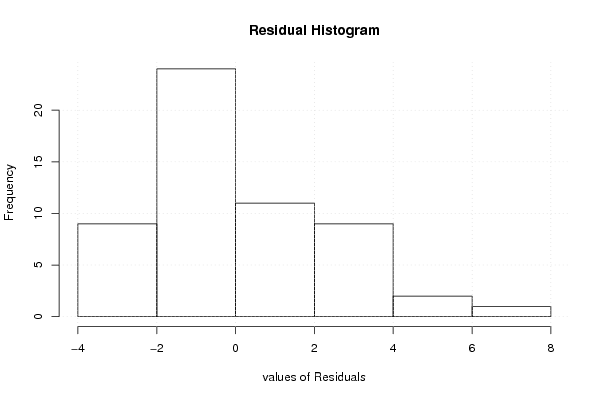
| Multiple Linear Regression - Residual Statistics | |
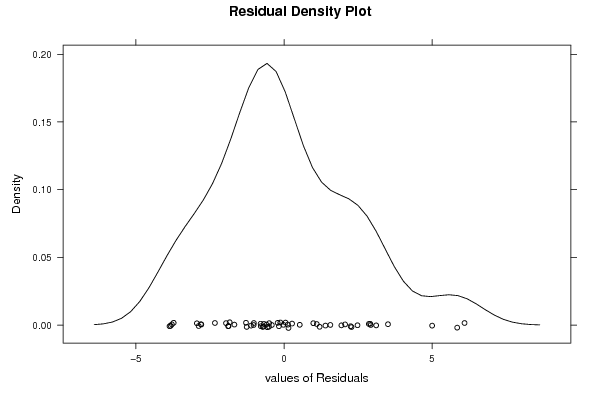
| Residual Standard Deviation | 2.77372047228213 |
| Sum Squared Residuals | 300.047485075922 |
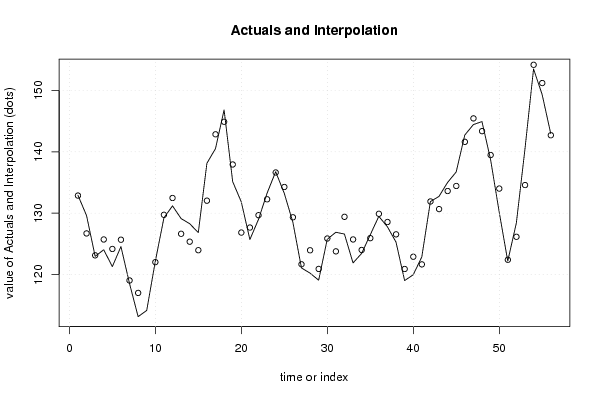
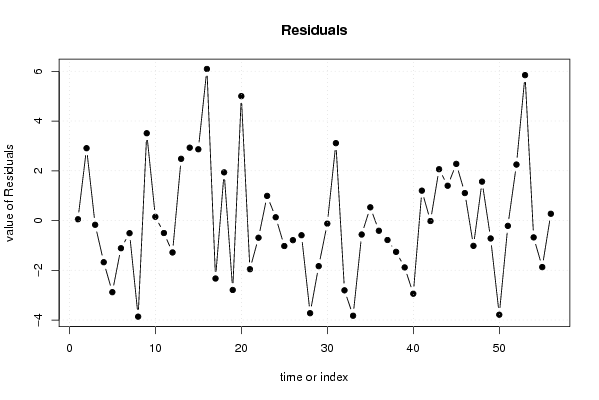
| Multiple Linear Regression - Actuals, Interpolation, and Residuals | |||
| Time or Index | Actuals | Interpolation Forecast | Residuals Prediction Error |
| 1 | 132.92 | 132.869541784987 | 0.0504582150127606 |
| 2 | 129.61 | 126.701864385630 | 2.90813561436963 |
| 3 | 122.96 | 123.131503086918 | -0.171503086917884 |
| 4 | 124.04 | 125.715502053991 | -1.67550205399069 |
| 5 | 121.29 | 124.170979871759 | -2.88097987175857 |
| 6 | 124.56 | 125.674157676400 | -1.11415767639953 |
| 7 | 118.53 | 119.038743995150 | -0.508743995149505 |
| 8 | 113.14 | 117.004815109347 | -3.86481510934728 |
| 9 | 114.15 | 110.640499139187 | 3.50950086081307 |
| 10 | 122.17 | 122.019903408731 | 0.150096591269331 |
| 11 | 129.23 | 129.732193976044 | -0.502193976043713 |
| 12 | 131.19 | 132.473607963094 | -1.28360796309354 |
| 13 | 129.12 | 126.638927398149 | 2.48107260185056 |
| 14 | 128.28 | 125.351780667977 | 2.92821933202262 |
| 15 | 126.83 | 123.966637051627 | 2.86336294837310 |
| 16 | 138.13 | 132.035981114492 | 6.09401888550788 |
| 17 | 140.52 | 142.852159022757 | -2.33215902275655 |
| 18 | 146.83 | 144.893128675053 | 1.93687132494742 |
| 19 | 135.14 | 137.932254065971 | -2.7922540659707 |
| 20 | 131.84 | 126.839402908909 | 5.00059709109134 |
| 21 | 125.7 | 127.658227907921 | -1.95822790792126 |
| 22 | 128.98 | 129.671012435569 | -0.691012435569362 |
| 23 | 133.25 | 132.260895622599 | 0.989104377401063 |
| 24 | 136.76 | 136.629015899961 | 0.130984100038700 |
| 25 | 133.24 | 134.265902407570 | -1.02590240756961 |
| 26 | 128.54 | 129.329144761531 | -0.789144761530856 |
| 27 | 121.08 | 121.671489688127 | -0.591489688127453 |
| 28 | 120.23 | 123.955742129861 | -3.72574212986093 |
| 29 | 119.08 | 120.914654760152 | -1.83465476015155 |
| 30 | 125.75 | 125.873847303186 | -0.12384730318616 |
| 31 | 126.89 | 123.778668575254 | 3.11133142474646 |
| 32 | 126.6 | 129.405616079503 | -2.80561607950294 |
| 33 | 121.89 | 125.718293762271 | -3.82829376227096 |
| 34 | 123.44 | 124.003222549002 | -0.5632225490023 |
| 35 | 126.46 | 125.928746516916 | 0.531253483084114 |
| 36 | 129.49 | 129.901234518899 | -0.41123451889852 |
| 37 | 127.78 | 128.564105208962 | -0.784105208961647 |
| 38 | 125.29 | 126.550378365363 | -1.26037836536338 |
| 39 | 119.02 | 120.905527667711 | -1.88552766771102 |
| 40 | 119.96 | 122.902645036397 | -2.9426450363969 |
| 41 | 122.86 | 121.658688221583 | 1.20131177841736 |
| 42 | 131.89 | 131.911307926044 | -0.0213079260441995 |
| 43 | 132.73 | 130.667862533347 | 2.06213746665265 |
| 44 | 135.01 | 133.611694518346 | 1.39830548165445 |
| 45 | 136.71 | 134.432979190621 | 2.27702080937915 |
| 46 | 142.73 | 141.625861606698 | 1.10413839330233 |
| 47 | 144.43 | 145.448163884441 | -1.01816388444147 |
| 48 | 144.93 | 143.366141618047 | 1.56385838195336 |
| 49 | 138.75 | 139.471523200332 | -0.721523200332063 |
| 50 | 130.22 | 134.006831819498 | -3.78683181949801 |
| 51 | 122.19 | 122.404842505617 | -0.214842505616743 |
| 52 | 128.4 | 126.150129665259 | 2.24987033474065 |
| 53 | 140.43 | 134.583518123751 | 5.84648187624932 |
| 54 | 153.5 | 154.177558419318 | -0.677558419317529 |
| 55 | 149.33 | 151.202470830279 | -1.87247083027891 |
| 56 | 142.97 | 142.698471383896 | 0.271528616104431 |
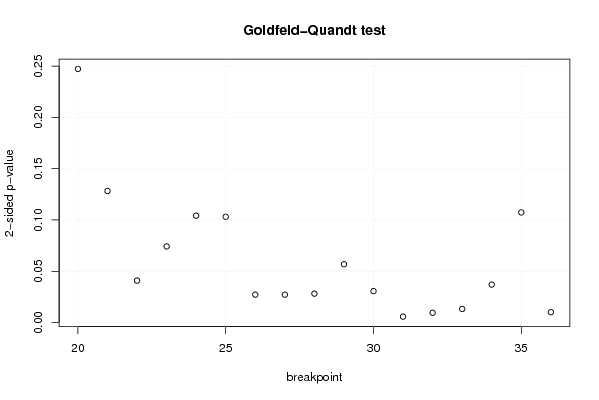
| Goldfeld-Quandt test for Heteroskedasticity | |||
| p-values | Alternative Hypothesis | ||
| breakpoint index | greater | 2-sided | less |
| 20 | 0.87639302704956 | 0.247213945900879 | 0.123606972950440 |
| 21 | 0.935867501611208 | 0.128264996777583 | 0.0641324983887917 |
| 22 | 0.979552272868494 | 0.0408954542630127 | 0.0204477271315063 |
| 23 | 0.962888159266092 | 0.074223681467817 | 0.0371118407339085 |
| 24 | 0.947881345209814 | 0.104237309580372 | 0.0521186547901859 |
| 25 | 0.948436608588008 | 0.103126782823983 | 0.0515633914119915 |
| 26 | 0.986385761098432 | 0.0272284778031352 | 0.0136142389015676 |
| 27 | 0.986405177605871 | 0.0271896447882573 | 0.0135948223941287 |
| 28 | 0.98590624518674 | 0.0281875096265189 | 0.0140937548132594 |
| 29 | 0.971569119500679 | 0.0568617609986418 | 0.0284308804993209 |
| 30 | 0.984689094124772 | 0.0306218117504565 | 0.0153109058752282 |
| 31 | 0.997119704128138 | 0.00576059174372455 | 0.00288029587186228 |
| 32 | 0.995218892634077 | 0.00956221473184612 | 0.00478110736592306 |
| 33 | 0.99336851226078 | 0.0132629754784413 | 0.00663148773922064 |
| 34 | 0.98150546531639 | 0.0369890693672174 | 0.0184945346836087 |
| 35 | 0.946318451535634 | 0.107363096928732 | 0.0536815484643659 |
| 36 | 0.994954098083264 | 0.0100918038334716 | 0.00504590191673582 |
| Meta Analysis of Goldfeld-Quandt test for Heteroskedasticity | |||
| Description | # significant tests | % significant tests | OK/NOK |
| 1% type I error level | 2 | 0.117647058823529 | NOK |
| 5% type I error level | 10 | 0.588235294117647 | NOK |
| 10% type I error level | 12 | 0.705882352941177 | NOK |