| Multiple Linear Regression - Estimated Regression Equation |
| Y[t] = + 104.978382790316 + 1.33316588097806X[t] -0.0404063636190839`Y-1`[t] + 0.149771378690737`Y-2`[t] + 15.9683744756981M1[t] -10.3645147838434M2[t] + 23.2324200251082M3[t] + 50.5247874887435M4[t] -76.4952318017308M5[t] -150.366438656282M6[t] + 89.9676465933025M7[t] + 92.380418573932M8[t] -18.7460270834543M9[t] -2.90954882184988M10[t] + 4.9443989866286M11[t] + 0.819374350182732t + e[t] |
| Multiple Linear Regression - Ordinary Least Squares | |||||
| Variable | Parameter | S.D. | T-STAT H0: parameter = 0 | 2-tail p-value | 1-tail p-value |
| (Intercept) | 104.978382790316 | 95.582205 | 1.0983 | 0.278328 | 0.139164 |
| X | 1.33316588097806 | 0.168793 | 7.8982 | 0 | 0 |
| `Y-1` | -0.0404063636190839 | 0.112674 | -0.3586 | 0.721681 | 0.36084 |
| `Y-2` | 0.149771378690737 | 0.105295 | 1.4224 | 0.162297 | 0.081149 |
| M1 | 15.9683744756981 | 27.845693 | 0.5735 | 0.569392 | 0.284696 |
| M2 | -10.3645147838434 | 25.659976 | -0.4039 | 0.688323 | 0.344161 |
| M3 | 23.2324200251082 | 27.416124 | 0.8474 | 0.401575 | 0.200788 |
| M4 | 50.5247874887435 | 28.806008 | 1.754 | 0.086731 | 0.043366 |
| M5 | -76.4952318017308 | 35.512308 | -2.154 | 0.037021 | 0.01851 |
| M6 | -150.366438656282 | 44.611142 | -3.3706 | 0.001618 | 0.000809 |
| M7 | 89.9676465933025 | 52.117241 | 1.7263 | 0.091652 | 0.045826 |
| M8 | 92.380418573932 | 44.592746 | 2.0716 | 0.044477 | 0.022238 |
| M9 | -18.7460270834543 | 30.517866 | -0.6143 | 0.542354 | 0.271177 |
| M10 | -2.90954882184988 | 28.604565 | -0.1017 | 0.919466 | 0.459733 |
| M11 | 4.9443989866286 | 27.515537 | 0.1797 | 0.858256 | 0.429128 |
| t | 0.819374350182732 | 0.300993 | 2.7222 | 0.0094 | 0.0047 |
| Multiple Linear Regression - Regression Statistics | |
| Multiple R | 0.975945174039772 |
| R-squared | 0.95246898273152 |
| Adjusted R-squared | 0.935493619421349 |
| F-TEST (value) | 56.1089011957001 |
| F-TEST (DF numerator) | 15 |
| F-TEST (DF denominator) | 42 |
| p-value | 0 |
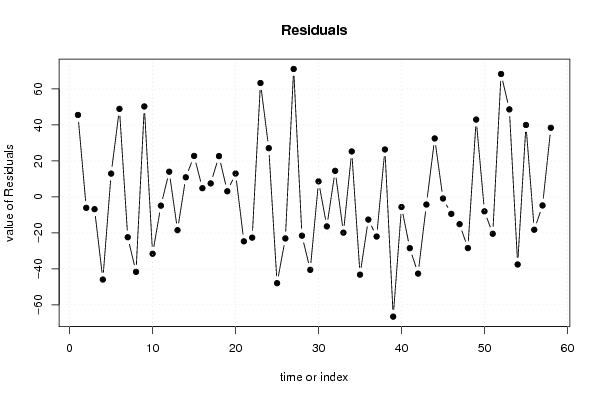
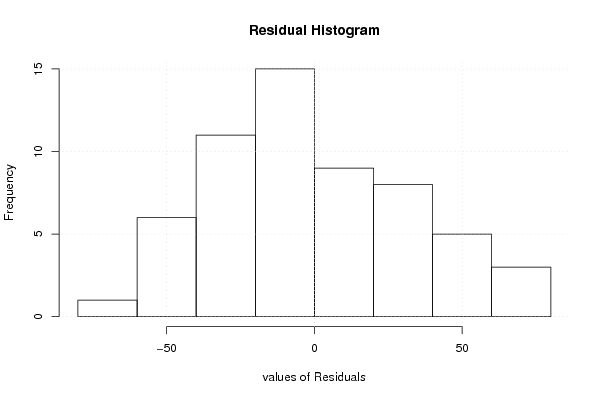
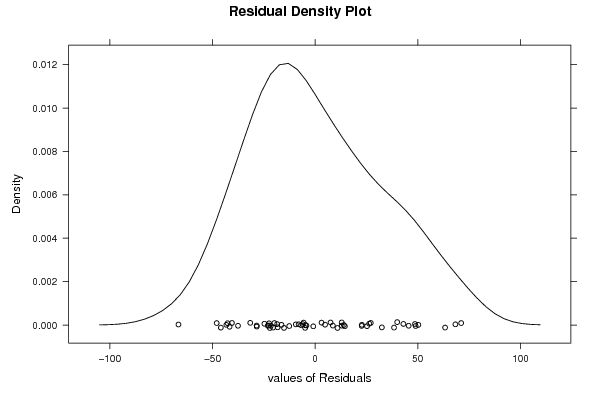
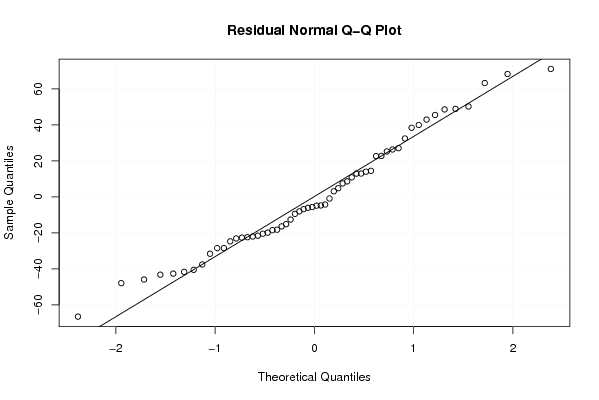
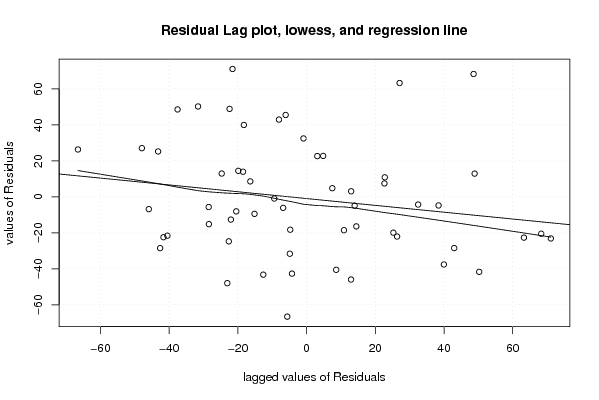
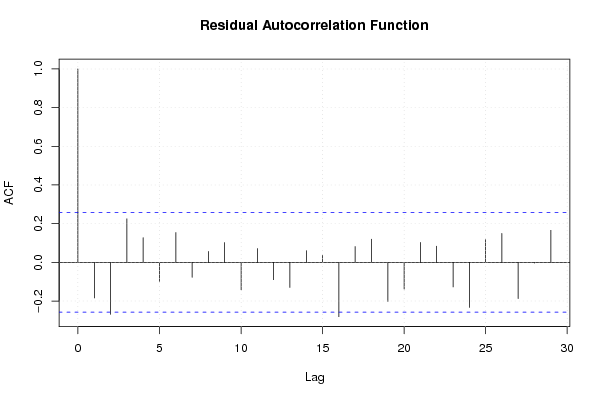
| Multiple Linear Regression - Residual Statistics | |
| Residual Standard Deviation | 37.3795930765591 |
| Sum Squared Residuals | 58683.827099904 |
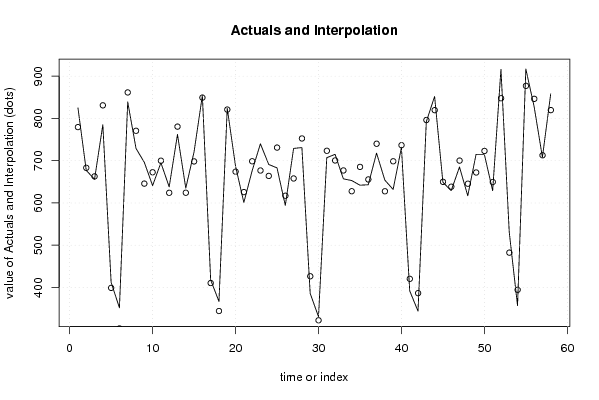
| Multiple Linear Regression - Actuals, Interpolation, and Residuals | |||
| Time or Index | Actuals | Interpolation Forecast | Residuals Prediction Error |
| 1 | 825 | 779.475608130668 | 45.5243918693321 |
| 2 | 677 | 683.093442228357 | -6.0934422283567 |
| 3 | 656 | 662.820448195537 | -6.82044819553671 |
| 4 | 785 | 830.927631197472 | -45.9276311974719 |
| 5 | 412 | 399.073374939705 | 12.9266250602948 |
| 6 | 352 | 303.087491034303 | 48.9125089656967 |
| 7 | 839 | 861.420723111472 | -22.4207231114720 |
| 8 | 729 | 770.663559470421 | -41.6635594704212 |
| 9 | 696 | 645.75140379622 | 50.2485962037806 |
| 10 | 641 | 672.595966490038 | -31.5959664900384 |
| 11 | 695 | 699.879837246604 | -4.87983724660396 |
| 12 | 638 | 624.009812621746 | 13.9901873782538 |
| 13 | 762 | 780.505469078087 | -18.5054690780867 |
| 14 | 635 | 624.12599896852 | 10.8740010314800 |
| 15 | 721 | 698.243557836666 | 22.7564421633339 |
| 16 | 854 | 849.174468312128 | 4.82553168787193 |
| 17 | 418 | 410.520304143167 | 7.47969585683312 |
| 18 | 367 | 344.342424280091 | 22.6575757199086 |
| 19 | 824 | 820.885444654357 | 3.11455534564345 |
| 20 | 687 | 674.02911556706 | 12.9708844329398 |
| 21 | 601 | 625.704743208535 | -24.7047432085354 |
| 22 | 676 | 698.640987664726 | -22.6409876647261 |
| 23 | 740 | 676.738669293794 | 63.261330706206 |
| 24 | 691 | 663.929334334817 | 27.0706656651828 |
| 25 | 683 | 730.944173762604 | -47.9441737626042 |
| 26 | 594 | 617.09199346669 | -23.0919934666902 |
| 27 | 729 | 657.905795601331 | 71.0942043986688 |
| 28 | 731 | 752.555642005693 | -21.5556420056934 |
| 29 | 386 | 426.520950100033 | -40.5209501000329 |
| 30 | 331 | 322.381215848376 | 8.6187841516245 |
| 31 | 707 | 723.392943112444 | -16.3929431124440 |
| 32 | 715 | 700.528539132534 | 14.4714608674659 |
| 33 | 657 | 676.87507056659 | -19.8750705665903 |
| 34 | 653 | 627.748037486951 | 25.2519625130490 |
| 35 | 642 | 685.222378018083 | -43.2223780180825 |
| 36 | 643 | 655.6125861281 | -12.6125861281004 |
| 37 | 718 | 740.037069235623 | -22.0370692356233 |
| 38 | 654 | 627.653397931906 | 26.3466020680939 |
| 39 | 632 | 698.552387741094 | -66.5523877410941 |
| 40 | 731 | 736.632023652018 | -5.63202365201774 |
| 41 | 392 | 420.492452688246 | -28.4924526882461 |
| 42 | 344 | 386.631070988954 | -42.6310709889543 |
| 43 | 792 | 796.257577265702 | -4.25757726570202 |
| 44 | 852 | 819.526286471263 | 32.4737135287366 |
| 45 | 649 | 649.907984069405 | -0.907984069405233 |
| 46 | 629 | 638.424971264057 | -9.42497126405656 |
| 47 | 685 | 700.15911544152 | -15.1591154415196 |
| 48 | 617 | 645.448266915336 | -28.4482669153362 |
| 49 | 715 | 672.037679793018 | 42.962320206982 |
| 50 | 715 | 723.035167404527 | -8.03516740452706 |
| 51 | 629 | 649.477810625372 | -20.4778106253720 |
| 52 | 916 | 847.710234832689 | 68.289765167311 |
| 53 | 531 | 482.392918128849 | 48.6070818711511 |
| 54 | 357 | 394.557797848276 | -37.5577978482756 |
| 55 | 917 | 877.043311856026 | 39.9566881439745 |
| 56 | 828 | 846.252499358721 | -18.2524993587212 |
| 57 | 708 | 712.76079835925 | -4.76079835924968 |
| 58 | 858 | 819.590037094228 | 38.4099629057722 |
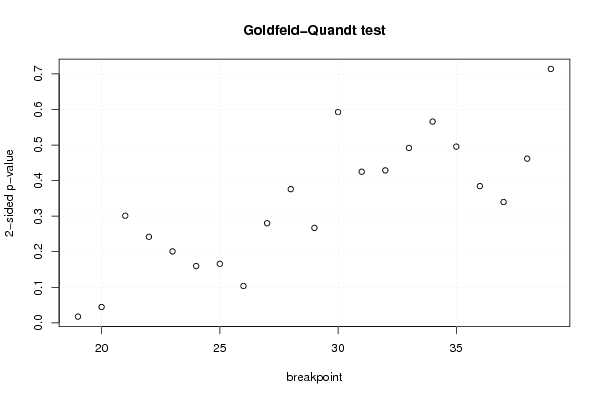
| Goldfeld-Quandt test for Heteroskedasticity | |||
| p-values | Alternative Hypothesis | ||
| breakpoint index | greater | 2-sided | less |
| 19 | 0.00867581611445193 | 0.0173516322289039 | 0.991324183885548 |
| 20 | 0.0222401935198385 | 0.044480387039677 | 0.977759806480161 |
| 21 | 0.150627306227219 | 0.301254612454438 | 0.849372693772781 |
| 22 | 0.121000386617516 | 0.242000773235032 | 0.878999613382484 |
| 23 | 0.100446555046871 | 0.200893110093742 | 0.899553444953129 |
| 24 | 0.0798209523085242 | 0.159641904617048 | 0.920179047691476 |
| 25 | 0.082934159197278 | 0.165868318394556 | 0.917065840802722 |
| 26 | 0.0517558966261964 | 0.103511793252393 | 0.948244103373804 |
| 27 | 0.140035209341851 | 0.280070418683702 | 0.85996479065815 |
| 28 | 0.187995760267349 | 0.375991520534699 | 0.81200423973265 |
| 29 | 0.133533359237555 | 0.267066718475110 | 0.866466640762445 |
| 30 | 0.296489936139878 | 0.592979872279755 | 0.703510063860122 |
| 31 | 0.212496244886223 | 0.424992489772446 | 0.787503755113777 |
| 32 | 0.214404426738184 | 0.428808853476367 | 0.785595573261817 |
| 33 | 0.246005972874933 | 0.492011945749866 | 0.753994027125067 |
| 34 | 0.283063115393004 | 0.566126230786008 | 0.716936884606996 |
| 35 | 0.247846952011914 | 0.495693904023829 | 0.752153047988086 |
| 36 | 0.192281523697100 | 0.384563047394199 | 0.8077184763029 |
| 37 | 0.169909481974896 | 0.339818963949791 | 0.830090518025104 |
| 38 | 0.230885896387156 | 0.461771792774312 | 0.769114103612844 |
| 39 | 0.357062269276144 | 0.714124538552288 | 0.642937730723856 |
| Meta Analysis of Goldfeld-Quandt test for Heteroskedasticity | |||
| Description | # significant tests | % significant tests | OK/NOK |
| 1% type I error level | 0 | 0 | OK |
| 5% type I error level | 2 | 0.0952380952380952 | NOK |
| 10% type I error level | 2 | 0.0952380952380952 | OK |