| Multiple Linear Regression - Estimated Regression Equation |
| ProdInd[t] = -28.7635976658427 + 0.738532559514924ProdMetal[t] + 0.37676744914924`(t-1)`[t] + 0.108262815954371`(t-2)`[t] -0.0945254194298194`(t-3)`[t] + 0.191970290650688`(t-4)`[t] -5.51808609678788M1[t] + 0.0300456353639460M2[t] -6.57335079379142M3[t] -0.65804805502582M4[t] + 4.71602434640368M5[t] -3.84131584547569M6[t] -4.7749612891723M7[t] -4.41089498950224M8[t] + 1.15567643310007M9[t] -1.37956770121052M10[t] + 0.276501934329990M11[t] -0.119210985558996t + e[t] |
| Multiple Linear Regression - Ordinary Least Squares | |||||
| Variable | Parameter | S.D. | T-STAT H0: parameter = 0 | 2-tail p-value | 1-tail p-value |
| (Intercept) | -28.7635976658427 | 29.722414 | -0.9677 | 0.339293 | 0.169647 |
| ProdMetal | 0.738532559514924 | 0.209236 | 3.5297 | 0.001108 | 0.000554 |
| `(t-1)` | 0.37676744914924 | 0.137695 | 2.7363 | 0.009396 | 0.004698 |
| `(t-2)` | 0.108262815954371 | 0.145371 | 0.7447 | 0.461015 | 0.230507 |
| `(t-3)` | -0.0945254194298194 | 0.150784 | -0.6269 | 0.534478 | 0.267239 |
| `(t-4)` | 0.191970290650688 | 0.151111 | 1.2704 | 0.211668 | 0.105834 |
| M1 | -5.51808609678788 | 3.272756 | -1.6861 | 0.099978 | 0.049989 |
| M2 | 0.0300456353639460 | 3.651686 | 0.0082 | 0.993478 | 0.496739 |
| M3 | -6.57335079379142 | 4.723429 | -1.3916 | 0.172122 | 0.086061 |
| M4 | -0.65804805502582 | 4.834733 | -0.1361 | 0.892454 | 0.446227 |
| M5 | 4.71602434640368 | 4.234953 | 1.1136 | 0.272447 | 0.136224 |
| M6 | -3.84131584547569 | 4.740351 | -0.8103 | 0.422788 | 0.211394 |
| M7 | -4.7749612891723 | 3.445693 | -1.3858 | 0.173895 | 0.086947 |
| M8 | -4.41089498950224 | 4.092285 | -1.0779 | 0.287893 | 0.143946 |
| M9 | 1.15567643310007 | 4.659351 | 0.248 | 0.805444 | 0.402722 |
| M10 | -1.37956770121052 | 4.258068 | -0.324 | 0.747723 | 0.373861 |
| M11 | 0.276501934329990 | 3.70153 | 0.0747 | 0.940846 | 0.470423 |
| t | -0.119210985558996 | 0.043095 | -2.7663 | 0.008707 | 0.004353 |
| Multiple Linear Regression - Regression Statistics | |
| Multiple R | 0.911618262036502 |
| R-squared | 0.831047855678453 |
| Adjusted R-squared | 0.755464001639866 |
| F-TEST (value) | 10.9950447254805 |
| F-TEST (DF numerator) | 17 |
| F-TEST (DF denominator) | 38 |
| p-value | 7.0088868042717e-10 |
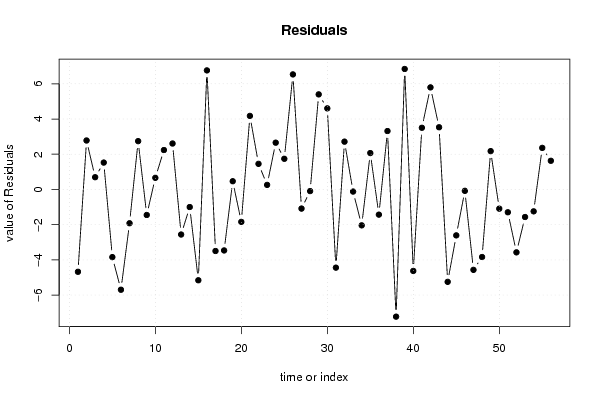
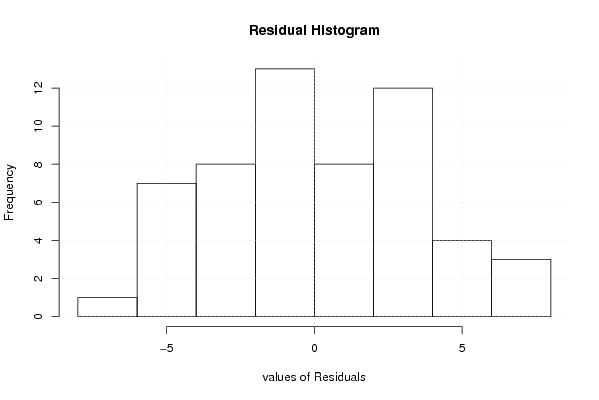
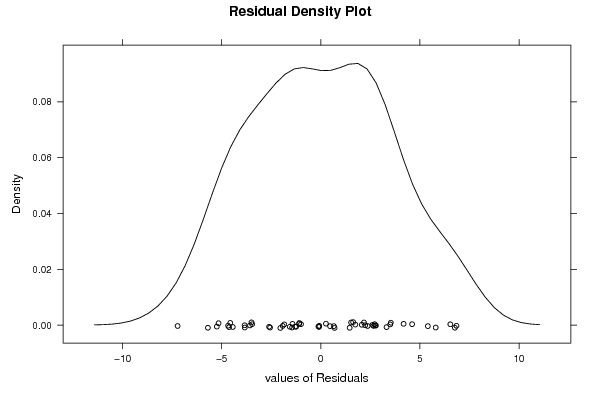
| Multiple Linear Regression - Residual Statistics | |
| Residual Standard Deviation | 4.18799275887399 |
| Sum Squared Residuals | 666.492767238477 |
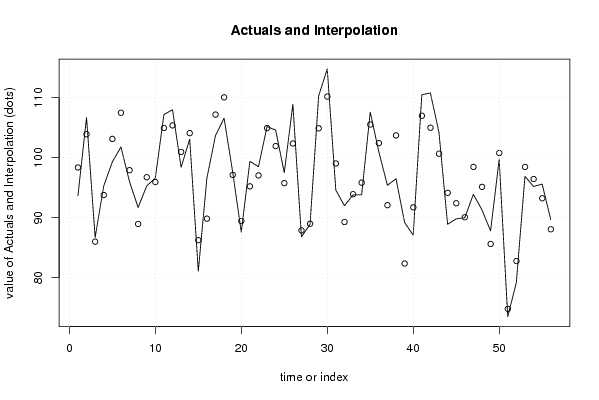
| Multiple Linear Regression - Actuals, Interpolation, and Residuals | |||
| Time or Index | Actuals | Interpolation Forecast | Residuals Prediction Error |
| 1 | 93.7 | 98.3756175004954 | -4.67561750049542 |
| 2 | 106.7 | 103.919190986287 | 2.78080901371347 |
| 3 | 86.7 | 86.0050011018663 | 0.694998898133672 |
| 4 | 95.3 | 93.7724490412261 | 1.52755095877387 |
| 5 | 99.3 | 103.142238291748 | -3.84223829174768 |
| 6 | 101.8 | 107.493612795095 | -5.69361279509457 |
| 7 | 96 | 97.9198206598634 | -1.91982065986336 |
| 8 | 91.7 | 88.9559469402983 | 2.74405305970172 |
| 9 | 95.3 | 96.7487797048248 | -1.44877970482480 |
| 10 | 96.6 | 95.9394771966569 | 0.660522803343128 |
| 11 | 107.2 | 104.960383624940 | 2.23961637505989 |
| 12 | 108 | 105.391639144435 | 2.60836085556484 |
| 13 | 98.4 | 100.959166056141 | -2.5591660561413 |
| 14 | 103.1 | 104.099359386245 | -0.99935938624504 |
| 15 | 81.1 | 86.2569418317945 | -5.1569418317945 |
| 16 | 96.6 | 89.8390538107912 | 6.76094618920879 |
| 17 | 103.7 | 107.195126356733 | -3.4951263567329 |
| 18 | 106.6 | 110.063152898296 | -3.46315289829622 |
| 19 | 97.6 | 97.1330927706594 | 0.466907229340577 |
| 20 | 87.6 | 89.4416464085342 | -1.84164640853419 |
| 21 | 99.4 | 95.2239081791498 | 4.17609182085024 |
| 22 | 98.5 | 97.0447103936469 | 1.45528960635309 |
| 23 | 105.2 | 104.941174646023 | 0.258825353976953 |
| 24 | 104.6 | 101.943226334606 | 2.65677366539401 |
| 25 | 97.5 | 95.7583021830602 | 1.74169781693984 |
| 26 | 108.9 | 102.367731160251 | 6.53226883974914 |
| 27 | 86.8 | 87.8856161038741 | -1.08561610387412 |
| 28 | 88.9 | 88.991623035111 | -0.0916230351109470 |
| 29 | 110.3 | 104.901306950830 | 5.39869304916957 |
| 30 | 114.8 | 110.195616044585 | 4.6043839554148 |
| 31 | 94.6 | 99.0392140640964 | -4.43921406409636 |
| 32 | 92 | 89.2853378605804 | 2.71466213941961 |
| 33 | 93.8 | 93.919635272921 | -0.119635272921060 |
| 34 | 93.8 | 95.8383698835275 | -2.03836988352756 |
| 35 | 107.6 | 105.533029005985 | 2.06697099401513 |
| 36 | 101 | 102.429819290444 | -1.42981929044368 |
| 37 | 95.4 | 92.0835013497213 | 3.31649865027871 |
| 38 | 96.5 | 103.722994840857 | -7.22299484085696 |
| 39 | 89.2 | 82.3568362017204 | 6.84316379827958 |
| 40 | 87.1 | 91.7261591636401 | -4.6261591636401 |
| 41 | 110.5 | 106.997092070422 | 3.50290792957818 |
| 42 | 110.8 | 105.004326444968 | 5.79567355503178 |
| 43 | 104.2 | 100.668362021947 | 3.53163797805325 |
| 44 | 88.9 | 94.1453737045506 | -5.24537370455059 |
| 45 | 89.8 | 92.4076768431044 | -2.60767684310438 |
| 46 | 90 | 90.0774425261687 | -0.0774425261686619 |
| 47 | 93.9 | 98.465412723052 | -4.56541272305198 |
| 48 | 91.3 | 95.1353152305152 | -3.83531523051518 |
| 49 | 87.8 | 85.6234129105818 | 2.17658708941816 |
| 50 | 99.7 | 100.790723626361 | -1.09072362636061 |
| 51 | 73.5 | 74.7956047607446 | -1.29560476074463 |
| 52 | 79.2 | 82.7707149492316 | -3.5707149492316 |
| 53 | 96.9 | 98.4642363302672 | -1.56423633026717 |
| 54 | 95.2 | 96.4432918170558 | -1.24329181705579 |
| 55 | 95.6 | 93.239510483434 | 2.36048951656589 |
| 56 | 89.7 | 88.0716950860366 | 1.62830491396345 |
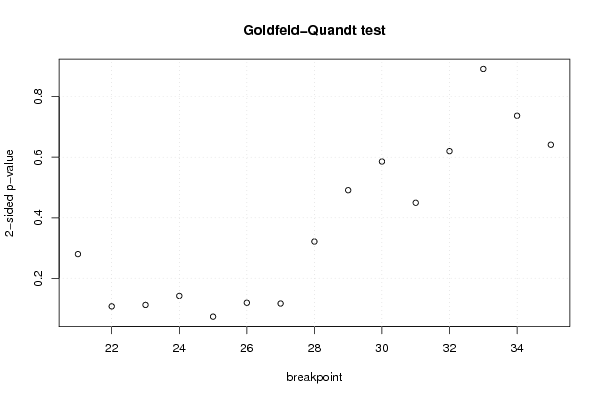
| Goldfeld-Quandt test for Heteroskedasticity | |||
| p-values | Alternative Hypothesis | ||
| breakpoint index | greater | 2-sided | less |
| 21 | 0.139977468113135 | 0.279954936226271 | 0.860022531886865 |
| 22 | 0.0536311838861539 | 0.107262367772308 | 0.946368816113846 |
| 23 | 0.0560240939835708 | 0.112048187967142 | 0.94397590601643 |
| 24 | 0.070853040187893 | 0.141706080375786 | 0.929146959812107 |
| 25 | 0.0366194957169194 | 0.0732389914338388 | 0.96338050428308 |
| 26 | 0.0595845327433744 | 0.119169065486749 | 0.940415467256626 |
| 27 | 0.0582904022099199 | 0.116580804419840 | 0.94170959779008 |
| 28 | 0.160675269384022 | 0.321350538768045 | 0.839324730615978 |
| 29 | 0.24548872343958 | 0.49097744687916 | 0.75451127656042 |
| 30 | 0.292875574557891 | 0.585751149115782 | 0.707124425442109 |
| 31 | 0.224751868008774 | 0.449503736017548 | 0.775248131991226 |
| 32 | 0.310004456858406 | 0.620008913716812 | 0.689995543141594 |
| 33 | 0.445809408433609 | 0.891618816867218 | 0.554190591566391 |
| 34 | 0.368518475099896 | 0.737036950199792 | 0.631481524900104 |
| 35 | 0.320591608530602 | 0.641183217061205 | 0.679408391469398 |
| Meta Analysis of Goldfeld-Quandt test for Heteroskedasticity | |||
| Description | # significant tests | % significant tests | OK/NOK |
| 1% type I error level | 0 | 0 | OK |
| 5% type I error level | 0 | 0 | OK |
| 10% type I error level | 1 | 0.0666666666666667 | OK |