Free Statistics

of Irreproducible Research!

Author's title

Author*The author of this computation has been verified*
R Software Modulerwasp_multipleregression.wasp
Title produced by softwareMultiple Regression
Date of computationTue, 24 Nov 2009 12:58:11 -0700
Cite this page as followsStatistical Computations at FreeStatistics.org, Office for Research Development and Education, URL https://freestatistics.org/blog/index.php?v=date/2009/Nov/24/t1259093370tsyt3xm9zt39617.htm/, Retrieved Sat, 20 Apr 2024 07:38:50 +0000
Statistical Computations at FreeStatistics.org, Office for Research Development and Education, URL https://freestatistics.org/blog/index.php?pk=59259, Retrieved Sat, 20 Apr 2024 07:38:50 +0000
QR Codes:

Original text written by user:
IsPrivate?No (this computation is public)
User-defined keywords
Estimated Impact112
Family? (F = Feedback message, R = changed R code, M = changed R Module, P = changed Parameters, D = changed Data)
-       [Multiple Regression] [] [2009-11-24 19:58:11] [21503129a47c64de7f80e1fde84c3a45] [Current]
Feedback Forum

Post a new message
Dataseries X:
101.9	93.7	95.7	107.2	98.6	99.9
106.2	106.7	93.7	95.7	107.2	98.6
81	86.7	106.7	93.7	95.7	107.2
94.7	95.3	86.7	106.7	93.7	95.7
101	99.3	95.3	86.7	106.7	93.7
109.4	101.8	99.3	95.3	86.7	106.7
102.3	96	101.8	99.3	95.3	86.7
90.7	91.7	96	101.8	99.3	95.3
96.2	95.3	91.7	96	101.8	99.3
96.1	96.6	95.3	91.7	96	101.8
106	107.2	96.6	95.3	91.7	96
103.1	108	107.2	96.6	95.3	91.7
102	98.4	108	107.2	96.6	95.3
104.7	103.1	98.4	108	107.2	96.6
86	81.1	103.1	98.4	108	107.2
92.1	96.6	81.1	103.1	98.4	108
106.9	103.7	96.6	81.1	103.1	98.4
112.6	106.6	103.7	96.6	81.1	103.1
101.7	97.6	106.6	103.7	96.6	81.1
92	87.6	97.6	106.6	103.7	96.6
97.4	99.4	87.6	97.6	106.6	103.7
97	98.5	99.4	87.6	97.6	106.6
105.4	105.2	98.5	99.4	87.6	97.6
102.7	104.6	105.2	98.5	99.4	87.6
98.1	97.5	104.6	105.2	98.5	99.4
104.5	108.9	97.5	104.6	105.2	98.5
87.4	86.8	108.9	97.5	104.6	105.2
89.9	88.9	86.8	108.9	97.5	104.6
109.8	110.3	88.9	86.8	108.9	97.5
111.7	114.8	110.3	88.9	86.8	108.9
98.6	94.6	114.8	110.3	88.9	86.8
96.9	92	94.6	114.8	110.3	88.9
95.1	93.8	92	94.6	114.8	110.3
97	93.8	93.8	92	94.6	114.8
112.7	107.6	93.8	93.8	92	94.6
102.9	101	107.6	93.8	93.8	92
97.4	95.4	101	107.6	93.8	93.8
111.4	96.5	95.4	101	107.6	93.8
87.4	89.2	96.5	95.4	101	107.6
96.8	87.1	89.2	96.5	95.4	101
114.1	110.5	87.1	89.2	96.5	95.4
110.3	110.8	110.5	87.1	89.2	96.5
103.9	104.2	110.8	110.5	87.1	89.2
101.6	88.9	104.2	110.8	110.5	87.1
94.6	89.8	88.9	104.2	110.8	110.5
95.9	90	89.8	88.9	104.2	110.8
104.7	93.9	90	89.8	88.9	104.2
102.8	91.3	93.9	90	89.8	88.9
98.1	87.8	91.3	93.9	90	89.8
113.9	99.7	87.8	91.3	93.9	90
80.9	73.5	99.7	87.8	91.3	93.9
95.7	79.2	73.5	99.7	87.8	91.3
113.2	96.9	79.2	73.5	99.7	87.8
105.9	95.2	96.9	79.2	73.5	99.7
108.8	95.6	95.2	96.9	79.2	73.5
102.3	89.7	95.6	95.2	96.9	79.2


Summary of computational transaction
Raw Inputview raw input (R code)
Raw Outputview raw output of R engine
Computing time4 seconds
R Server'Gwilym Jenkins' @ 72.249.127.135

\begin{tabular}{lllllllll}
\hline
Summary of computational transaction \tabularnewline
Raw Input & view raw input (R code)  \tabularnewline
Raw Output & view raw output of R engine  \tabularnewline
Computing time & 4 seconds \tabularnewline
R Server & 'Gwilym Jenkins' @ 72.249.127.135 \tabularnewline
\hline
\end{tabular}
%Source: https://freestatistics.org/blog/index.php?pk=59259&T=0

[TABLE]
[ROW][C]Summary of computational transaction[/C][/ROW]
[ROW][C]Raw Input[/C][C]view raw input (R code) [/C][/ROW]
[ROW][C]Raw Output[/C][C]view raw output of R engine [/C][/ROW]
[ROW][C]Computing time[/C][C]4 seconds[/C][/ROW]
[ROW][C]R Server[/C][C]'Gwilym Jenkins' @ 72.249.127.135[/C][/ROW]
[/TABLE]
Source: https://freestatistics.org/blog/index.php?pk=59259&T=0

Globally Unique Identifier (entire table): ba.freestatistics.org/blog/index.php?pk=59259&T=0

As an alternative you can also use a QR Code:  

The GUIDs for individual cells are displayed in the table below:

Summary of computational transaction
Raw Inputview raw input (R code)
Raw Outputview raw output of R engine
Computing time4 seconds
R Server'Gwilym Jenkins' @ 72.249.127.135


Multiple Linear Regression - Estimated Regression Equation
ProdInd[t] = -28.7635976658427 + 0.738532559514924ProdMetal[t] + 0.37676744914924`(t-1)`[t] + 0.108262815954371`(t-2)`[t] -0.0945254194298194`(t-3)`[t] + 0.191970290650688`(t-4)`[t] -5.51808609678788M1[t] + 0.0300456353639460M2[t] -6.57335079379142M3[t] -0.65804805502582M4[t] + 4.71602434640368M5[t] -3.84131584547569M6[t] -4.7749612891723M7[t] -4.41089498950224M8[t] + 1.15567643310007M9[t] -1.37956770121052M10[t] + 0.276501934329990M11[t] -0.119210985558996t + e[t]

\begin{tabular}{lllllllll}
\hline
Multiple Linear Regression - Estimated Regression Equation \tabularnewline
ProdInd[t] =  -28.7635976658427 +  0.738532559514924ProdMetal[t] +  0.37676744914924`(t-1)`[t] +  0.108262815954371`(t-2)`[t] -0.0945254194298194`(t-3)`[t] +  0.191970290650688`(t-4)`[t] -5.51808609678788M1[t] +  0.0300456353639460M2[t] -6.57335079379142M3[t] -0.65804805502582M4[t] +  4.71602434640368M5[t] -3.84131584547569M6[t] -4.7749612891723M7[t] -4.41089498950224M8[t] +  1.15567643310007M9[t] -1.37956770121052M10[t] +  0.276501934329990M11[t] -0.119210985558996t  + e[t] \tabularnewline
\hline
\end{tabular}
%Source: https://freestatistics.org/blog/index.php?pk=59259&T=1

[TABLE]
[ROW][C]Multiple Linear Regression - Estimated Regression Equation[/C][/ROW]
[ROW][C]ProdInd[t] =  -28.7635976658427 +  0.738532559514924ProdMetal[t] +  0.37676744914924`(t-1)`[t] +  0.108262815954371`(t-2)`[t] -0.0945254194298194`(t-3)`[t] +  0.191970290650688`(t-4)`[t] -5.51808609678788M1[t] +  0.0300456353639460M2[t] -6.57335079379142M3[t] -0.65804805502582M4[t] +  4.71602434640368M5[t] -3.84131584547569M6[t] -4.7749612891723M7[t] -4.41089498950224M8[t] +  1.15567643310007M9[t] -1.37956770121052M10[t] +  0.276501934329990M11[t] -0.119210985558996t  + e[t][/C][/ROW]
[/TABLE]
Source: https://freestatistics.org/blog/index.php?pk=59259&T=1

Globally Unique Identifier (entire table): ba.freestatistics.org/blog/index.php?pk=59259&T=1

As an alternative you can also use a QR Code:  

The GUIDs for individual cells are displayed in the table below:

Multiple Linear Regression - Estimated Regression Equation
ProdInd[t] = -28.7635976658427 + 0.738532559514924ProdMetal[t] + 0.37676744914924`(t-1)`[t] + 0.108262815954371`(t-2)`[t] -0.0945254194298194`(t-3)`[t] + 0.191970290650688`(t-4)`[t] -5.51808609678788M1[t] + 0.0300456353639460M2[t] -6.57335079379142M3[t] -0.65804805502582M4[t] + 4.71602434640368M5[t] -3.84131584547569M6[t] -4.7749612891723M7[t] -4.41089498950224M8[t] + 1.15567643310007M9[t] -1.37956770121052M10[t] + 0.276501934329990M11[t] -0.119210985558996t + e[t]


Multiple Linear Regression - Ordinary Least Squares
VariableParameterS.D.T-STATH0: parameter = 02-tail p-value1-tail p-value
(Intercept)-28.763597665842729.722414-0.96770.3392930.169647
ProdMetal0.7385325595149240.2092363.52970.0011080.000554
`(t-1)`0.376767449149240.1376952.73630.0093960.004698
`(t-2)`0.1082628159543710.1453710.74470.4610150.230507
`(t-3)`-0.09452541942981940.150784-0.62690.5344780.267239
`(t-4)`0.1919702906506880.1511111.27040.2116680.105834
M1-5.518086096787883.272756-1.68610.0999780.049989
M20.03004563536394603.6516860.00820.9934780.496739
M3-6.573350793791424.723429-1.39160.1721220.086061
M4-0.658048055025824.834733-0.13610.8924540.446227
M54.716024346403684.2349531.11360.2724470.136224
M6-3.841315845475694.740351-0.81030.4227880.211394
M7-4.77496128917233.445693-1.38580.1738950.086947
M8-4.410894989502244.092285-1.07790.2878930.143946
M91.155676433100074.6593510.2480.8054440.402722
M10-1.379567701210524.258068-0.3240.7477230.373861
M110.2765019343299903.701530.07470.9408460.470423
t-0.1192109855589960.043095-2.76630.0087070.004353

\begin{tabular}{lllllllll}
\hline
Multiple Linear Regression - Ordinary Least Squares \tabularnewline
Variable & Parameter & S.D. & T-STATH0: parameter = 0 & 2-tail p-value & 1-tail p-value \tabularnewline
(Intercept) & -28.7635976658427 & 29.722414 & -0.9677 & 0.339293 & 0.169647 \tabularnewline
ProdMetal & 0.738532559514924 & 0.209236 & 3.5297 & 0.001108 & 0.000554 \tabularnewline
`(t-1)` & 0.37676744914924 & 0.137695 & 2.7363 & 0.009396 & 0.004698 \tabularnewline
`(t-2)` & 0.108262815954371 & 0.145371 & 0.7447 & 0.461015 & 0.230507 \tabularnewline
`(t-3)` & -0.0945254194298194 & 0.150784 & -0.6269 & 0.534478 & 0.267239 \tabularnewline
`(t-4)` & 0.191970290650688 & 0.151111 & 1.2704 & 0.211668 & 0.105834 \tabularnewline
M1 & -5.51808609678788 & 3.272756 & -1.6861 & 0.099978 & 0.049989 \tabularnewline
M2 & 0.0300456353639460 & 3.651686 & 0.0082 & 0.993478 & 0.496739 \tabularnewline
M3 & -6.57335079379142 & 4.723429 & -1.3916 & 0.172122 & 0.086061 \tabularnewline
M4 & -0.65804805502582 & 4.834733 & -0.1361 & 0.892454 & 0.446227 \tabularnewline
M5 & 4.71602434640368 & 4.234953 & 1.1136 & 0.272447 & 0.136224 \tabularnewline
M6 & -3.84131584547569 & 4.740351 & -0.8103 & 0.422788 & 0.211394 \tabularnewline
M7 & -4.7749612891723 & 3.445693 & -1.3858 & 0.173895 & 0.086947 \tabularnewline
M8 & -4.41089498950224 & 4.092285 & -1.0779 & 0.287893 & 0.143946 \tabularnewline
M9 & 1.15567643310007 & 4.659351 & 0.248 & 0.805444 & 0.402722 \tabularnewline
M10 & -1.37956770121052 & 4.258068 & -0.324 & 0.747723 & 0.373861 \tabularnewline
M11 & 0.276501934329990 & 3.70153 & 0.0747 & 0.940846 & 0.470423 \tabularnewline
t & -0.119210985558996 & 0.043095 & -2.7663 & 0.008707 & 0.004353 \tabularnewline
\hline
\end{tabular}
%Source: https://freestatistics.org/blog/index.php?pk=59259&T=2

[TABLE]
[ROW][C]Multiple Linear Regression - Ordinary Least Squares[/C][/ROW]
[ROW][C]Variable[/C][C]Parameter[/C][C]S.D.[/C][C]T-STATH0: parameter = 0[/C][C]2-tail p-value[/C][C]1-tail p-value[/C][/ROW]
[ROW][C](Intercept)[/C][C]-28.7635976658427[/C][C]29.722414[/C][C]-0.9677[/C][C]0.339293[/C][C]0.169647[/C][/ROW]
[ROW][C]ProdMetal[/C][C]0.738532559514924[/C][C]0.209236[/C][C]3.5297[/C][C]0.001108[/C][C]0.000554[/C][/ROW]
[ROW][C]`(t-1)`[/C][C]0.37676744914924[/C][C]0.137695[/C][C]2.7363[/C][C]0.009396[/C][C]0.004698[/C][/ROW]
[ROW][C]`(t-2)`[/C][C]0.108262815954371[/C][C]0.145371[/C][C]0.7447[/C][C]0.461015[/C][C]0.230507[/C][/ROW]
[ROW][C]`(t-3)`[/C][C]-0.0945254194298194[/C][C]0.150784[/C][C]-0.6269[/C][C]0.534478[/C][C]0.267239[/C][/ROW]
[ROW][C]`(t-4)`[/C][C]0.191970290650688[/C][C]0.151111[/C][C]1.2704[/C][C]0.211668[/C][C]0.105834[/C][/ROW]
[ROW][C]M1[/C][C]-5.51808609678788[/C][C]3.272756[/C][C]-1.6861[/C][C]0.099978[/C][C]0.049989[/C][/ROW]
[ROW][C]M2[/C][C]0.0300456353639460[/C][C]3.651686[/C][C]0.0082[/C][C]0.993478[/C][C]0.496739[/C][/ROW]
[ROW][C]M3[/C][C]-6.57335079379142[/C][C]4.723429[/C][C]-1.3916[/C][C]0.172122[/C][C]0.086061[/C][/ROW]
[ROW][C]M4[/C][C]-0.65804805502582[/C][C]4.834733[/C][C]-0.1361[/C][C]0.892454[/C][C]0.446227[/C][/ROW]
[ROW][C]M5[/C][C]4.71602434640368[/C][C]4.234953[/C][C]1.1136[/C][C]0.272447[/C][C]0.136224[/C][/ROW]
[ROW][C]M6[/C][C]-3.84131584547569[/C][C]4.740351[/C][C]-0.8103[/C][C]0.422788[/C][C]0.211394[/C][/ROW]
[ROW][C]M7[/C][C]-4.7749612891723[/C][C]3.445693[/C][C]-1.3858[/C][C]0.173895[/C][C]0.086947[/C][/ROW]
[ROW][C]M8[/C][C]-4.41089498950224[/C][C]4.092285[/C][C]-1.0779[/C][C]0.287893[/C][C]0.143946[/C][/ROW]
[ROW][C]M9[/C][C]1.15567643310007[/C][C]4.659351[/C][C]0.248[/C][C]0.805444[/C][C]0.402722[/C][/ROW]
[ROW][C]M10[/C][C]-1.37956770121052[/C][C]4.258068[/C][C]-0.324[/C][C]0.747723[/C][C]0.373861[/C][/ROW]
[ROW][C]M11[/C][C]0.276501934329990[/C][C]3.70153[/C][C]0.0747[/C][C]0.940846[/C][C]0.470423[/C][/ROW]
[ROW][C]t[/C][C]-0.119210985558996[/C][C]0.043095[/C][C]-2.7663[/C][C]0.008707[/C][C]0.004353[/C][/ROW]
[/TABLE]
Source: https://freestatistics.org/blog/index.php?pk=59259&T=2

Globally Unique Identifier (entire table): ba.freestatistics.org/blog/index.php?pk=59259&T=2

As an alternative you can also use a QR Code:  

The GUIDs for individual cells are displayed in the table below:

Multiple Linear Regression - Ordinary Least Squares
VariableParameterS.D.T-STATH0: parameter = 02-tail p-value1-tail p-value
(Intercept)-28.763597665842729.722414-0.96770.3392930.169647
ProdMetal0.7385325595149240.2092363.52970.0011080.000554
`(t-1)`0.376767449149240.1376952.73630.0093960.004698
`(t-2)`0.1082628159543710.1453710.74470.4610150.230507
`(t-3)`-0.09452541942981940.150784-0.62690.5344780.267239
`(t-4)`0.1919702906506880.1511111.27040.2116680.105834
M1-5.518086096787883.272756-1.68610.0999780.049989
M20.03004563536394603.6516860.00820.9934780.496739
M3-6.573350793791424.723429-1.39160.1721220.086061
M4-0.658048055025824.834733-0.13610.8924540.446227
M54.716024346403684.2349531.11360.2724470.136224
M6-3.841315845475694.740351-0.81030.4227880.211394
M7-4.77496128917233.445693-1.38580.1738950.086947
M8-4.410894989502244.092285-1.07790.2878930.143946
M91.155676433100074.6593510.2480.8054440.402722
M10-1.379567701210524.258068-0.3240.7477230.373861
M110.2765019343299903.701530.07470.9408460.470423
t-0.1192109855589960.043095-2.76630.0087070.004353


Multiple Linear Regression - Regression Statistics
Multiple R0.911618262036502
R-squared0.831047855678453
Adjusted R-squared0.755464001639866
F-TEST (value)10.9950447254805
F-TEST (DF numerator)17
F-TEST (DF denominator)38
p-value7.0088868042717e-10
Multiple Linear Regression - Residual Statistics
Residual Standard Deviation4.18799275887399
Sum Squared Residuals666.492767238477

\begin{tabular}{lllllllll}
\hline
Multiple Linear Regression - Regression Statistics \tabularnewline
Multiple R & 0.911618262036502 \tabularnewline
R-squared & 0.831047855678453 \tabularnewline
Adjusted R-squared & 0.755464001639866 \tabularnewline
F-TEST (value) & 10.9950447254805 \tabularnewline
F-TEST (DF numerator) & 17 \tabularnewline
F-TEST (DF denominator) & 38 \tabularnewline
p-value & 7.0088868042717e-10 \tabularnewline
Multiple Linear Regression - Residual Statistics \tabularnewline
Residual Standard Deviation & 4.18799275887399 \tabularnewline
Sum Squared Residuals & 666.492767238477 \tabularnewline
\hline
\end{tabular}
%Source: https://freestatistics.org/blog/index.php?pk=59259&T=3

[TABLE]
[ROW][C]Multiple Linear Regression - Regression Statistics[/C][/ROW]
[ROW][C]Multiple R[/C][C]0.911618262036502[/C][/ROW]
[ROW][C]R-squared[/C][C]0.831047855678453[/C][/ROW]
[ROW][C]Adjusted R-squared[/C][C]0.755464001639866[/C][/ROW]
[ROW][C]F-TEST (value)[/C][C]10.9950447254805[/C][/ROW]
[ROW][C]F-TEST (DF numerator)[/C][C]17[/C][/ROW]
[ROW][C]F-TEST (DF denominator)[/C][C]38[/C][/ROW]
[ROW][C]p-value[/C][C]7.0088868042717e-10[/C][/ROW]
[ROW][C]Multiple Linear Regression - Residual Statistics[/C][/ROW]
[ROW][C]Residual Standard Deviation[/C][C]4.18799275887399[/C][/ROW]
[ROW][C]Sum Squared Residuals[/C][C]666.492767238477[/C][/ROW]
[/TABLE]
Source: https://freestatistics.org/blog/index.php?pk=59259&T=3

Globally Unique Identifier (entire table): ba.freestatistics.org/blog/index.php?pk=59259&T=3

As an alternative you can also use a QR Code:  

The GUIDs for individual cells are displayed in the table below:

Multiple Linear Regression - Regression Statistics
Multiple R0.911618262036502
R-squared0.831047855678453
Adjusted R-squared0.755464001639866
F-TEST (value)10.9950447254805
F-TEST (DF numerator)17
F-TEST (DF denominator)38
p-value7.0088868042717e-10
Multiple Linear Regression - Residual Statistics
Residual Standard Deviation4.18799275887399
Sum Squared Residuals666.492767238477


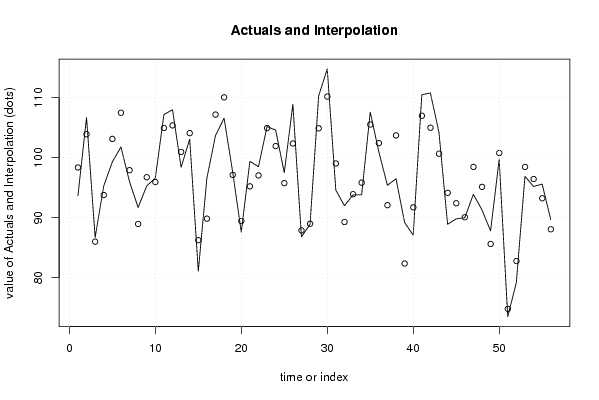
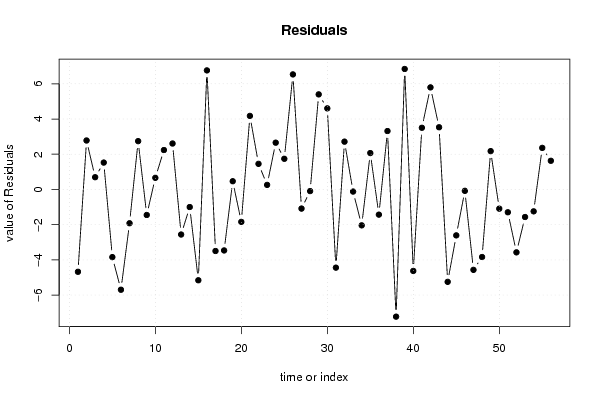
Multiple Linear Regression - Actuals, Interpolation, and Residuals
Time or IndexActualsInterpolationForecastResidualsPrediction Error
193.798.3756175004954-4.67561750049542
2106.7103.9191909862872.78080901371347
386.786.00500110186630.694998898133672
495.393.77244904122611.52755095877387
599.3103.142238291748-3.84223829174768
6101.8107.493612795095-5.69361279509457
79697.9198206598634-1.91982065986336
891.788.95594694029832.74405305970172
995.396.7487797048248-1.44877970482480
1096.695.93947719665690.660522803343128
11107.2104.9603836249402.23961637505989
12108105.3916391444352.60836085556484
1398.4100.959166056141-2.5591660561413
14103.1104.099359386245-0.99935938624504
1581.186.2569418317945-5.1569418317945
1696.689.83905381079126.76094618920879
17103.7107.195126356733-3.4951263567329
18106.6110.063152898296-3.46315289829622
1997.697.13309277065940.466907229340577
2087.689.4416464085342-1.84164640853419
2199.495.22390817914984.17609182085024
2298.597.04471039364691.45528960635309
23105.2104.9411746460230.258825353976953
24104.6101.9432263346062.65677366539401
2597.595.75830218306021.74169781693984
26108.9102.3677311602516.53226883974914
2786.887.8856161038741-1.08561610387412
2888.988.991623035111-0.0916230351109470
29110.3104.9013069508305.39869304916957
30114.8110.1956160445854.6043839554148
3194.699.0392140640964-4.43921406409636
329289.28533786058042.71466213941961
3393.893.919635272921-0.119635272921060
3493.895.8383698835275-2.03836988352756
35107.6105.5330290059852.06697099401513
36101102.429819290444-1.42981929044368
3795.492.08350134972133.31649865027871
3896.5103.722994840857-7.22299484085696
3989.282.35683620172046.84316379827958
4087.191.7261591636401-4.6261591636401
41110.5106.9970920704223.50290792957818
42110.8105.0043264449685.79567355503178
43104.2100.6683620219473.53163797805325
4488.994.1453737045506-5.24537370455059
4589.892.4076768431044-2.60767684310438
469090.0774425261687-0.0774425261686619
4793.998.465412723052-4.56541272305198
4891.395.1353152305152-3.83531523051518
4987.885.62341291058182.17658708941816
5099.7100.790723626361-1.09072362636061
5173.574.7956047607446-1.29560476074463
5279.282.7707149492316-3.5707149492316
5396.998.4642363302672-1.56423633026717
5495.296.4432918170558-1.24329181705579
5595.693.2395104834342.36048951656589
5689.788.07169508603661.62830491396345

\begin{tabular}{lllllllll}
\hline
Multiple Linear Regression - Actuals, Interpolation, and Residuals \tabularnewline
Time or Index & Actuals & InterpolationForecast & ResidualsPrediction Error \tabularnewline
1 & 93.7 & 98.3756175004954 & -4.67561750049542 \tabularnewline
2 & 106.7 & 103.919190986287 & 2.78080901371347 \tabularnewline
3 & 86.7 & 86.0050011018663 & 0.694998898133672 \tabularnewline
4 & 95.3 & 93.7724490412261 & 1.52755095877387 \tabularnewline
5 & 99.3 & 103.142238291748 & -3.84223829174768 \tabularnewline
6 & 101.8 & 107.493612795095 & -5.69361279509457 \tabularnewline
7 & 96 & 97.9198206598634 & -1.91982065986336 \tabularnewline
8 & 91.7 & 88.9559469402983 & 2.74405305970172 \tabularnewline
9 & 95.3 & 96.7487797048248 & -1.44877970482480 \tabularnewline
10 & 96.6 & 95.9394771966569 & 0.660522803343128 \tabularnewline
11 & 107.2 & 104.960383624940 & 2.23961637505989 \tabularnewline
12 & 108 & 105.391639144435 & 2.60836085556484 \tabularnewline
13 & 98.4 & 100.959166056141 & -2.5591660561413 \tabularnewline
14 & 103.1 & 104.099359386245 & -0.99935938624504 \tabularnewline
15 & 81.1 & 86.2569418317945 & -5.1569418317945 \tabularnewline
16 & 96.6 & 89.8390538107912 & 6.76094618920879 \tabularnewline
17 & 103.7 & 107.195126356733 & -3.4951263567329 \tabularnewline
18 & 106.6 & 110.063152898296 & -3.46315289829622 \tabularnewline
19 & 97.6 & 97.1330927706594 & 0.466907229340577 \tabularnewline
20 & 87.6 & 89.4416464085342 & -1.84164640853419 \tabularnewline
21 & 99.4 & 95.2239081791498 & 4.17609182085024 \tabularnewline
22 & 98.5 & 97.0447103936469 & 1.45528960635309 \tabularnewline
23 & 105.2 & 104.941174646023 & 0.258825353976953 \tabularnewline
24 & 104.6 & 101.943226334606 & 2.65677366539401 \tabularnewline
25 & 97.5 & 95.7583021830602 & 1.74169781693984 \tabularnewline
26 & 108.9 & 102.367731160251 & 6.53226883974914 \tabularnewline
27 & 86.8 & 87.8856161038741 & -1.08561610387412 \tabularnewline
28 & 88.9 & 88.991623035111 & -0.0916230351109470 \tabularnewline
29 & 110.3 & 104.901306950830 & 5.39869304916957 \tabularnewline
30 & 114.8 & 110.195616044585 & 4.6043839554148 \tabularnewline
31 & 94.6 & 99.0392140640964 & -4.43921406409636 \tabularnewline
32 & 92 & 89.2853378605804 & 2.71466213941961 \tabularnewline
33 & 93.8 & 93.919635272921 & -0.119635272921060 \tabularnewline
34 & 93.8 & 95.8383698835275 & -2.03836988352756 \tabularnewline
35 & 107.6 & 105.533029005985 & 2.06697099401513 \tabularnewline
36 & 101 & 102.429819290444 & -1.42981929044368 \tabularnewline
37 & 95.4 & 92.0835013497213 & 3.31649865027871 \tabularnewline
38 & 96.5 & 103.722994840857 & -7.22299484085696 \tabularnewline
39 & 89.2 & 82.3568362017204 & 6.84316379827958 \tabularnewline
40 & 87.1 & 91.7261591636401 & -4.6261591636401 \tabularnewline
41 & 110.5 & 106.997092070422 & 3.50290792957818 \tabularnewline
42 & 110.8 & 105.004326444968 & 5.79567355503178 \tabularnewline
43 & 104.2 & 100.668362021947 & 3.53163797805325 \tabularnewline
44 & 88.9 & 94.1453737045506 & -5.24537370455059 \tabularnewline
45 & 89.8 & 92.4076768431044 & -2.60767684310438 \tabularnewline
46 & 90 & 90.0774425261687 & -0.0774425261686619 \tabularnewline
47 & 93.9 & 98.465412723052 & -4.56541272305198 \tabularnewline
48 & 91.3 & 95.1353152305152 & -3.83531523051518 \tabularnewline
49 & 87.8 & 85.6234129105818 & 2.17658708941816 \tabularnewline
50 & 99.7 & 100.790723626361 & -1.09072362636061 \tabularnewline
51 & 73.5 & 74.7956047607446 & -1.29560476074463 \tabularnewline
52 & 79.2 & 82.7707149492316 & -3.5707149492316 \tabularnewline
53 & 96.9 & 98.4642363302672 & -1.56423633026717 \tabularnewline
54 & 95.2 & 96.4432918170558 & -1.24329181705579 \tabularnewline
55 & 95.6 & 93.239510483434 & 2.36048951656589 \tabularnewline
56 & 89.7 & 88.0716950860366 & 1.62830491396345 \tabularnewline
\hline
\end{tabular}
%Source: https://freestatistics.org/blog/index.php?pk=59259&T=4

[TABLE]
[ROW][C]Multiple Linear Regression - Actuals, Interpolation, and Residuals[/C][/ROW]
[ROW][C]Time or Index[/C][C]Actuals[/C][C]InterpolationForecast[/C][C]ResidualsPrediction Error[/C][/ROW]
[ROW][C]1[/C][C]93.7[/C][C]98.3756175004954[/C][C]-4.67561750049542[/C][/ROW]
[ROW][C]2[/C][C]106.7[/C][C]103.919190986287[/C][C]2.78080901371347[/C][/ROW]
[ROW][C]3[/C][C]86.7[/C][C]86.0050011018663[/C][C]0.694998898133672[/C][/ROW]
[ROW][C]4[/C][C]95.3[/C][C]93.7724490412261[/C][C]1.52755095877387[/C][/ROW]
[ROW][C]5[/C][C]99.3[/C][C]103.142238291748[/C][C]-3.84223829174768[/C][/ROW]
[ROW][C]6[/C][C]101.8[/C][C]107.493612795095[/C][C]-5.69361279509457[/C][/ROW]
[ROW][C]7[/C][C]96[/C][C]97.9198206598634[/C][C]-1.91982065986336[/C][/ROW]
[ROW][C]8[/C][C]91.7[/C][C]88.9559469402983[/C][C]2.74405305970172[/C][/ROW]
[ROW][C]9[/C][C]95.3[/C][C]96.7487797048248[/C][C]-1.44877970482480[/C][/ROW]
[ROW][C]10[/C][C]96.6[/C][C]95.9394771966569[/C][C]0.660522803343128[/C][/ROW]
[ROW][C]11[/C][C]107.2[/C][C]104.960383624940[/C][C]2.23961637505989[/C][/ROW]
[ROW][C]12[/C][C]108[/C][C]105.391639144435[/C][C]2.60836085556484[/C][/ROW]
[ROW][C]13[/C][C]98.4[/C][C]100.959166056141[/C][C]-2.5591660561413[/C][/ROW]
[ROW][C]14[/C][C]103.1[/C][C]104.099359386245[/C][C]-0.99935938624504[/C][/ROW]
[ROW][C]15[/C][C]81.1[/C][C]86.2569418317945[/C][C]-5.1569418317945[/C][/ROW]
[ROW][C]16[/C][C]96.6[/C][C]89.8390538107912[/C][C]6.76094618920879[/C][/ROW]
[ROW][C]17[/C][C]103.7[/C][C]107.195126356733[/C][C]-3.4951263567329[/C][/ROW]
[ROW][C]18[/C][C]106.6[/C][C]110.063152898296[/C][C]-3.46315289829622[/C][/ROW]
[ROW][C]19[/C][C]97.6[/C][C]97.1330927706594[/C][C]0.466907229340577[/C][/ROW]
[ROW][C]20[/C][C]87.6[/C][C]89.4416464085342[/C][C]-1.84164640853419[/C][/ROW]
[ROW][C]21[/C][C]99.4[/C][C]95.2239081791498[/C][C]4.17609182085024[/C][/ROW]
[ROW][C]22[/C][C]98.5[/C][C]97.0447103936469[/C][C]1.45528960635309[/C][/ROW]
[ROW][C]23[/C][C]105.2[/C][C]104.941174646023[/C][C]0.258825353976953[/C][/ROW]
[ROW][C]24[/C][C]104.6[/C][C]101.943226334606[/C][C]2.65677366539401[/C][/ROW]
[ROW][C]25[/C][C]97.5[/C][C]95.7583021830602[/C][C]1.74169781693984[/C][/ROW]
[ROW][C]26[/C][C]108.9[/C][C]102.367731160251[/C][C]6.53226883974914[/C][/ROW]
[ROW][C]27[/C][C]86.8[/C][C]87.8856161038741[/C][C]-1.08561610387412[/C][/ROW]
[ROW][C]28[/C][C]88.9[/C][C]88.991623035111[/C][C]-0.0916230351109470[/C][/ROW]
[ROW][C]29[/C][C]110.3[/C][C]104.901306950830[/C][C]5.39869304916957[/C][/ROW]
[ROW][C]30[/C][C]114.8[/C][C]110.195616044585[/C][C]4.6043839554148[/C][/ROW]
[ROW][C]31[/C][C]94.6[/C][C]99.0392140640964[/C][C]-4.43921406409636[/C][/ROW]
[ROW][C]32[/C][C]92[/C][C]89.2853378605804[/C][C]2.71466213941961[/C][/ROW]
[ROW][C]33[/C][C]93.8[/C][C]93.919635272921[/C][C]-0.119635272921060[/C][/ROW]
[ROW][C]34[/C][C]93.8[/C][C]95.8383698835275[/C][C]-2.03836988352756[/C][/ROW]
[ROW][C]35[/C][C]107.6[/C][C]105.533029005985[/C][C]2.06697099401513[/C][/ROW]
[ROW][C]36[/C][C]101[/C][C]102.429819290444[/C][C]-1.42981929044368[/C][/ROW]
[ROW][C]37[/C][C]95.4[/C][C]92.0835013497213[/C][C]3.31649865027871[/C][/ROW]
[ROW][C]38[/C][C]96.5[/C][C]103.722994840857[/C][C]-7.22299484085696[/C][/ROW]
[ROW][C]39[/C][C]89.2[/C][C]82.3568362017204[/C][C]6.84316379827958[/C][/ROW]
[ROW][C]40[/C][C]87.1[/C][C]91.7261591636401[/C][C]-4.6261591636401[/C][/ROW]
[ROW][C]41[/C][C]110.5[/C][C]106.997092070422[/C][C]3.50290792957818[/C][/ROW]
[ROW][C]42[/C][C]110.8[/C][C]105.004326444968[/C][C]5.79567355503178[/C][/ROW]
[ROW][C]43[/C][C]104.2[/C][C]100.668362021947[/C][C]3.53163797805325[/C][/ROW]
[ROW][C]44[/C][C]88.9[/C][C]94.1453737045506[/C][C]-5.24537370455059[/C][/ROW]
[ROW][C]45[/C][C]89.8[/C][C]92.4076768431044[/C][C]-2.60767684310438[/C][/ROW]
[ROW][C]46[/C][C]90[/C][C]90.0774425261687[/C][C]-0.0774425261686619[/C][/ROW]
[ROW][C]47[/C][C]93.9[/C][C]98.465412723052[/C][C]-4.56541272305198[/C][/ROW]
[ROW][C]48[/C][C]91.3[/C][C]95.1353152305152[/C][C]-3.83531523051518[/C][/ROW]
[ROW][C]49[/C][C]87.8[/C][C]85.6234129105818[/C][C]2.17658708941816[/C][/ROW]
[ROW][C]50[/C][C]99.7[/C][C]100.790723626361[/C][C]-1.09072362636061[/C][/ROW]
[ROW][C]51[/C][C]73.5[/C][C]74.7956047607446[/C][C]-1.29560476074463[/C][/ROW]
[ROW][C]52[/C][C]79.2[/C][C]82.7707149492316[/C][C]-3.5707149492316[/C][/ROW]
[ROW][C]53[/C][C]96.9[/C][C]98.4642363302672[/C][C]-1.56423633026717[/C][/ROW]
[ROW][C]54[/C][C]95.2[/C][C]96.4432918170558[/C][C]-1.24329181705579[/C][/ROW]
[ROW][C]55[/C][C]95.6[/C][C]93.239510483434[/C][C]2.36048951656589[/C][/ROW]
[ROW][C]56[/C][C]89.7[/C][C]88.0716950860366[/C][C]1.62830491396345[/C][/ROW]
[/TABLE]
Source: https://freestatistics.org/blog/index.php?pk=59259&T=4

Globally Unique Identifier (entire table): ba.freestatistics.org/blog/index.php?pk=59259&T=4

As an alternative you can also use a QR Code:  

The GUIDs for individual cells are displayed in the table below:

Multiple Linear Regression - Actuals, Interpolation, and Residuals
Time or IndexActualsInterpolationForecastResidualsPrediction Error
193.798.3756175004954-4.67561750049542
2106.7103.9191909862872.78080901371347
386.786.00500110186630.694998898133672
495.393.77244904122611.52755095877387
599.3103.142238291748-3.84223829174768
6101.8107.493612795095-5.69361279509457
79697.9198206598634-1.91982065986336
891.788.95594694029832.74405305970172
995.396.7487797048248-1.44877970482480
1096.695.93947719665690.660522803343128
11107.2104.9603836249402.23961637505989
12108105.3916391444352.60836085556484
1398.4100.959166056141-2.5591660561413
14103.1104.099359386245-0.99935938624504
1581.186.2569418317945-5.1569418317945
1696.689.83905381079126.76094618920879
17103.7107.195126356733-3.4951263567329
18106.6110.063152898296-3.46315289829622
1997.697.13309277065940.466907229340577
2087.689.4416464085342-1.84164640853419
2199.495.22390817914984.17609182085024
2298.597.04471039364691.45528960635309
23105.2104.9411746460230.258825353976953
24104.6101.9432263346062.65677366539401
2597.595.75830218306021.74169781693984
26108.9102.3677311602516.53226883974914
2786.887.8856161038741-1.08561610387412
2888.988.991623035111-0.0916230351109470
29110.3104.9013069508305.39869304916957
30114.8110.1956160445854.6043839554148
3194.699.0392140640964-4.43921406409636
329289.28533786058042.71466213941961
3393.893.919635272921-0.119635272921060
3493.895.8383698835275-2.03836988352756
35107.6105.5330290059852.06697099401513
36101102.429819290444-1.42981929044368
3795.492.08350134972133.31649865027871
3896.5103.722994840857-7.22299484085696
3989.282.35683620172046.84316379827958
4087.191.7261591636401-4.6261591636401
41110.5106.9970920704223.50290792957818
42110.8105.0043264449685.79567355503178
43104.2100.6683620219473.53163797805325
4488.994.1453737045506-5.24537370455059
4589.892.4076768431044-2.60767684310438
469090.0774425261687-0.0774425261686619
4793.998.465412723052-4.56541272305198
4891.395.1353152305152-3.83531523051518
4987.885.62341291058182.17658708941816
5099.7100.790723626361-1.09072362636061
5173.574.7956047607446-1.29560476074463
5279.282.7707149492316-3.5707149492316
5396.998.4642363302672-1.56423633026717
5495.296.4432918170558-1.24329181705579
5595.693.2395104834342.36048951656589
5689.788.07169508603661.62830491396345


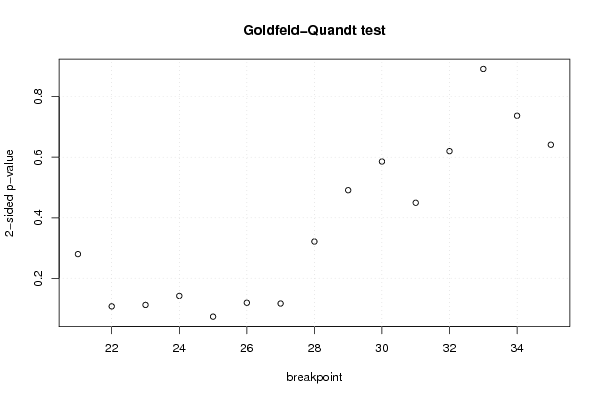
Goldfeld-Quandt test for Heteroskedasticity
p-valuesAlternative Hypothesis
breakpoint indexgreater2-sidedless
210.1399774681131350.2799549362262710.860022531886865
220.05363118388615390.1072623677723080.946368816113846
230.05602409398357080.1120481879671420.94397590601643
240.0708530401878930.1417060803757860.929146959812107
250.03661949571691940.07323899143383880.96338050428308
260.05958453274337440.1191690654867490.940415467256626
270.05829040220991990.1165808044198400.94170959779008
280.1606752693840220.3213505387680450.839324730615978
290.245488723439580.490977446879160.75451127656042
300.2928755745578910.5857511491157820.707124425442109
310.2247518680087740.4495037360175480.775248131991226
320.3100044568584060.6200089137168120.689995543141594
330.4458094084336090.8916188168672180.554190591566391
340.3685184750998960.7370369501997920.631481524900104
350.3205916085306020.6411832170612050.679408391469398

\begin{tabular}{lllllllll}
\hline
Goldfeld-Quandt test for Heteroskedasticity \tabularnewline
p-values & Alternative Hypothesis \tabularnewline
breakpoint index & greater & 2-sided & less \tabularnewline
21 & 0.139977468113135 & 0.279954936226271 & 0.860022531886865 \tabularnewline
22 & 0.0536311838861539 & 0.107262367772308 & 0.946368816113846 \tabularnewline
23 & 0.0560240939835708 & 0.112048187967142 & 0.94397590601643 \tabularnewline
24 & 0.070853040187893 & 0.141706080375786 & 0.929146959812107 \tabularnewline
25 & 0.0366194957169194 & 0.0732389914338388 & 0.96338050428308 \tabularnewline
26 & 0.0595845327433744 & 0.119169065486749 & 0.940415467256626 \tabularnewline
27 & 0.0582904022099199 & 0.116580804419840 & 0.94170959779008 \tabularnewline
28 & 0.160675269384022 & 0.321350538768045 & 0.839324730615978 \tabularnewline
29 & 0.24548872343958 & 0.49097744687916 & 0.75451127656042 \tabularnewline
30 & 0.292875574557891 & 0.585751149115782 & 0.707124425442109 \tabularnewline
31 & 0.224751868008774 & 0.449503736017548 & 0.775248131991226 \tabularnewline
32 & 0.310004456858406 & 0.620008913716812 & 0.689995543141594 \tabularnewline
33 & 0.445809408433609 & 0.891618816867218 & 0.554190591566391 \tabularnewline
34 & 0.368518475099896 & 0.737036950199792 & 0.631481524900104 \tabularnewline
35 & 0.320591608530602 & 0.641183217061205 & 0.679408391469398 \tabularnewline
\hline
\end{tabular}
%Source: https://freestatistics.org/blog/index.php?pk=59259&T=5

[TABLE]
[ROW][C]Goldfeld-Quandt test for Heteroskedasticity[/C][/ROW]
[ROW][C]p-values[/C][C]Alternative Hypothesis[/C][/ROW]
[ROW][C]breakpoint index[/C][C]greater[/C][C]2-sided[/C][C]less[/C][/ROW]
[ROW][C]21[/C][C]0.139977468113135[/C][C]0.279954936226271[/C][C]0.860022531886865[/C][/ROW]
[ROW][C]22[/C][C]0.0536311838861539[/C][C]0.107262367772308[/C][C]0.946368816113846[/C][/ROW]
[ROW][C]23[/C][C]0.0560240939835708[/C][C]0.112048187967142[/C][C]0.94397590601643[/C][/ROW]
[ROW][C]24[/C][C]0.070853040187893[/C][C]0.141706080375786[/C][C]0.929146959812107[/C][/ROW]
[ROW][C]25[/C][C]0.0366194957169194[/C][C]0.0732389914338388[/C][C]0.96338050428308[/C][/ROW]
[ROW][C]26[/C][C]0.0595845327433744[/C][C]0.119169065486749[/C][C]0.940415467256626[/C][/ROW]
[ROW][C]27[/C][C]0.0582904022099199[/C][C]0.116580804419840[/C][C]0.94170959779008[/C][/ROW]
[ROW][C]28[/C][C]0.160675269384022[/C][C]0.321350538768045[/C][C]0.839324730615978[/C][/ROW]
[ROW][C]29[/C][C]0.24548872343958[/C][C]0.49097744687916[/C][C]0.75451127656042[/C][/ROW]
[ROW][C]30[/C][C]0.292875574557891[/C][C]0.585751149115782[/C][C]0.707124425442109[/C][/ROW]
[ROW][C]31[/C][C]0.224751868008774[/C][C]0.449503736017548[/C][C]0.775248131991226[/C][/ROW]
[ROW][C]32[/C][C]0.310004456858406[/C][C]0.620008913716812[/C][C]0.689995543141594[/C][/ROW]
[ROW][C]33[/C][C]0.445809408433609[/C][C]0.891618816867218[/C][C]0.554190591566391[/C][/ROW]
[ROW][C]34[/C][C]0.368518475099896[/C][C]0.737036950199792[/C][C]0.631481524900104[/C][/ROW]
[ROW][C]35[/C][C]0.320591608530602[/C][C]0.641183217061205[/C][C]0.679408391469398[/C][/ROW]
[/TABLE]
Source: https://freestatistics.org/blog/index.php?pk=59259&T=5

Globally Unique Identifier (entire table): ba.freestatistics.org/blog/index.php?pk=59259&T=5

As an alternative you can also use a QR Code:  

The GUIDs for individual cells are displayed in the table below:

Goldfeld-Quandt test for Heteroskedasticity
p-valuesAlternative Hypothesis
breakpoint indexgreater2-sidedless
210.1399774681131350.2799549362262710.860022531886865
220.05363118388615390.1072623677723080.946368816113846
230.05602409398357080.1120481879671420.94397590601643
240.0708530401878930.1417060803757860.929146959812107
250.03661949571691940.07323899143383880.96338050428308
260.05958453274337440.1191690654867490.940415467256626
270.05829040220991990.1165808044198400.94170959779008
280.1606752693840220.3213505387680450.839324730615978
290.245488723439580.490977446879160.75451127656042
300.2928755745578910.5857511491157820.707124425442109
310.2247518680087740.4495037360175480.775248131991226
320.3100044568584060.6200089137168120.689995543141594
330.4458094084336090.8916188168672180.554190591566391
340.3685184750998960.7370369501997920.631481524900104
350.3205916085306020.6411832170612050.679408391469398


Meta Analysis of Goldfeld-Quandt test for Heteroskedasticity
Description# significant tests% significant testsOK/NOK
1% type I error level00OK
5% type I error level00OK
10% type I error level10.0666666666666667OK

\begin{tabular}{lllllllll}
\hline
Meta Analysis of Goldfeld-Quandt test for Heteroskedasticity \tabularnewline
Description & # significant tests & % significant tests & OK/NOK \tabularnewline
1% type I error level & 0 & 0 & OK \tabularnewline
5% type I error level & 0 & 0 & OK \tabularnewline
10% type I error level & 1 & 0.0666666666666667 & OK \tabularnewline
\hline
\end{tabular}
%Source: https://freestatistics.org/blog/index.php?pk=59259&T=6

[TABLE]
[ROW][C]Meta Analysis of Goldfeld-Quandt test for Heteroskedasticity[/C][/ROW]
[ROW][C]Description[/C][C]# significant tests[/C][C]% significant tests[/C][C]OK/NOK[/C][/ROW]
[ROW][C]1% type I error level[/C][C]0[/C][C]0[/C][C]OK[/C][/ROW]
[ROW][C]5% type I error level[/C][C]0[/C][C]0[/C][C]OK[/C][/ROW]
[ROW][C]10% type I error level[/C][C]1[/C][C]0.0666666666666667[/C][C]OK[/C][/ROW]
[/TABLE]
Source: https://freestatistics.org/blog/index.php?pk=59259&T=6

Globally Unique Identifier (entire table): ba.freestatistics.org/blog/index.php?pk=59259&T=6

As an alternative you can also use a QR Code:  

The GUIDs for individual cells are displayed in the table below:

Meta Analysis of Goldfeld-Quandt test for Heteroskedasticity
Description# significant tests% significant testsOK/NOK
1% type I error level00OK
5% type I error level00OK
10% type I error level10.0666666666666667OK


Parameters (Session):
par1 = 2 ; par2 = Include Monthly Dummies ; par3 = Linear Trend ;
Parameters (R input):
par1 = 2 ; par2 = Include Monthly Dummies ; par3 = Linear Trend ;
R code (references can be found in the software module):
library(lattice)
library(lmtest)
n25 <- 25 #minimum number of obs. for Goldfeld-Quandt test
par1 <- as.numeric(par1)
x <- t(y)
k <- length(x[1,])
n <- length(x[,1])
x1 <- cbind(x[,par1], x[,1:k!=par1])
mycolnames <- c(colnames(x)[par1], colnames(x)[1:k!=par1])
colnames(x1) <- mycolnames #colnames(x)[par1]
x <- x1
if (par3 == 'First Differences'){
x2 <- array(0, dim=c(n-1,k), dimnames=list(1:(n-1), paste('(1-B)',colnames(x),sep='')))
for (i in 1:n-1) {
for (j in 1:k) {
x2[i,j] <- x[i+1,j] - x[i,j]
}
}
x <- x2
}
if (par2 == 'Include Monthly Dummies'){
x2 <- array(0, dim=c(n,11), dimnames=list(1:n, paste('M', seq(1:11), sep ='')))
for (i in 1:11){
x2[seq(i,n,12),i] <- 1
}
x <- cbind(x, x2)
}
if (par2 == 'Include Quarterly Dummies'){
x2 <- array(0, dim=c(n,3), dimnames=list(1:n, paste('Q', seq(1:3), sep ='')))
for (i in 1:3){
x2[seq(i,n,4),i] <- 1
}
x <- cbind(x, x2)
}
k <- length(x[1,])
if (par3 == 'Linear Trend'){
x <- cbind(x, c(1:n))
colnames(x)[k+1] <- 't'
}
x
k <- length(x[1,])
df <- as.data.frame(x)
(mylm <- lm(df))
(mysum <- summary(mylm))
if (n > n25) {
kp3 <- k + 3
nmkm3 <- n - k - 3
gqarr <- array(NA, dim=c(nmkm3-kp3+1,3))
numgqtests <- 0
numsignificant1 <- 0
numsignificant5 <- 0
numsignificant10 <- 0
for (mypoint in kp3:nmkm3) {
j <- 0
numgqtests <- numgqtests + 1
for (myalt in c('greater', 'two.sided', 'less')) {
j <- j + 1
gqarr[mypoint-kp3+1,j] <- gqtest(mylm, point=mypoint, alternative=myalt)$p.value
}
if (gqarr[mypoint-kp3+1,2] < 0.01) numsignificant1 <- numsignificant1 + 1
if (gqarr[mypoint-kp3+1,2] < 0.05) numsignificant5 <- numsignificant5 + 1
if (gqarr[mypoint-kp3+1,2] < 0.10) numsignificant10 <- numsignificant10 + 1
}
gqarr
}
bitmap(file='test0.png')
plot(x[,1], type='l', main='Actuals and Interpolation', ylab='value of Actuals and Interpolation (dots)', xlab='time or index')
points(x[,1]-mysum$resid)
grid()
dev.off()
bitmap(file='test1.png')
plot(mysum$resid, type='b', pch=19, main='Residuals', ylab='value of Residuals', xlab='time or index')
grid()
dev.off()
bitmap(file='test2.png')
hist(mysum$resid, main='Residual Histogram', xlab='values of Residuals')
grid()
dev.off()
bitmap(file='test3.png')
densityplot(~mysum$resid,col='black',main='Residual Density Plot', xlab='values of Residuals')
dev.off()
bitmap(file='test4.png')
qqnorm(mysum$resid, main='Residual Normal Q-Q Plot')
qqline(mysum$resid)
grid()
dev.off()
(myerror <- as.ts(mysum$resid))
bitmap(file='test5.png')
dum <- cbind(lag(myerror,k=1),myerror)
dum
dum1 <- dum[2:length(myerror),]
dum1
z <- as.data.frame(dum1)
z
plot(z,main=paste('Residual Lag plot, lowess, and regression line'), ylab='values of Residuals', xlab='lagged values of Residuals')
lines(lowess(z))
abline(lm(z))
grid()
dev.off()
bitmap(file='test6.png')
acf(mysum$resid, lag.max=length(mysum$resid)/2, main='Residual Autocorrelation Function')
grid()
dev.off()
bitmap(file='test7.png')
pacf(mysum$resid, lag.max=length(mysum$resid)/2, main='Residual Partial Autocorrelation Function')
grid()
dev.off()
bitmap(file='test8.png')
opar <- par(mfrow = c(2,2), oma = c(0, 0, 1.1, 0))
plot(mylm, las = 1, sub='Residual Diagnostics')
par(opar)
dev.off()
if (n > n25) {
bitmap(file='test9.png')
plot(kp3:nmkm3,gqarr[,2], main='Goldfeld-Quandt test',ylab='2-sided p-value',xlab='breakpoint')
grid()
dev.off()
}
load(file='createtable')
a<-table.start()
a<-table.row.start(a)
a<-table.element(a, 'Multiple Linear Regression - Estimated Regression Equation', 1, TRUE)
a<-table.row.end(a)
myeq <- colnames(x)[1]
myeq <- paste(myeq, '[t] = ', sep='')
for (i in 1:k){
if (mysum$coefficients[i,1] > 0) myeq <- paste(myeq, '+', '')
myeq <- paste(myeq, mysum$coefficients[i,1], sep=' ')
if (rownames(mysum$coefficients)[i] != '(Intercept)') {
myeq <- paste(myeq, rownames(mysum$coefficients)[i], sep='')
if (rownames(mysum$coefficients)[i] != 't') myeq <- paste(myeq, '[t]', sep='')
}
}
myeq <- paste(myeq, ' + e[t]')
a<-table.row.start(a)
a<-table.element(a, myeq)
a<-table.row.end(a)
a<-table.end(a)
table.save(a,file='mytable1.tab')
a<-table.start()
a<-table.row.start(a)
a<-table.element(a,hyperlink('ols1.htm','Multiple Linear Regression - Ordinary Least Squares',''), 6, TRUE)
a<-table.row.end(a)
a<-table.row.start(a)
a<-table.element(a,'Variable',header=TRUE)
a<-table.element(a,'Parameter',header=TRUE)
a<-table.element(a,'S.D.',header=TRUE)
a<-table.element(a,'T-STAT
H0: parameter = 0',header=TRUE)
a<-table.element(a,'2-tail p-value',header=TRUE)
a<-table.element(a,'1-tail p-value',header=TRUE)
a<-table.row.end(a)
for (i in 1:k){
a<-table.row.start(a)
a<-table.element(a,rownames(mysum$coefficients)[i],header=TRUE)
a<-table.element(a,mysum$coefficients[i,1])
a<-table.element(a, round(mysum$coefficients[i,2],6))
a<-table.element(a, round(mysum$coefficients[i,3],4))
a<-table.element(a, round(mysum$coefficients[i,4],6))
a<-table.element(a, round(mysum$coefficients[i,4]/2,6))
a<-table.row.end(a)
}
a<-table.end(a)
table.save(a,file='mytable2.tab')
a<-table.start()
a<-table.row.start(a)
a<-table.element(a, 'Multiple Linear Regression - Regression Statistics', 2, TRUE)
a<-table.row.end(a)
a<-table.row.start(a)
a<-table.element(a, 'Multiple R',1,TRUE)
a<-table.element(a, sqrt(mysum$r.squared))
a<-table.row.end(a)
a<-table.row.start(a)
a<-table.element(a, 'R-squared',1,TRUE)
a<-table.element(a, mysum$r.squared)
a<-table.row.end(a)
a<-table.row.start(a)
a<-table.element(a, 'Adjusted R-squared',1,TRUE)
a<-table.element(a, mysum$adj.r.squared)
a<-table.row.end(a)
a<-table.row.start(a)
a<-table.element(a, 'F-TEST (value)',1,TRUE)
a<-table.element(a, mysum$fstatistic[1])
a<-table.row.end(a)
a<-table.row.start(a)
a<-table.element(a, 'F-TEST (DF numerator)',1,TRUE)
a<-table.element(a, mysum$fstatistic[2])
a<-table.row.end(a)
a<-table.row.start(a)
a<-table.element(a, 'F-TEST (DF denominator)',1,TRUE)
a<-table.element(a, mysum$fstatistic[3])
a<-table.row.end(a)
a<-table.row.start(a)
a<-table.element(a, 'p-value',1,TRUE)
a<-table.element(a, 1-pf(mysum$fstatistic[1],mysum$fstatistic[2],mysum$fstatistic[3]))
a<-table.row.end(a)
a<-table.row.start(a)
a<-table.element(a, 'Multiple Linear Regression - Residual Statistics', 2, TRUE)
a<-table.row.end(a)
a<-table.row.start(a)
a<-table.element(a, 'Residual Standard Deviation',1,TRUE)
a<-table.element(a, mysum$sigma)
a<-table.row.end(a)
a<-table.row.start(a)
a<-table.element(a, 'Sum Squared Residuals',1,TRUE)
a<-table.element(a, sum(myerror*myerror))
a<-table.row.end(a)
a<-table.end(a)
table.save(a,file='mytable3.tab')
a<-table.start()
a<-table.row.start(a)
a<-table.element(a, 'Multiple Linear Regression - Actuals, Interpolation, and Residuals', 4, TRUE)
a<-table.row.end(a)
a<-table.row.start(a)
a<-table.element(a, 'Time or Index', 1, TRUE)
a<-table.element(a, 'Actuals', 1, TRUE)
a<-table.element(a, 'Interpolation
Forecast', 1, TRUE)
a<-table.element(a, 'Residuals
Prediction Error', 1, TRUE)
a<-table.row.end(a)
for (i in 1:n) {
a<-table.row.start(a)
a<-table.element(a,i, 1, TRUE)
a<-table.element(a,x[i])
a<-table.element(a,x[i]-mysum$resid[i])
a<-table.element(a,mysum$resid[i])
a<-table.row.end(a)
}
a<-table.end(a)
table.save(a,file='mytable4.tab')
if (n > n25) {
a<-table.start()
a<-table.row.start(a)
a<-table.element(a,'Goldfeld-Quandt test for Heteroskedasticity',4,TRUE)
a<-table.row.end(a)
a<-table.row.start(a)
a<-table.element(a,'p-values',header=TRUE)
a<-table.element(a,'Alternative Hypothesis',3,header=TRUE)
a<-table.row.end(a)
a<-table.row.start(a)
a<-table.element(a,'breakpoint index',header=TRUE)
a<-table.element(a,'greater',header=TRUE)
a<-table.element(a,'2-sided',header=TRUE)
a<-table.element(a,'less',header=TRUE)
a<-table.row.end(a)
for (mypoint in kp3:nmkm3) {
a<-table.row.start(a)
a<-table.element(a,mypoint,header=TRUE)
a<-table.element(a,gqarr[mypoint-kp3+1,1])
a<-table.element(a,gqarr[mypoint-kp3+1,2])
a<-table.element(a,gqarr[mypoint-kp3+1,3])
a<-table.row.end(a)
}
a<-table.end(a)
table.save(a,file='mytable5.tab')
a<-table.start()
a<-table.row.start(a)
a<-table.element(a,'Meta Analysis of Goldfeld-Quandt test for Heteroskedasticity',4,TRUE)
a<-table.row.end(a)
a<-table.row.start(a)
a<-table.element(a,'Description',header=TRUE)
a<-table.element(a,'# significant tests',header=TRUE)
a<-table.element(a,'% significant tests',header=TRUE)
a<-table.element(a,'OK/NOK',header=TRUE)
a<-table.row.end(a)
a<-table.row.start(a)
a<-table.element(a,'1% type I error level',header=TRUE)
a<-table.element(a,numsignificant1)
a<-table.element(a,numsignificant1/numgqtests)
if (numsignificant1/numgqtests < 0.01) dum <- 'OK' else dum <- 'NOK'
a<-table.element(a,dum)
a<-table.row.end(a)
a<-table.row.start(a)
a<-table.element(a,'5% type I error level',header=TRUE)
a<-table.element(a,numsignificant5)
a<-table.element(a,numsignificant5/numgqtests)
if (numsignificant5/numgqtests < 0.05) dum <- 'OK' else dum <- 'NOK'
a<-table.element(a,dum)
a<-table.row.end(a)
a<-table.row.start(a)
a<-table.element(a,'10% type I error level',header=TRUE)
a<-table.element(a,numsignificant10)
a<-table.element(a,numsignificant10/numgqtests)
if (numsignificant10/numgqtests < 0.1) dum <- 'OK' else dum <- 'NOK'
a<-table.element(a,dum)
a<-table.row.end(a)
a<-table.end(a)
table.save(a,file='mytable6.tab')
}