Free Statistics

of Irreproducible Research!

Author's title

Author*The author of this computation has been verified*
R Software Modulerwasp_autocorrelation.wasp
Title produced by software(Partial) Autocorrelation Function
Date of computationTue, 24 Nov 2009 12:18:22 -0700
Cite this page as followsStatistical Computations at FreeStatistics.org, Office for Research Development and Education, URL https://freestatistics.org/blog/index.php?v=date/2009/Nov/24/t12590905193j3xytlrtjk8sjq.htm/, Retrieved Wed, 24 Apr 2024 05:25:52 +0000
Statistical Computations at FreeStatistics.org, Office for Research Development and Education, URL https://freestatistics.org/blog/index.php?pk=59246, Retrieved Wed, 24 Apr 2024 05:25:52 +0000
QR Codes:

Original text written by user:
IsPrivate?No (this computation is public)
User-defined keywords
Estimated Impact134
Family? (F = Feedback message, R = changed R code, M = changed R Module, P = changed Parameters, D = changed Data)
-     [Univariate Explorative Data Analysis] [Run Sequence gebo...] [2008-12-12 13:32:37] [76963dc1903f0f612b6153510a3818cf]
- R  D  [Univariate Explorative Data Analysis] [Run Sequence gebo...] [2008-12-17 12:14:40] [76963dc1903f0f612b6153510a3818cf]
-         [Univariate Explorative Data Analysis] [Run Sequence Plot...] [2008-12-22 18:19:51] [1ce0d16c8f4225c977b42c8fa93bc163]
- RMP       [(Partial) Autocorrelation Function] [Identifying Integ...] [2009-11-22 12:16:10] [b98453cac15ba1066b407e146608df68]
-   PD          [(Partial) Autocorrelation Function] [] [2009-11-24 19:18:22] [fc845972e0ebdb725d2fb9537c0c51aa] [Current]
Feedback Forum

Post a new message
Dataseries X:
111,4
87,4
96,8
114,1
110,3
103,9
101,6
94,6
95,9
104,7
102,8
98,1
113,9
80,9
95,7
113,2
105,9
108,8
102,3
99
100,7
115,5
100,7
109,9
114,6
85,4
100,5
114,8
116,5
112,9
102
106
105,3
118,8
106,1
109,3
117,2
92,5
104,2
112,5
122,4
113,3
100
110,7
112,8
109,8
117,3
109,1
115,9
96
99,8
116,8
115,7
99,4
94,3
91
93,2
103,1
94,1
91,8
102,7


Summary of computational transaction
Raw Inputview raw input (R code)
Raw Outputview raw output of R engine
Computing time1 seconds
R Server'Gwilym Jenkins' @ 72.249.127.135

\begin{tabular}{lllllllll}
\hline
Summary of computational transaction \tabularnewline
Raw Input & view raw input (R code)  \tabularnewline
Raw Output & view raw output of R engine  \tabularnewline
Computing time & 1 seconds \tabularnewline
R Server & 'Gwilym Jenkins' @ 72.249.127.135 \tabularnewline
\hline
\end{tabular}
%Source: https://freestatistics.org/blog/index.php?pk=59246&T=0

[TABLE]
[ROW][C]Summary of computational transaction[/C][/ROW]
[ROW][C]Raw Input[/C][C]view raw input (R code) [/C][/ROW]
[ROW][C]Raw Output[/C][C]view raw output of R engine [/C][/ROW]
[ROW][C]Computing time[/C][C]1 seconds[/C][/ROW]
[ROW][C]R Server[/C][C]'Gwilym Jenkins' @ 72.249.127.135[/C][/ROW]
[/TABLE]
Source: https://freestatistics.org/blog/index.php?pk=59246&T=0

Globally Unique Identifier (entire table): ba.freestatistics.org/blog/index.php?pk=59246&T=0

As an alternative you can also use a QR Code:  

The GUIDs for individual cells are displayed in the table below:

Summary of computational transaction
Raw Inputview raw input (R code)
Raw Outputview raw output of R engine
Computing time1 seconds
R Server'Gwilym Jenkins' @ 72.249.127.135


Autocorrelation Function
Time lag kACF(k)T-STATP-value
10.1843821.44010.07748
2-0.108061-0.8440.200988
30.062720.48990.312995
40.0364470.28470.388435
50.2670162.08550.020609
60.2744982.14390.018018
70.1091230.85230.198696
8-0.086283-0.67390.251464
9-0.060259-0.47060.319788
10-0.225612-1.76210.041532
11-0.001372-0.01070.495744
120.5006383.91010.000117
13-0.057407-0.44840.327741
14-0.278035-2.17150.016895
15-0.165825-1.29510.100077
16-0.100767-0.7870.217159
170.1092230.85310.198483
180.0740580.57840.282558
19-0.014618-0.11420.454738
20-0.178312-1.39270.084389
21-0.111285-0.86920.194083
22-0.230739-1.80210.038233
23-0.056723-0.4430.32966
240.2784032.17440.016782
25-0.073004-0.57020.285324
26-0.295539-2.30820.012196
27-0.228202-1.78230.039837
28-0.058965-0.46050.323385
290.0397440.31040.378654
30-0.004529-0.03540.48595
31-0.042367-0.33090.370928
32-0.178323-1.39270.084376
33-0.087695-0.68490.247995
34-0.091136-0.71180.239653
35-0.087286-0.68170.248997
360.1621.26530.105295
37-0.026025-0.20330.419804
38-0.189118-1.47710.072402
39-0.122088-0.95350.172041
400.0292820.22870.409933
410.0527350.41190.340938
420.0574580.44880.327596
430.0193870.15140.440072
44-0.036985-0.28890.386833
450.0369970.2890.386798
460.0360790.28180.389532
470.0341410.26670.395318
480.1582841.23620.110555
490.0462280.36110.359653
50-0.051591-0.40290.344202
510.0007520.00590.497667
520.0484620.37850.353187
530.0422690.33010.371216
540.0410450.32060.374817
55-0.008131-0.06350.474785
56-0.017821-0.13920.444881
570.0508250.3970.346391
580.0339690.26530.395833
59-0.009324-0.07280.471093
60-0.00274-0.02140.491499

\begin{tabular}{lllllllll}
\hline
Autocorrelation Function \tabularnewline
Time lag k & ACF(k) & T-STAT & P-value \tabularnewline
1 & 0.184382 & 1.4401 & 0.07748 \tabularnewline
2 & -0.108061 & -0.844 & 0.200988 \tabularnewline
3 & 0.06272 & 0.4899 & 0.312995 \tabularnewline
4 & 0.036447 & 0.2847 & 0.388435 \tabularnewline
5 & 0.267016 & 2.0855 & 0.020609 \tabularnewline
6 & 0.274498 & 2.1439 & 0.018018 \tabularnewline
7 & 0.109123 & 0.8523 & 0.198696 \tabularnewline
8 & -0.086283 & -0.6739 & 0.251464 \tabularnewline
9 & -0.060259 & -0.4706 & 0.319788 \tabularnewline
10 & -0.225612 & -1.7621 & 0.041532 \tabularnewline
11 & -0.001372 & -0.0107 & 0.495744 \tabularnewline
12 & 0.500638 & 3.9101 & 0.000117 \tabularnewline
13 & -0.057407 & -0.4484 & 0.327741 \tabularnewline
14 & -0.278035 & -2.1715 & 0.016895 \tabularnewline
15 & -0.165825 & -1.2951 & 0.100077 \tabularnewline
16 & -0.100767 & -0.787 & 0.217159 \tabularnewline
17 & 0.109223 & 0.8531 & 0.198483 \tabularnewline
18 & 0.074058 & 0.5784 & 0.282558 \tabularnewline
19 & -0.014618 & -0.1142 & 0.454738 \tabularnewline
20 & -0.178312 & -1.3927 & 0.084389 \tabularnewline
21 & -0.111285 & -0.8692 & 0.194083 \tabularnewline
22 & -0.230739 & -1.8021 & 0.038233 \tabularnewline
23 & -0.056723 & -0.443 & 0.32966 \tabularnewline
24 & 0.278403 & 2.1744 & 0.016782 \tabularnewline
25 & -0.073004 & -0.5702 & 0.285324 \tabularnewline
26 & -0.295539 & -2.3082 & 0.012196 \tabularnewline
27 & -0.228202 & -1.7823 & 0.039837 \tabularnewline
28 & -0.058965 & -0.4605 & 0.323385 \tabularnewline
29 & 0.039744 & 0.3104 & 0.378654 \tabularnewline
30 & -0.004529 & -0.0354 & 0.48595 \tabularnewline
31 & -0.042367 & -0.3309 & 0.370928 \tabularnewline
32 & -0.178323 & -1.3927 & 0.084376 \tabularnewline
33 & -0.087695 & -0.6849 & 0.247995 \tabularnewline
34 & -0.091136 & -0.7118 & 0.239653 \tabularnewline
35 & -0.087286 & -0.6817 & 0.248997 \tabularnewline
36 & 0.162 & 1.2653 & 0.105295 \tabularnewline
37 & -0.026025 & -0.2033 & 0.419804 \tabularnewline
38 & -0.189118 & -1.4771 & 0.072402 \tabularnewline
39 & -0.122088 & -0.9535 & 0.172041 \tabularnewline
40 & 0.029282 & 0.2287 & 0.409933 \tabularnewline
41 & 0.052735 & 0.4119 & 0.340938 \tabularnewline
42 & 0.057458 & 0.4488 & 0.327596 \tabularnewline
43 & 0.019387 & 0.1514 & 0.440072 \tabularnewline
44 & -0.036985 & -0.2889 & 0.386833 \tabularnewline
45 & 0.036997 & 0.289 & 0.386798 \tabularnewline
46 & 0.036079 & 0.2818 & 0.389532 \tabularnewline
47 & 0.034141 & 0.2667 & 0.395318 \tabularnewline
48 & 0.158284 & 1.2362 & 0.110555 \tabularnewline
49 & 0.046228 & 0.3611 & 0.359653 \tabularnewline
50 & -0.051591 & -0.4029 & 0.344202 \tabularnewline
51 & 0.000752 & 0.0059 & 0.497667 \tabularnewline
52 & 0.048462 & 0.3785 & 0.353187 \tabularnewline
53 & 0.042269 & 0.3301 & 0.371216 \tabularnewline
54 & 0.041045 & 0.3206 & 0.374817 \tabularnewline
55 & -0.008131 & -0.0635 & 0.474785 \tabularnewline
56 & -0.017821 & -0.1392 & 0.444881 \tabularnewline
57 & 0.050825 & 0.397 & 0.346391 \tabularnewline
58 & 0.033969 & 0.2653 & 0.395833 \tabularnewline
59 & -0.009324 & -0.0728 & 0.471093 \tabularnewline
60 & -0.00274 & -0.0214 & 0.491499 \tabularnewline
\hline
\end{tabular}
%Source: https://freestatistics.org/blog/index.php?pk=59246&T=1

[TABLE]
[ROW][C]Autocorrelation Function[/C][/ROW]
[ROW][C]Time lag k[/C][C]ACF(k)[/C][C]T-STAT[/C][C]P-value[/C][/ROW]
[ROW][C]1[/C][C]0.184382[/C][C]1.4401[/C][C]0.07748[/C][/ROW]
[ROW][C]2[/C][C]-0.108061[/C][C]-0.844[/C][C]0.200988[/C][/ROW]
[ROW][C]3[/C][C]0.06272[/C][C]0.4899[/C][C]0.312995[/C][/ROW]
[ROW][C]4[/C][C]0.036447[/C][C]0.2847[/C][C]0.388435[/C][/ROW]
[ROW][C]5[/C][C]0.267016[/C][C]2.0855[/C][C]0.020609[/C][/ROW]
[ROW][C]6[/C][C]0.274498[/C][C]2.1439[/C][C]0.018018[/C][/ROW]
[ROW][C]7[/C][C]0.109123[/C][C]0.8523[/C][C]0.198696[/C][/ROW]
[ROW][C]8[/C][C]-0.086283[/C][C]-0.6739[/C][C]0.251464[/C][/ROW]
[ROW][C]9[/C][C]-0.060259[/C][C]-0.4706[/C][C]0.319788[/C][/ROW]
[ROW][C]10[/C][C]-0.225612[/C][C]-1.7621[/C][C]0.041532[/C][/ROW]
[ROW][C]11[/C][C]-0.001372[/C][C]-0.0107[/C][C]0.495744[/C][/ROW]
[ROW][C]12[/C][C]0.500638[/C][C]3.9101[/C][C]0.000117[/C][/ROW]
[ROW][C]13[/C][C]-0.057407[/C][C]-0.4484[/C][C]0.327741[/C][/ROW]
[ROW][C]14[/C][C]-0.278035[/C][C]-2.1715[/C][C]0.016895[/C][/ROW]
[ROW][C]15[/C][C]-0.165825[/C][C]-1.2951[/C][C]0.100077[/C][/ROW]
[ROW][C]16[/C][C]-0.100767[/C][C]-0.787[/C][C]0.217159[/C][/ROW]
[ROW][C]17[/C][C]0.109223[/C][C]0.8531[/C][C]0.198483[/C][/ROW]
[ROW][C]18[/C][C]0.074058[/C][C]0.5784[/C][C]0.282558[/C][/ROW]
[ROW][C]19[/C][C]-0.014618[/C][C]-0.1142[/C][C]0.454738[/C][/ROW]
[ROW][C]20[/C][C]-0.178312[/C][C]-1.3927[/C][C]0.084389[/C][/ROW]
[ROW][C]21[/C][C]-0.111285[/C][C]-0.8692[/C][C]0.194083[/C][/ROW]
[ROW][C]22[/C][C]-0.230739[/C][C]-1.8021[/C][C]0.038233[/C][/ROW]
[ROW][C]23[/C][C]-0.056723[/C][C]-0.443[/C][C]0.32966[/C][/ROW]
[ROW][C]24[/C][C]0.278403[/C][C]2.1744[/C][C]0.016782[/C][/ROW]
[ROW][C]25[/C][C]-0.073004[/C][C]-0.5702[/C][C]0.285324[/C][/ROW]
[ROW][C]26[/C][C]-0.295539[/C][C]-2.3082[/C][C]0.012196[/C][/ROW]
[ROW][C]27[/C][C]-0.228202[/C][C]-1.7823[/C][C]0.039837[/C][/ROW]
[ROW][C]28[/C][C]-0.058965[/C][C]-0.4605[/C][C]0.323385[/C][/ROW]
[ROW][C]29[/C][C]0.039744[/C][C]0.3104[/C][C]0.378654[/C][/ROW]
[ROW][C]30[/C][C]-0.004529[/C][C]-0.0354[/C][C]0.48595[/C][/ROW]
[ROW][C]31[/C][C]-0.042367[/C][C]-0.3309[/C][C]0.370928[/C][/ROW]
[ROW][C]32[/C][C]-0.178323[/C][C]-1.3927[/C][C]0.084376[/C][/ROW]
[ROW][C]33[/C][C]-0.087695[/C][C]-0.6849[/C][C]0.247995[/C][/ROW]
[ROW][C]34[/C][C]-0.091136[/C][C]-0.7118[/C][C]0.239653[/C][/ROW]
[ROW][C]35[/C][C]-0.087286[/C][C]-0.6817[/C][C]0.248997[/C][/ROW]
[ROW][C]36[/C][C]0.162[/C][C]1.2653[/C][C]0.105295[/C][/ROW]
[ROW][C]37[/C][C]-0.026025[/C][C]-0.2033[/C][C]0.419804[/C][/ROW]
[ROW][C]38[/C][C]-0.189118[/C][C]-1.4771[/C][C]0.072402[/C][/ROW]
[ROW][C]39[/C][C]-0.122088[/C][C]-0.9535[/C][C]0.172041[/C][/ROW]
[ROW][C]40[/C][C]0.029282[/C][C]0.2287[/C][C]0.409933[/C][/ROW]
[ROW][C]41[/C][C]0.052735[/C][C]0.4119[/C][C]0.340938[/C][/ROW]
[ROW][C]42[/C][C]0.057458[/C][C]0.4488[/C][C]0.327596[/C][/ROW]
[ROW][C]43[/C][C]0.019387[/C][C]0.1514[/C][C]0.440072[/C][/ROW]
[ROW][C]44[/C][C]-0.036985[/C][C]-0.2889[/C][C]0.386833[/C][/ROW]
[ROW][C]45[/C][C]0.036997[/C][C]0.289[/C][C]0.386798[/C][/ROW]
[ROW][C]46[/C][C]0.036079[/C][C]0.2818[/C][C]0.389532[/C][/ROW]
[ROW][C]47[/C][C]0.034141[/C][C]0.2667[/C][C]0.395318[/C][/ROW]
[ROW][C]48[/C][C]0.158284[/C][C]1.2362[/C][C]0.110555[/C][/ROW]
[ROW][C]49[/C][C]0.046228[/C][C]0.3611[/C][C]0.359653[/C][/ROW]
[ROW][C]50[/C][C]-0.051591[/C][C]-0.4029[/C][C]0.344202[/C][/ROW]
[ROW][C]51[/C][C]0.000752[/C][C]0.0059[/C][C]0.497667[/C][/ROW]
[ROW][C]52[/C][C]0.048462[/C][C]0.3785[/C][C]0.353187[/C][/ROW]
[ROW][C]53[/C][C]0.042269[/C][C]0.3301[/C][C]0.371216[/C][/ROW]
[ROW][C]54[/C][C]0.041045[/C][C]0.3206[/C][C]0.374817[/C][/ROW]
[ROW][C]55[/C][C]-0.008131[/C][C]-0.0635[/C][C]0.474785[/C][/ROW]
[ROW][C]56[/C][C]-0.017821[/C][C]-0.1392[/C][C]0.444881[/C][/ROW]
[ROW][C]57[/C][C]0.050825[/C][C]0.397[/C][C]0.346391[/C][/ROW]
[ROW][C]58[/C][C]0.033969[/C][C]0.2653[/C][C]0.395833[/C][/ROW]
[ROW][C]59[/C][C]-0.009324[/C][C]-0.0728[/C][C]0.471093[/C][/ROW]
[ROW][C]60[/C][C]-0.00274[/C][C]-0.0214[/C][C]0.491499[/C][/ROW]
[/TABLE]
Source: https://freestatistics.org/blog/index.php?pk=59246&T=1

Globally Unique Identifier (entire table): ba.freestatistics.org/blog/index.php?pk=59246&T=1

As an alternative you can also use a QR Code:  

The GUIDs for individual cells are displayed in the table below:

Autocorrelation Function
Time lag kACF(k)T-STATP-value
10.1843821.44010.07748
2-0.108061-0.8440.200988
30.062720.48990.312995
40.0364470.28470.388435
50.2670162.08550.020609
60.2744982.14390.018018
70.1091230.85230.198696
8-0.086283-0.67390.251464
9-0.060259-0.47060.319788
10-0.225612-1.76210.041532
11-0.001372-0.01070.495744
120.5006383.91010.000117
13-0.057407-0.44840.327741
14-0.278035-2.17150.016895
15-0.165825-1.29510.100077
16-0.100767-0.7870.217159
170.1092230.85310.198483
180.0740580.57840.282558
19-0.014618-0.11420.454738
20-0.178312-1.39270.084389
21-0.111285-0.86920.194083
22-0.230739-1.80210.038233
23-0.056723-0.4430.32966
240.2784032.17440.016782
25-0.073004-0.57020.285324
26-0.295539-2.30820.012196
27-0.228202-1.78230.039837
28-0.058965-0.46050.323385
290.0397440.31040.378654
30-0.004529-0.03540.48595
31-0.042367-0.33090.370928
32-0.178323-1.39270.084376
33-0.087695-0.68490.247995
34-0.091136-0.71180.239653
35-0.087286-0.68170.248997
360.1621.26530.105295
37-0.026025-0.20330.419804
38-0.189118-1.47710.072402
39-0.122088-0.95350.172041
400.0292820.22870.409933
410.0527350.41190.340938
420.0574580.44880.327596
430.0193870.15140.440072
44-0.036985-0.28890.386833
450.0369970.2890.386798
460.0360790.28180.389532
470.0341410.26670.395318
480.1582841.23620.110555
490.0462280.36110.359653
50-0.051591-0.40290.344202
510.0007520.00590.497667
520.0484620.37850.353187
530.0422690.33010.371216
540.0410450.32060.374817
55-0.008131-0.06350.474785
56-0.017821-0.13920.444881
570.0508250.3970.346391
580.0339690.26530.395833
59-0.009324-0.07280.471093
60-0.00274-0.02140.491499


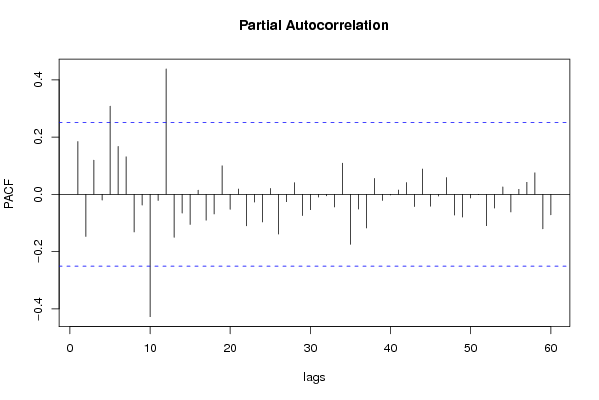
Partial Autocorrelation Function
Time lag kPACF(k)T-STATP-value
10.1843821.44010.07748
2-0.147057-1.14860.127612
30.1192340.93120.177698
4-0.019877-0.15520.43857
50.3077862.40390.009638
60.1673841.30730.098007
70.1308851.02220.155352
8-0.131518-1.02720.154193
9-0.037446-0.29250.385463
10-0.42738-3.33790.000721
11-0.021401-0.16710.433904
120.4379993.42090.00056
13-0.150392-1.17460.12236
14-0.065343-0.51030.305827
15-0.105059-0.82050.207552
160.0142820.11150.455776
17-0.090158-0.70420.242008
18-0.06843-0.53450.297483
190.0997190.77880.219546
20-0.052348-0.40890.342041
210.0184250.14390.443027
22-0.109849-0.8580.197139
23-0.027135-0.21190.416433
24-0.096302-0.75210.227428
250.0204590.15980.436788
26-0.138793-1.0840.141314
27-0.025767-0.20120.420588
280.0407360.31820.375727
29-0.074229-0.57970.282111
30-0.053777-0.420.337977
31-0.00973-0.0760.469838
32-0.005263-0.04110.483672
33-0.044045-0.3440.366013
340.1086920.84890.199626
35-0.174723-1.36460.088691
36-0.051535-0.40250.344362
37-0.117636-0.91880.180919
380.0555120.43360.333068
39-0.021159-0.16530.434643
40-0.002272-0.01770.49295
410.0149480.11670.453722
420.041230.3220.374271
43-0.042941-0.33540.369244
440.0883370.68990.246425
45-0.04141-0.32340.373742
46-0.006107-0.04770.481056
470.0584450.45650.324836
48-0.072448-0.56580.28679
49-0.079316-0.61950.268955
50-0.012787-0.09990.460389
51-0.001153-0.0090.496423
52-0.109608-0.85610.197656
53-0.048171-0.37620.354027
540.0259010.20230.42018
55-0.0615-0.48030.316357
560.0174290.13610.446084
570.0420480.32840.371864
580.0749840.58560.280139
59-0.120592-0.94190.174991
60-0.071753-0.56040.288626

\begin{tabular}{lllllllll}
\hline
Partial Autocorrelation Function \tabularnewline
Time lag k & PACF(k) & T-STAT & P-value \tabularnewline
1 & 0.184382 & 1.4401 & 0.07748 \tabularnewline
2 & -0.147057 & -1.1486 & 0.127612 \tabularnewline
3 & 0.119234 & 0.9312 & 0.177698 \tabularnewline
4 & -0.019877 & -0.1552 & 0.43857 \tabularnewline
5 & 0.307786 & 2.4039 & 0.009638 \tabularnewline
6 & 0.167384 & 1.3073 & 0.098007 \tabularnewline
7 & 0.130885 & 1.0222 & 0.155352 \tabularnewline
8 & -0.131518 & -1.0272 & 0.154193 \tabularnewline
9 & -0.037446 & -0.2925 & 0.385463 \tabularnewline
10 & -0.42738 & -3.3379 & 0.000721 \tabularnewline
11 & -0.021401 & -0.1671 & 0.433904 \tabularnewline
12 & 0.437999 & 3.4209 & 0.00056 \tabularnewline
13 & -0.150392 & -1.1746 & 0.12236 \tabularnewline
14 & -0.065343 & -0.5103 & 0.305827 \tabularnewline
15 & -0.105059 & -0.8205 & 0.207552 \tabularnewline
16 & 0.014282 & 0.1115 & 0.455776 \tabularnewline
17 & -0.090158 & -0.7042 & 0.242008 \tabularnewline
18 & -0.06843 & -0.5345 & 0.297483 \tabularnewline
19 & 0.099719 & 0.7788 & 0.219546 \tabularnewline
20 & -0.052348 & -0.4089 & 0.342041 \tabularnewline
21 & 0.018425 & 0.1439 & 0.443027 \tabularnewline
22 & -0.109849 & -0.858 & 0.197139 \tabularnewline
23 & -0.027135 & -0.2119 & 0.416433 \tabularnewline
24 & -0.096302 & -0.7521 & 0.227428 \tabularnewline
25 & 0.020459 & 0.1598 & 0.436788 \tabularnewline
26 & -0.138793 & -1.084 & 0.141314 \tabularnewline
27 & -0.025767 & -0.2012 & 0.420588 \tabularnewline
28 & 0.040736 & 0.3182 & 0.375727 \tabularnewline
29 & -0.074229 & -0.5797 & 0.282111 \tabularnewline
30 & -0.053777 & -0.42 & 0.337977 \tabularnewline
31 & -0.00973 & -0.076 & 0.469838 \tabularnewline
32 & -0.005263 & -0.0411 & 0.483672 \tabularnewline
33 & -0.044045 & -0.344 & 0.366013 \tabularnewline
34 & 0.108692 & 0.8489 & 0.199626 \tabularnewline
35 & -0.174723 & -1.3646 & 0.088691 \tabularnewline
36 & -0.051535 & -0.4025 & 0.344362 \tabularnewline
37 & -0.117636 & -0.9188 & 0.180919 \tabularnewline
38 & 0.055512 & 0.4336 & 0.333068 \tabularnewline
39 & -0.021159 & -0.1653 & 0.434643 \tabularnewline
40 & -0.002272 & -0.0177 & 0.49295 \tabularnewline
41 & 0.014948 & 0.1167 & 0.453722 \tabularnewline
42 & 0.04123 & 0.322 & 0.374271 \tabularnewline
43 & -0.042941 & -0.3354 & 0.369244 \tabularnewline
44 & 0.088337 & 0.6899 & 0.246425 \tabularnewline
45 & -0.04141 & -0.3234 & 0.373742 \tabularnewline
46 & -0.006107 & -0.0477 & 0.481056 \tabularnewline
47 & 0.058445 & 0.4565 & 0.324836 \tabularnewline
48 & -0.072448 & -0.5658 & 0.28679 \tabularnewline
49 & -0.079316 & -0.6195 & 0.268955 \tabularnewline
50 & -0.012787 & -0.0999 & 0.460389 \tabularnewline
51 & -0.001153 & -0.009 & 0.496423 \tabularnewline
52 & -0.109608 & -0.8561 & 0.197656 \tabularnewline
53 & -0.048171 & -0.3762 & 0.354027 \tabularnewline
54 & 0.025901 & 0.2023 & 0.42018 \tabularnewline
55 & -0.0615 & -0.4803 & 0.316357 \tabularnewline
56 & 0.017429 & 0.1361 & 0.446084 \tabularnewline
57 & 0.042048 & 0.3284 & 0.371864 \tabularnewline
58 & 0.074984 & 0.5856 & 0.280139 \tabularnewline
59 & -0.120592 & -0.9419 & 0.174991 \tabularnewline
60 & -0.071753 & -0.5604 & 0.288626 \tabularnewline
\hline
\end{tabular}
%Source: https://freestatistics.org/blog/index.php?pk=59246&T=2

[TABLE]
[ROW][C]Partial Autocorrelation Function[/C][/ROW]
[ROW][C]Time lag k[/C][C]PACF(k)[/C][C]T-STAT[/C][C]P-value[/C][/ROW]
[ROW][C]1[/C][C]0.184382[/C][C]1.4401[/C][C]0.07748[/C][/ROW]
[ROW][C]2[/C][C]-0.147057[/C][C]-1.1486[/C][C]0.127612[/C][/ROW]
[ROW][C]3[/C][C]0.119234[/C][C]0.9312[/C][C]0.177698[/C][/ROW]
[ROW][C]4[/C][C]-0.019877[/C][C]-0.1552[/C][C]0.43857[/C][/ROW]
[ROW][C]5[/C][C]0.307786[/C][C]2.4039[/C][C]0.009638[/C][/ROW]
[ROW][C]6[/C][C]0.167384[/C][C]1.3073[/C][C]0.098007[/C][/ROW]
[ROW][C]7[/C][C]0.130885[/C][C]1.0222[/C][C]0.155352[/C][/ROW]
[ROW][C]8[/C][C]-0.131518[/C][C]-1.0272[/C][C]0.154193[/C][/ROW]
[ROW][C]9[/C][C]-0.037446[/C][C]-0.2925[/C][C]0.385463[/C][/ROW]
[ROW][C]10[/C][C]-0.42738[/C][C]-3.3379[/C][C]0.000721[/C][/ROW]
[ROW][C]11[/C][C]-0.021401[/C][C]-0.1671[/C][C]0.433904[/C][/ROW]
[ROW][C]12[/C][C]0.437999[/C][C]3.4209[/C][C]0.00056[/C][/ROW]
[ROW][C]13[/C][C]-0.150392[/C][C]-1.1746[/C][C]0.12236[/C][/ROW]
[ROW][C]14[/C][C]-0.065343[/C][C]-0.5103[/C][C]0.305827[/C][/ROW]
[ROW][C]15[/C][C]-0.105059[/C][C]-0.8205[/C][C]0.207552[/C][/ROW]
[ROW][C]16[/C][C]0.014282[/C][C]0.1115[/C][C]0.455776[/C][/ROW]
[ROW][C]17[/C][C]-0.090158[/C][C]-0.7042[/C][C]0.242008[/C][/ROW]
[ROW][C]18[/C][C]-0.06843[/C][C]-0.5345[/C][C]0.297483[/C][/ROW]
[ROW][C]19[/C][C]0.099719[/C][C]0.7788[/C][C]0.219546[/C][/ROW]
[ROW][C]20[/C][C]-0.052348[/C][C]-0.4089[/C][C]0.342041[/C][/ROW]
[ROW][C]21[/C][C]0.018425[/C][C]0.1439[/C][C]0.443027[/C][/ROW]
[ROW][C]22[/C][C]-0.109849[/C][C]-0.858[/C][C]0.197139[/C][/ROW]
[ROW][C]23[/C][C]-0.027135[/C][C]-0.2119[/C][C]0.416433[/C][/ROW]
[ROW][C]24[/C][C]-0.096302[/C][C]-0.7521[/C][C]0.227428[/C][/ROW]
[ROW][C]25[/C][C]0.020459[/C][C]0.1598[/C][C]0.436788[/C][/ROW]
[ROW][C]26[/C][C]-0.138793[/C][C]-1.084[/C][C]0.141314[/C][/ROW]
[ROW][C]27[/C][C]-0.025767[/C][C]-0.2012[/C][C]0.420588[/C][/ROW]
[ROW][C]28[/C][C]0.040736[/C][C]0.3182[/C][C]0.375727[/C][/ROW]
[ROW][C]29[/C][C]-0.074229[/C][C]-0.5797[/C][C]0.282111[/C][/ROW]
[ROW][C]30[/C][C]-0.053777[/C][C]-0.42[/C][C]0.337977[/C][/ROW]
[ROW][C]31[/C][C]-0.00973[/C][C]-0.076[/C][C]0.469838[/C][/ROW]
[ROW][C]32[/C][C]-0.005263[/C][C]-0.0411[/C][C]0.483672[/C][/ROW]
[ROW][C]33[/C][C]-0.044045[/C][C]-0.344[/C][C]0.366013[/C][/ROW]
[ROW][C]34[/C][C]0.108692[/C][C]0.8489[/C][C]0.199626[/C][/ROW]
[ROW][C]35[/C][C]-0.174723[/C][C]-1.3646[/C][C]0.088691[/C][/ROW]
[ROW][C]36[/C][C]-0.051535[/C][C]-0.4025[/C][C]0.344362[/C][/ROW]
[ROW][C]37[/C][C]-0.117636[/C][C]-0.9188[/C][C]0.180919[/C][/ROW]
[ROW][C]38[/C][C]0.055512[/C][C]0.4336[/C][C]0.333068[/C][/ROW]
[ROW][C]39[/C][C]-0.021159[/C][C]-0.1653[/C][C]0.434643[/C][/ROW]
[ROW][C]40[/C][C]-0.002272[/C][C]-0.0177[/C][C]0.49295[/C][/ROW]
[ROW][C]41[/C][C]0.014948[/C][C]0.1167[/C][C]0.453722[/C][/ROW]
[ROW][C]42[/C][C]0.04123[/C][C]0.322[/C][C]0.374271[/C][/ROW]
[ROW][C]43[/C][C]-0.042941[/C][C]-0.3354[/C][C]0.369244[/C][/ROW]
[ROW][C]44[/C][C]0.088337[/C][C]0.6899[/C][C]0.246425[/C][/ROW]
[ROW][C]45[/C][C]-0.04141[/C][C]-0.3234[/C][C]0.373742[/C][/ROW]
[ROW][C]46[/C][C]-0.006107[/C][C]-0.0477[/C][C]0.481056[/C][/ROW]
[ROW][C]47[/C][C]0.058445[/C][C]0.4565[/C][C]0.324836[/C][/ROW]
[ROW][C]48[/C][C]-0.072448[/C][C]-0.5658[/C][C]0.28679[/C][/ROW]
[ROW][C]49[/C][C]-0.079316[/C][C]-0.6195[/C][C]0.268955[/C][/ROW]
[ROW][C]50[/C][C]-0.012787[/C][C]-0.0999[/C][C]0.460389[/C][/ROW]
[ROW][C]51[/C][C]-0.001153[/C][C]-0.009[/C][C]0.496423[/C][/ROW]
[ROW][C]52[/C][C]-0.109608[/C][C]-0.8561[/C][C]0.197656[/C][/ROW]
[ROW][C]53[/C][C]-0.048171[/C][C]-0.3762[/C][C]0.354027[/C][/ROW]
[ROW][C]54[/C][C]0.025901[/C][C]0.2023[/C][C]0.42018[/C][/ROW]
[ROW][C]55[/C][C]-0.0615[/C][C]-0.4803[/C][C]0.316357[/C][/ROW]
[ROW][C]56[/C][C]0.017429[/C][C]0.1361[/C][C]0.446084[/C][/ROW]
[ROW][C]57[/C][C]0.042048[/C][C]0.3284[/C][C]0.371864[/C][/ROW]
[ROW][C]58[/C][C]0.074984[/C][C]0.5856[/C][C]0.280139[/C][/ROW]
[ROW][C]59[/C][C]-0.120592[/C][C]-0.9419[/C][C]0.174991[/C][/ROW]
[ROW][C]60[/C][C]-0.071753[/C][C]-0.5604[/C][C]0.288626[/C][/ROW]
[/TABLE]
Source: https://freestatistics.org/blog/index.php?pk=59246&T=2

Globally Unique Identifier (entire table): ba.freestatistics.org/blog/index.php?pk=59246&T=2

As an alternative you can also use a QR Code:  

The GUIDs for individual cells are displayed in the table below:

Partial Autocorrelation Function
Time lag kPACF(k)T-STATP-value
10.1843821.44010.07748
2-0.147057-1.14860.127612
30.1192340.93120.177698
4-0.019877-0.15520.43857
50.3077862.40390.009638
60.1673841.30730.098007
70.1308851.02220.155352
8-0.131518-1.02720.154193
9-0.037446-0.29250.385463
10-0.42738-3.33790.000721
11-0.021401-0.16710.433904
120.4379993.42090.00056
13-0.150392-1.17460.12236
14-0.065343-0.51030.305827
15-0.105059-0.82050.207552
160.0142820.11150.455776
17-0.090158-0.70420.242008
18-0.06843-0.53450.297483
190.0997190.77880.219546
20-0.052348-0.40890.342041
210.0184250.14390.443027
22-0.109849-0.8580.197139
23-0.027135-0.21190.416433
24-0.096302-0.75210.227428
250.0204590.15980.436788
26-0.138793-1.0840.141314
27-0.025767-0.20120.420588
280.0407360.31820.375727
29-0.074229-0.57970.282111
30-0.053777-0.420.337977
31-0.00973-0.0760.469838
32-0.005263-0.04110.483672
33-0.044045-0.3440.366013
340.1086920.84890.199626
35-0.174723-1.36460.088691
36-0.051535-0.40250.344362
37-0.117636-0.91880.180919
380.0555120.43360.333068
39-0.021159-0.16530.434643
40-0.002272-0.01770.49295
410.0149480.11670.453722
420.041230.3220.374271
43-0.042941-0.33540.369244
440.0883370.68990.246425
45-0.04141-0.32340.373742
46-0.006107-0.04770.481056
470.0584450.45650.324836
48-0.072448-0.56580.28679
49-0.079316-0.61950.268955
50-0.012787-0.09990.460389
51-0.001153-0.0090.496423
52-0.109608-0.85610.197656
53-0.048171-0.37620.354027
540.0259010.20230.42018
55-0.0615-0.48030.316357
560.0174290.13610.446084
570.0420480.32840.371864
580.0749840.58560.280139
59-0.120592-0.94190.174991
60-0.071753-0.56040.288626


Parameters (Session):
par1 = 60 ; par2 = 1 ; par3 = 0 ; par4 = 0 ; par5 = 12 ; par6 = MA ; par7 = 0.95 ;
Parameters (R input):
par1 = 60 ; par2 = 1 ; par3 = 0 ; par4 = 0 ; par5 = 12 ; par6 = MA ; par7 = 0.95 ;
R code (references can be found in the software module):
if (par1 == 'Default') {
par1 = 10*log10(length(x))
} else {
par1 <- as.numeric(par1)
}
par2 <- as.numeric(par2)
par3 <- as.numeric(par3)
par4 <- as.numeric(par4)
par5 <- as.numeric(par5)
if (par6 == 'White Noise') par6 <- 'white' else par6 <- 'ma'
par7 <- as.numeric(par7)
if (par2 == 0) {
x <- log(x)
} else {
x <- (x ^ par2 - 1) / par2
}
if (par3 > 0) x <- diff(x,lag=1,difference=par3)
if (par4 > 0) x <- diff(x,lag=par5,difference=par4)
bitmap(file='pic1.png')
racf <- acf(x, par1, main='Autocorrelation', xlab='time lag', ylab='ACF', ci.type=par6, ci=par7, sub=paste('(lambda=',par2,', d=',par3,', D=',par4,', CI=', par7, ', CI type=',par6,')',sep=''))
dev.off()
bitmap(file='pic2.png')
rpacf <- pacf(x,par1,main='Partial Autocorrelation',xlab='lags',ylab='PACF')
dev.off()
(myacf <- c(racf$acf))
(mypacf <- c(rpacf$acf))
lengthx <- length(x)
sqrtn <- sqrt(lengthx)
load(file='createtable')
a<-table.start()
a<-table.row.start(a)
a<-table.element(a,'Autocorrelation Function',4,TRUE)
a<-table.row.end(a)
a<-table.row.start(a)
a<-table.element(a,'Time lag k',header=TRUE)
a<-table.element(a,hyperlink('basics.htm','ACF(k)','click here for more information about the Autocorrelation Function'),header=TRUE)
a<-table.element(a,'T-STAT',header=TRUE)
a<-table.element(a,'P-value',header=TRUE)
a<-table.row.end(a)
for (i in 2:(par1+1)) {
a<-table.row.start(a)
a<-table.element(a,i-1,header=TRUE)
a<-table.element(a,round(myacf[i],6))
mytstat <- myacf[i]*sqrtn
a<-table.element(a,round(mytstat,4))
a<-table.element(a,round(1-pt(abs(mytstat),lengthx),6))
a<-table.row.end(a)
}
a<-table.end(a)
table.save(a,file='mytable.tab')
a<-table.start()
a<-table.row.start(a)
a<-table.element(a,'Partial Autocorrelation Function',4,TRUE)
a<-table.row.end(a)
a<-table.row.start(a)
a<-table.element(a,'Time lag k',header=TRUE)
a<-table.element(a,hyperlink('basics.htm','PACF(k)','click here for more information about the Partial Autocorrelation Function'),header=TRUE)
a<-table.element(a,'T-STAT',header=TRUE)
a<-table.element(a,'P-value',header=TRUE)
a<-table.row.end(a)
for (i in 1:par1) {
a<-table.row.start(a)
a<-table.element(a,i,header=TRUE)
a<-table.element(a,round(mypacf[i],6))
mytstat <- mypacf[i]*sqrtn
a<-table.element(a,round(mytstat,4))
a<-table.element(a,round(1-pt(abs(mytstat),lengthx),6))
a<-table.row.end(a)
}
a<-table.end(a)
table.save(a,file='mytable1.tab')