Free Statistics

of Irreproducible Research!

Author's title

Author*The author of this computation has been verified*
R Software Modulerwasp_smp.wasp
Title produced by softwareStandard Deviation-Mean Plot
Date of computationTue, 24 Nov 2009 12:14:21 -0700
Cite this page as followsStatistical Computations at FreeStatistics.org, Office for Research Development and Education, URL https://freestatistics.org/blog/index.php?v=date/2009/Nov/24/t1259090099j8y0jx54py9xcyx.htm/, Retrieved Tue, 16 Apr 2024 10:27:11 +0000
Statistical Computations at FreeStatistics.org, Office for Research Development and Education, URL https://freestatistics.org/blog/index.php?pk=59243, Retrieved Tue, 16 Apr 2024 10:27:11 +0000
QR Codes:

Original text written by user:
IsPrivate?No (this computation is public)
User-defined keywordsws8heteroskedasticity
Estimated Impact154
Family? (F = Feedback message, R = changed R code, M = changed R Module, P = changed Parameters, D = changed Data)
-     [Univariate Explorative Data Analysis] [Run Sequence gebo...] [2008-12-12 13:32:37] [76963dc1903f0f612b6153510a3818cf]
- R  D  [Univariate Explorative Data Analysis] [Run Sequence gebo...] [2008-12-17 12:14:40] [76963dc1903f0f612b6153510a3818cf]
-         [Univariate Explorative Data Analysis] [Run Sequence Plot...] [2008-12-22 18:19:51] [1ce0d16c8f4225c977b42c8fa93bc163]
- RMP       [Spectral Analysis] [Identifying Integ...] [2009-11-22 12:38:17] [b98453cac15ba1066b407e146608df68]
- RMPD          [Standard Deviation-Mean Plot] [] [2009-11-24 19:14:21] [4563e36d4b7005634fe3557528d9fcab] [Current]
Feedback Forum

Post a new message
Dataseries X:
7291
6820
8031
7862
7357
7213
7079
7012
7319
8148
7599
6908
7878
7407
7911
7323
7179
6758
6934
6696
7688
8296
7697
7907
7592
7710
9011
8225
7733
8062
7859
8221
8330
8868
9053
8811
8120
7953
8878
8601
8361
9116
9310
9891
10147
10317
10682
10276
10614
9413
11068
9772
10350
10541
10049
10714
10759
11684
11462
10485
11056
10184
11082
10554
11315
10847
11104
11026
11073
12073
12328
11172


Summary of computational transaction
Raw Inputview raw input (R code)
Raw Outputview raw output of R engine
Computing time1 seconds
R Server'Gwilym Jenkins' @ 72.249.127.135

\begin{tabular}{lllllllll}
\hline
Summary of computational transaction \tabularnewline
Raw Input & view raw input (R code)  \tabularnewline
Raw Output & view raw output of R engine  \tabularnewline
Computing time & 1 seconds \tabularnewline
R Server & 'Gwilym Jenkins' @ 72.249.127.135 \tabularnewline
\hline
\end{tabular}
%Source: https://freestatistics.org/blog/index.php?pk=59243&T=0

[TABLE]
[ROW][C]Summary of computational transaction[/C][/ROW]
[ROW][C]Raw Input[/C][C]view raw input (R code) [/C][/ROW]
[ROW][C]Raw Output[/C][C]view raw output of R engine [/C][/ROW]
[ROW][C]Computing time[/C][C]1 seconds[/C][/ROW]
[ROW][C]R Server[/C][C]'Gwilym Jenkins' @ 72.249.127.135[/C][/ROW]
[/TABLE]
Source: https://freestatistics.org/blog/index.php?pk=59243&T=0

Globally Unique Identifier (entire table): ba.freestatistics.org/blog/index.php?pk=59243&T=0

As an alternative you can also use a QR Code:  

The GUIDs for individual cells are displayed in the table below:

Summary of computational transaction
Raw Inputview raw input (R code)
Raw Outputview raw output of R engine
Computing time1 seconds
R Server'Gwilym Jenkins' @ 72.249.127.135


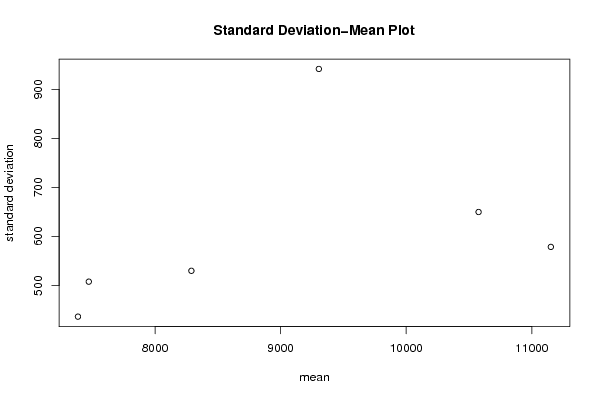
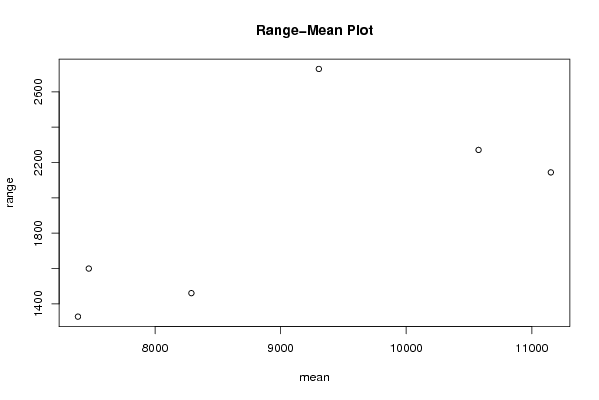
Standard Deviation-Mean Plot
SectionMeanStandard DeviationRange
17386.58333333333436.5004338919711328
27472.83333333333507.8225948880061600
38289.58333333333529.9842979377841461
49304.33333333333941.5859284239872729
510575.9166666667649.894880777352271
611151.1666666667578.742183663432144

\begin{tabular}{lllllllll}
\hline
Standard Deviation-Mean Plot \tabularnewline
Section & Mean & Standard Deviation & Range \tabularnewline
1 & 7386.58333333333 & 436.500433891971 & 1328 \tabularnewline
2 & 7472.83333333333 & 507.822594888006 & 1600 \tabularnewline
3 & 8289.58333333333 & 529.984297937784 & 1461 \tabularnewline
4 & 9304.33333333333 & 941.585928423987 & 2729 \tabularnewline
5 & 10575.9166666667 & 649.89488077735 & 2271 \tabularnewline
6 & 11151.1666666667 & 578.74218366343 & 2144 \tabularnewline
\hline
\end{tabular}
%Source: https://freestatistics.org/blog/index.php?pk=59243&T=1

[TABLE]
[ROW][C]Standard Deviation-Mean Plot[/C][/ROW]
[ROW][C]Section[/C][C]Mean[/C][C]Standard Deviation[/C][C]Range[/C][/ROW]
[ROW][C]1[/C][C]7386.58333333333[/C][C]436.500433891971[/C][C]1328[/C][/ROW]
[ROW][C]2[/C][C]7472.83333333333[/C][C]507.822594888006[/C][C]1600[/C][/ROW]
[ROW][C]3[/C][C]8289.58333333333[/C][C]529.984297937784[/C][C]1461[/C][/ROW]
[ROW][C]4[/C][C]9304.33333333333[/C][C]941.585928423987[/C][C]2729[/C][/ROW]
[ROW][C]5[/C][C]10575.9166666667[/C][C]649.89488077735[/C][C]2271[/C][/ROW]
[ROW][C]6[/C][C]11151.1666666667[/C][C]578.74218366343[/C][C]2144[/C][/ROW]
[/TABLE]
Source: https://freestatistics.org/blog/index.php?pk=59243&T=1

Globally Unique Identifier (entire table): ba.freestatistics.org/blog/index.php?pk=59243&T=1

As an alternative you can also use a QR Code:  

The GUIDs for individual cells are displayed in the table below:

Standard Deviation-Mean Plot
SectionMeanStandard DeviationRange
17386.58333333333436.5004338919711328
27472.83333333333507.8225948880061600
38289.58333333333529.9842979377841461
49304.33333333333941.5859284239872729
510575.9166666667649.894880777352271
611151.1666666667578.742183663432144


Regression: S.E.(k) = alpha + beta * Mean(k)
alpha185.992969685433
beta0.0466694916177265
S.D.0.0510789886574395
T-STAT0.913672976783365
p-value0.412579712848015

\begin{tabular}{lllllllll}
\hline
Regression: S.E.(k) = alpha + beta * Mean(k) \tabularnewline
alpha & 185.992969685433 \tabularnewline
beta & 0.0466694916177265 \tabularnewline
S.D. & 0.0510789886574395 \tabularnewline
T-STAT & 0.913672976783365 \tabularnewline
p-value & 0.412579712848015 \tabularnewline
\hline
\end{tabular}
%Source: https://freestatistics.org/blog/index.php?pk=59243&T=2

[TABLE]
[ROW][C]Regression: S.E.(k) = alpha + beta * Mean(k)[/C][/ROW]
[ROW][C]alpha[/C][C]185.992969685433[/C][/ROW]
[ROW][C]beta[/C][C]0.0466694916177265[/C][/ROW]
[ROW][C]S.D.[/C][C]0.0510789886574395[/C][/ROW]
[ROW][C]T-STAT[/C][C]0.913672976783365[/C][/ROW]
[ROW][C]p-value[/C][C]0.412579712848015[/C][/ROW]
[/TABLE]
Source: https://freestatistics.org/blog/index.php?pk=59243&T=2

Globally Unique Identifier (entire table): ba.freestatistics.org/blog/index.php?pk=59243&T=2

As an alternative you can also use a QR Code:  

The GUIDs for individual cells are displayed in the table below:

Regression: S.E.(k) = alpha + beta * Mean(k)
alpha185.992969685433
beta0.0466694916177265
S.D.0.0510789886574395
T-STAT0.913672976783365
p-value0.412579712848015


Regression: ln S.E.(k) = alpha + beta * ln Mean(k)
alpha-0.94653495843619
beta0.805272788312413
S.D.0.64423468198314
T-STAT1.24996807969660
p-value0.279450141473115
Lambda0.194727211687587

\begin{tabular}{lllllllll}
\hline
Regression: ln S.E.(k) = alpha + beta * ln Mean(k) \tabularnewline
alpha & -0.94653495843619 \tabularnewline
beta & 0.805272788312413 \tabularnewline
S.D. & 0.64423468198314 \tabularnewline
T-STAT & 1.24996807969660 \tabularnewline
p-value & 0.279450141473115 \tabularnewline
Lambda & 0.194727211687587 \tabularnewline
\hline
\end{tabular}
%Source: https://freestatistics.org/blog/index.php?pk=59243&T=3

[TABLE]
[ROW][C]Regression: ln S.E.(k) = alpha + beta * ln Mean(k)[/C][/ROW]
[ROW][C]alpha[/C][C]-0.94653495843619[/C][/ROW]
[ROW][C]beta[/C][C]0.805272788312413[/C][/ROW]
[ROW][C]S.D.[/C][C]0.64423468198314[/C][/ROW]
[ROW][C]T-STAT[/C][C]1.24996807969660[/C][/ROW]
[ROW][C]p-value[/C][C]0.279450141473115[/C][/ROW]
[ROW][C]Lambda[/C][C]0.194727211687587[/C][/ROW]
[/TABLE]
Source: https://freestatistics.org/blog/index.php?pk=59243&T=3

Globally Unique Identifier (entire table): ba.freestatistics.org/blog/index.php?pk=59243&T=3

As an alternative you can also use a QR Code:  

The GUIDs for individual cells are displayed in the table below:

Regression: ln S.E.(k) = alpha + beta * ln Mean(k)
alpha-0.94653495843619
beta0.805272788312413
S.D.0.64423468198314
T-STAT1.24996807969660
p-value0.279450141473115
Lambda0.194727211687587


Parameters (Session):
par1 = 12 ;
Parameters (R input):
par1 = 12 ;
R code (references can be found in the software module):
par1 <- as.numeric(par1)
(n <- length(x))
(np <- floor(n / par1))
arr <- array(NA,dim=c(par1,np))
j <- 0
k <- 1
for (i in 1:(np*par1))
{
j = j + 1
arr[j,k] <- x[i]
if (j == par1) {
j = 0
k=k+1
}
}
arr
arr.mean <- array(NA,dim=np)
arr.sd <- array(NA,dim=np)
arr.range <- array(NA,dim=np)
for (j in 1:np)
{
arr.mean[j] <- mean(arr[,j],na.rm=TRUE)
arr.sd[j] <- sd(arr[,j],na.rm=TRUE)
arr.range[j] <- max(arr[,j],na.rm=TRUE) - min(arr[,j],na.rm=TRUE)
}
arr.mean
arr.sd
arr.range
(lm1 <- lm(arr.sd~arr.mean))
(lnlm1 <- lm(log(arr.sd)~log(arr.mean)))
(lm2 <- lm(arr.range~arr.mean))
bitmap(file='test1.png')
plot(arr.mean,arr.sd,main='Standard Deviation-Mean Plot',xlab='mean',ylab='standard deviation')
dev.off()
bitmap(file='test2.png')
plot(arr.mean,arr.range,main='Range-Mean Plot',xlab='mean',ylab='range')
dev.off()
load(file='createtable')
a<-table.start()
a<-table.row.start(a)
a<-table.element(a,'Standard Deviation-Mean Plot',4,TRUE)
a<-table.row.end(a)
a<-table.row.start(a)
a<-table.element(a,'Section',header=TRUE)
a<-table.element(a,'Mean',header=TRUE)
a<-table.element(a,'Standard Deviation',header=TRUE)
a<-table.element(a,'Range',header=TRUE)
a<-table.row.end(a)
for (j in 1:np) {
a<-table.row.start(a)
a<-table.element(a,j,header=TRUE)
a<-table.element(a,arr.mean[j])
a<-table.element(a,arr.sd[j] )
a<-table.element(a,arr.range[j] )
a<-table.row.end(a)
}
a<-table.end(a)
table.save(a,file='mytable.tab')
a<-table.start()
a<-table.row.start(a)
a<-table.element(a,'Regression: S.E.(k) = alpha + beta * Mean(k)',2,TRUE)
a<-table.row.end(a)
a<-table.row.start(a)
a<-table.element(a,'alpha',header=TRUE)
a<-table.element(a,lm1$coefficients[[1]])
a<-table.row.end(a)
a<-table.row.start(a)
a<-table.element(a,'beta',header=TRUE)
a<-table.element(a,lm1$coefficients[[2]])
a<-table.row.end(a)
a<-table.row.start(a)
a<-table.element(a,'S.D.',header=TRUE)
a<-table.element(a,summary(lm1)$coefficients[2,2])
a<-table.row.end(a)
a<-table.row.start(a)
a<-table.element(a,'T-STAT',header=TRUE)
a<-table.element(a,summary(lm1)$coefficients[2,3])
a<-table.row.end(a)
a<-table.row.start(a)
a<-table.element(a,'p-value',header=TRUE)
a<-table.element(a,summary(lm1)$coefficients[2,4])
a<-table.row.end(a)
a<-table.end(a)
table.save(a,file='mytable1.tab')
a<-table.start()
a<-table.row.start(a)
a<-table.element(a,'Regression: ln S.E.(k) = alpha + beta * ln Mean(k)',2,TRUE)
a<-table.row.end(a)
a<-table.row.start(a)
a<-table.element(a,'alpha',header=TRUE)
a<-table.element(a,lnlm1$coefficients[[1]])
a<-table.row.end(a)
a<-table.row.start(a)
a<-table.element(a,'beta',header=TRUE)
a<-table.element(a,lnlm1$coefficients[[2]])
a<-table.row.end(a)
a<-table.row.start(a)
a<-table.element(a,'S.D.',header=TRUE)
a<-table.element(a,summary(lnlm1)$coefficients[2,2])
a<-table.row.end(a)
a<-table.row.start(a)
a<-table.element(a,'T-STAT',header=TRUE)
a<-table.element(a,summary(lnlm1)$coefficients[2,3])
a<-table.row.end(a)
a<-table.row.start(a)
a<-table.element(a,'p-value',header=TRUE)
a<-table.element(a,summary(lnlm1)$coefficients[2,4])
a<-table.row.end(a)
a<-table.row.start(a)
a<-table.element(a,'Lambda',header=TRUE)
a<-table.element(a,1-lnlm1$coefficients[[2]])
a<-table.row.end(a)
a<-table.end(a)
table.save(a,file='mytable2.tab')