Free Statistics

of Irreproducible Research!

Author's title

Author*The author of this computation has been verified*
R Software Modulerwasp_autocorrelation.wasp
Title produced by software(Partial) Autocorrelation Function
Date of computationTue, 24 Nov 2009 12:02:21 -0700
Cite this page as followsStatistical Computations at FreeStatistics.org, Office for Research Development and Education, URL https://freestatistics.org/blog/index.php?v=date/2009/Nov/24/t1259089406u1cabyphpdtc9pp.htm/, Retrieved Thu, 25 Apr 2024 22:05:44 +0000
Statistical Computations at FreeStatistics.org, Office for Research Development and Education, URL https://freestatistics.org/blog/index.php?pk=59230, Retrieved Thu, 25 Apr 2024 22:05:44 +0000
QR Codes:

Original text written by user:
IsPrivate?No (this computation is public)
User-defined keywordsws8
Estimated Impact152
Family? (F = Feedback message, R = changed R code, M = changed R Module, P = changed Parameters, D = changed Data)
-       [(Partial) Autocorrelation Function] [] [2009-11-24 19:02:21] [4563e36d4b7005634fe3557528d9fcab] [Current]
-   P     [(Partial) Autocorrelation Function] [review WS9] [2009-12-09 16:02:19] [af2352cd9a951bedd08ebe247d0de1a2]
Feedback Forum

Post a new message
Dataseries X:
7291
6820
8031
7862
7357
7213
7079
7012
7319
8148
7599
6908
7878
7407
7911
7323
7179
6758
6934
6696
7688
8296
7697
7907
7592
7710
9011
8225
7733
8062
7859
8221
8330
8868
9053
8811
8120
7953
8878
8601
8361
9116
9310
9891
10147
10317
10682
10276
10614
9413
11068
9772
10350
10541
10049
10714
10759
11684
11462
10485
11056
10184
11082
10554
11315
10847
11104
11026
11073
12073
12328
11172


Summary of computational transaction
Raw Inputview raw input (R code)
Raw Outputview raw output of R engine
Computing time1 seconds
R Server'Gwilym Jenkins' @ 72.249.127.135

\begin{tabular}{lllllllll}
\hline
Summary of computational transaction \tabularnewline
Raw Input & view raw input (R code)  \tabularnewline
Raw Output & view raw output of R engine  \tabularnewline
Computing time & 1 seconds \tabularnewline
R Server & 'Gwilym Jenkins' @ 72.249.127.135 \tabularnewline
\hline
\end{tabular}
%Source: https://freestatistics.org/blog/index.php?pk=59230&T=0

[TABLE]
[ROW][C]Summary of computational transaction[/C][/ROW]
[ROW][C]Raw Input[/C][C]view raw input (R code) [/C][/ROW]
[ROW][C]Raw Output[/C][C]view raw output of R engine [/C][/ROW]
[ROW][C]Computing time[/C][C]1 seconds[/C][/ROW]
[ROW][C]R Server[/C][C]'Gwilym Jenkins' @ 72.249.127.135[/C][/ROW]
[/TABLE]
Source: https://freestatistics.org/blog/index.php?pk=59230&T=0

Globally Unique Identifier (entire table): ba.freestatistics.org/blog/index.php?pk=59230&T=0

As an alternative you can also use a QR Code:  

The GUIDs for individual cells are displayed in the table below:

Summary of computational transaction
Raw Inputview raw input (R code)
Raw Outputview raw output of R engine
Computing time1 seconds
R Server'Gwilym Jenkins' @ 72.249.127.135


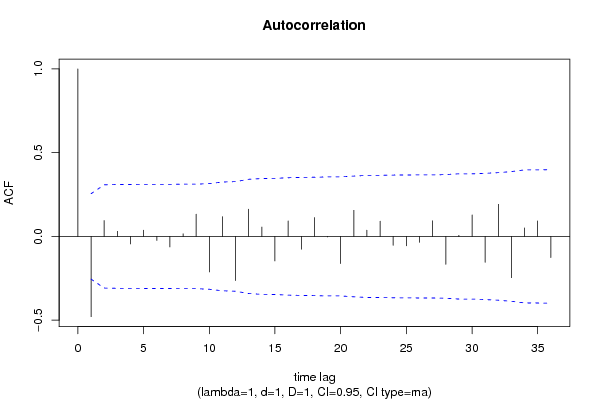
Autocorrelation Function
Time lag kACF(k)T-STATP-value
1-0.478999-3.67930.000254
20.0950880.73040.234022
30.0304840.23420.407839
4-0.044619-0.34270.366512
50.0369580.28390.388749
6-0.023833-0.18310.427688
7-0.062737-0.48190.315832
80.0156560.12030.452343
90.1328761.02060.155796
10-0.212252-1.63030.054179
110.1176790.90390.184859
12-0.263882-2.02690.023599
130.1627871.25040.108046
140.0561970.43170.333783
15-0.146649-1.12640.132273
160.0923780.70960.240382
17-0.076303-0.58610.280025
180.1123970.86330.195725
19-0.003333-0.02560.489832
20-0.162355-1.24710.108649
210.1560711.19880.117699
220.0372520.28610.387888
230.0910070.6990.243638
24-0.053264-0.40910.341962
25-0.056126-0.43110.33398
26-0.034868-0.26780.394884
270.093110.71520.238657
28-0.166261-1.27710.10329
290.0065150.050.48013
300.1282040.98480.164383
31-0.154399-1.1860.120196
320.1916541.47210.073151
33-0.246038-1.88990.031847
340.0507280.38970.349098
350.092490.71040.240118
36-0.126073-0.96840.168403

\begin{tabular}{lllllllll}
\hline
Autocorrelation Function \tabularnewline
Time lag k & ACF(k) & T-STAT & P-value \tabularnewline
1 & -0.478999 & -3.6793 & 0.000254 \tabularnewline
2 & 0.095088 & 0.7304 & 0.234022 \tabularnewline
3 & 0.030484 & 0.2342 & 0.407839 \tabularnewline
4 & -0.044619 & -0.3427 & 0.366512 \tabularnewline
5 & 0.036958 & 0.2839 & 0.388749 \tabularnewline
6 & -0.023833 & -0.1831 & 0.427688 \tabularnewline
7 & -0.062737 & -0.4819 & 0.315832 \tabularnewline
8 & 0.015656 & 0.1203 & 0.452343 \tabularnewline
9 & 0.132876 & 1.0206 & 0.155796 \tabularnewline
10 & -0.212252 & -1.6303 & 0.054179 \tabularnewline
11 & 0.117679 & 0.9039 & 0.184859 \tabularnewline
12 & -0.263882 & -2.0269 & 0.023599 \tabularnewline
13 & 0.162787 & 1.2504 & 0.108046 \tabularnewline
14 & 0.056197 & 0.4317 & 0.333783 \tabularnewline
15 & -0.146649 & -1.1264 & 0.132273 \tabularnewline
16 & 0.092378 & 0.7096 & 0.240382 \tabularnewline
17 & -0.076303 & -0.5861 & 0.280025 \tabularnewline
18 & 0.112397 & 0.8633 & 0.195725 \tabularnewline
19 & -0.003333 & -0.0256 & 0.489832 \tabularnewline
20 & -0.162355 & -1.2471 & 0.108649 \tabularnewline
21 & 0.156071 & 1.1988 & 0.117699 \tabularnewline
22 & 0.037252 & 0.2861 & 0.387888 \tabularnewline
23 & 0.091007 & 0.699 & 0.243638 \tabularnewline
24 & -0.053264 & -0.4091 & 0.341962 \tabularnewline
25 & -0.056126 & -0.4311 & 0.33398 \tabularnewline
26 & -0.034868 & -0.2678 & 0.394884 \tabularnewline
27 & 0.09311 & 0.7152 & 0.238657 \tabularnewline
28 & -0.166261 & -1.2771 & 0.10329 \tabularnewline
29 & 0.006515 & 0.05 & 0.48013 \tabularnewline
30 & 0.128204 & 0.9848 & 0.164383 \tabularnewline
31 & -0.154399 & -1.186 & 0.120196 \tabularnewline
32 & 0.191654 & 1.4721 & 0.073151 \tabularnewline
33 & -0.246038 & -1.8899 & 0.031847 \tabularnewline
34 & 0.050728 & 0.3897 & 0.349098 \tabularnewline
35 & 0.09249 & 0.7104 & 0.240118 \tabularnewline
36 & -0.126073 & -0.9684 & 0.168403 \tabularnewline
\hline
\end{tabular}
%Source: https://freestatistics.org/blog/index.php?pk=59230&T=1

[TABLE]
[ROW][C]Autocorrelation Function[/C][/ROW]
[ROW][C]Time lag k[/C][C]ACF(k)[/C][C]T-STAT[/C][C]P-value[/C][/ROW]
[ROW][C]1[/C][C]-0.478999[/C][C]-3.6793[/C][C]0.000254[/C][/ROW]
[ROW][C]2[/C][C]0.095088[/C][C]0.7304[/C][C]0.234022[/C][/ROW]
[ROW][C]3[/C][C]0.030484[/C][C]0.2342[/C][C]0.407839[/C][/ROW]
[ROW][C]4[/C][C]-0.044619[/C][C]-0.3427[/C][C]0.366512[/C][/ROW]
[ROW][C]5[/C][C]0.036958[/C][C]0.2839[/C][C]0.388749[/C][/ROW]
[ROW][C]6[/C][C]-0.023833[/C][C]-0.1831[/C][C]0.427688[/C][/ROW]
[ROW][C]7[/C][C]-0.062737[/C][C]-0.4819[/C][C]0.315832[/C][/ROW]
[ROW][C]8[/C][C]0.015656[/C][C]0.1203[/C][C]0.452343[/C][/ROW]
[ROW][C]9[/C][C]0.132876[/C][C]1.0206[/C][C]0.155796[/C][/ROW]
[ROW][C]10[/C][C]-0.212252[/C][C]-1.6303[/C][C]0.054179[/C][/ROW]
[ROW][C]11[/C][C]0.117679[/C][C]0.9039[/C][C]0.184859[/C][/ROW]
[ROW][C]12[/C][C]-0.263882[/C][C]-2.0269[/C][C]0.023599[/C][/ROW]
[ROW][C]13[/C][C]0.162787[/C][C]1.2504[/C][C]0.108046[/C][/ROW]
[ROW][C]14[/C][C]0.056197[/C][C]0.4317[/C][C]0.333783[/C][/ROW]
[ROW][C]15[/C][C]-0.146649[/C][C]-1.1264[/C][C]0.132273[/C][/ROW]
[ROW][C]16[/C][C]0.092378[/C][C]0.7096[/C][C]0.240382[/C][/ROW]
[ROW][C]17[/C][C]-0.076303[/C][C]-0.5861[/C][C]0.280025[/C][/ROW]
[ROW][C]18[/C][C]0.112397[/C][C]0.8633[/C][C]0.195725[/C][/ROW]
[ROW][C]19[/C][C]-0.003333[/C][C]-0.0256[/C][C]0.489832[/C][/ROW]
[ROW][C]20[/C][C]-0.162355[/C][C]-1.2471[/C][C]0.108649[/C][/ROW]
[ROW][C]21[/C][C]0.156071[/C][C]1.1988[/C][C]0.117699[/C][/ROW]
[ROW][C]22[/C][C]0.037252[/C][C]0.2861[/C][C]0.387888[/C][/ROW]
[ROW][C]23[/C][C]0.091007[/C][C]0.699[/C][C]0.243638[/C][/ROW]
[ROW][C]24[/C][C]-0.053264[/C][C]-0.4091[/C][C]0.341962[/C][/ROW]
[ROW][C]25[/C][C]-0.056126[/C][C]-0.4311[/C][C]0.33398[/C][/ROW]
[ROW][C]26[/C][C]-0.034868[/C][C]-0.2678[/C][C]0.394884[/C][/ROW]
[ROW][C]27[/C][C]0.09311[/C][C]0.7152[/C][C]0.238657[/C][/ROW]
[ROW][C]28[/C][C]-0.166261[/C][C]-1.2771[/C][C]0.10329[/C][/ROW]
[ROW][C]29[/C][C]0.006515[/C][C]0.05[/C][C]0.48013[/C][/ROW]
[ROW][C]30[/C][C]0.128204[/C][C]0.9848[/C][C]0.164383[/C][/ROW]
[ROW][C]31[/C][C]-0.154399[/C][C]-1.186[/C][C]0.120196[/C][/ROW]
[ROW][C]32[/C][C]0.191654[/C][C]1.4721[/C][C]0.073151[/C][/ROW]
[ROW][C]33[/C][C]-0.246038[/C][C]-1.8899[/C][C]0.031847[/C][/ROW]
[ROW][C]34[/C][C]0.050728[/C][C]0.3897[/C][C]0.349098[/C][/ROW]
[ROW][C]35[/C][C]0.09249[/C][C]0.7104[/C][C]0.240118[/C][/ROW]
[ROW][C]36[/C][C]-0.126073[/C][C]-0.9684[/C][C]0.168403[/C][/ROW]
[/TABLE]
Source: https://freestatistics.org/blog/index.php?pk=59230&T=1

Globally Unique Identifier (entire table): ba.freestatistics.org/blog/index.php?pk=59230&T=1

As an alternative you can also use a QR Code:  

The GUIDs for individual cells are displayed in the table below:

Autocorrelation Function
Time lag kACF(k)T-STATP-value
1-0.478999-3.67930.000254
20.0950880.73040.234022
30.0304840.23420.407839
4-0.044619-0.34270.366512
50.0369580.28390.388749
6-0.023833-0.18310.427688
7-0.062737-0.48190.315832
80.0156560.12030.452343
90.1328761.02060.155796
10-0.212252-1.63030.054179
110.1176790.90390.184859
12-0.263882-2.02690.023599
130.1627871.25040.108046
140.0561970.43170.333783
15-0.146649-1.12640.132273
160.0923780.70960.240382
17-0.076303-0.58610.280025
180.1123970.86330.195725
19-0.003333-0.02560.489832
20-0.162355-1.24710.108649
210.1560711.19880.117699
220.0372520.28610.387888
230.0910070.6990.243638
24-0.053264-0.40910.341962
25-0.056126-0.43110.33398
26-0.034868-0.26780.394884
270.093110.71520.238657
28-0.166261-1.27710.10329
290.0065150.050.48013
300.1282040.98480.164383
31-0.154399-1.1860.120196
320.1916541.47210.073151
33-0.246038-1.88990.031847
340.0507280.38970.349098
350.092490.71040.240118
36-0.126073-0.96840.168403


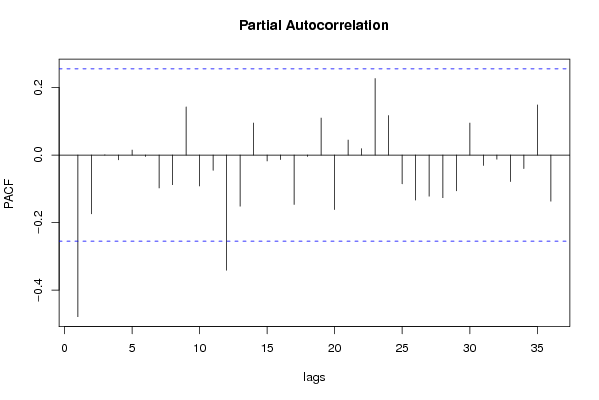
Partial Autocorrelation Function
Time lag kPACF(k)T-STATP-value
1-0.478999-3.67930.000254
2-0.174356-1.33930.092812
30.000610.00470.498138
4-0.014235-0.10930.456651
50.0148980.11440.45464
6-0.004134-0.03180.487389
7-0.097486-0.74880.228475
8-0.087704-0.67370.251577
90.1425511.0950.138992
10-0.091724-0.70450.241932
11-0.045348-0.34830.364417
12-0.341405-2.62240.005546
13-0.151519-1.16380.124587
140.0949710.72950.234296
15-0.017485-0.13430.446809
16-0.013288-0.10210.459524
17-0.146345-1.12410.132763
18-0.004328-0.03320.486797
190.1095850.84170.201667
20-0.161485-1.24040.109871
210.044380.34090.367198
220.0189030.14520.442524
230.2267211.74150.043406
240.1169950.89870.186245
25-0.085158-0.65410.25779
26-0.133555-1.02590.154574
27-0.121888-0.93620.176484
28-0.126426-0.97110.167732
29-0.106076-0.81480.209237
300.0946780.72720.234979
31-0.030807-0.23660.406882
32-0.012485-0.09590.461962
33-0.07876-0.6050.27376
34-0.040257-0.30920.379121
350.1484521.14030.129389
36-0.136938-1.05180.148582

\begin{tabular}{lllllllll}
\hline
Partial Autocorrelation Function \tabularnewline
Time lag k & PACF(k) & T-STAT & P-value \tabularnewline
1 & -0.478999 & -3.6793 & 0.000254 \tabularnewline
2 & -0.174356 & -1.3393 & 0.092812 \tabularnewline
3 & 0.00061 & 0.0047 & 0.498138 \tabularnewline
4 & -0.014235 & -0.1093 & 0.456651 \tabularnewline
5 & 0.014898 & 0.1144 & 0.45464 \tabularnewline
6 & -0.004134 & -0.0318 & 0.487389 \tabularnewline
7 & -0.097486 & -0.7488 & 0.228475 \tabularnewline
8 & -0.087704 & -0.6737 & 0.251577 \tabularnewline
9 & 0.142551 & 1.095 & 0.138992 \tabularnewline
10 & -0.091724 & -0.7045 & 0.241932 \tabularnewline
11 & -0.045348 & -0.3483 & 0.364417 \tabularnewline
12 & -0.341405 & -2.6224 & 0.005546 \tabularnewline
13 & -0.151519 & -1.1638 & 0.124587 \tabularnewline
14 & 0.094971 & 0.7295 & 0.234296 \tabularnewline
15 & -0.017485 & -0.1343 & 0.446809 \tabularnewline
16 & -0.013288 & -0.1021 & 0.459524 \tabularnewline
17 & -0.146345 & -1.1241 & 0.132763 \tabularnewline
18 & -0.004328 & -0.0332 & 0.486797 \tabularnewline
19 & 0.109585 & 0.8417 & 0.201667 \tabularnewline
20 & -0.161485 & -1.2404 & 0.109871 \tabularnewline
21 & 0.04438 & 0.3409 & 0.367198 \tabularnewline
22 & 0.018903 & 0.1452 & 0.442524 \tabularnewline
23 & 0.226721 & 1.7415 & 0.043406 \tabularnewline
24 & 0.116995 & 0.8987 & 0.186245 \tabularnewline
25 & -0.085158 & -0.6541 & 0.25779 \tabularnewline
26 & -0.133555 & -1.0259 & 0.154574 \tabularnewline
27 & -0.121888 & -0.9362 & 0.176484 \tabularnewline
28 & -0.126426 & -0.9711 & 0.167732 \tabularnewline
29 & -0.106076 & -0.8148 & 0.209237 \tabularnewline
30 & 0.094678 & 0.7272 & 0.234979 \tabularnewline
31 & -0.030807 & -0.2366 & 0.406882 \tabularnewline
32 & -0.012485 & -0.0959 & 0.461962 \tabularnewline
33 & -0.07876 & -0.605 & 0.27376 \tabularnewline
34 & -0.040257 & -0.3092 & 0.379121 \tabularnewline
35 & 0.148452 & 1.1403 & 0.129389 \tabularnewline
36 & -0.136938 & -1.0518 & 0.148582 \tabularnewline
\hline
\end{tabular}
%Source: https://freestatistics.org/blog/index.php?pk=59230&T=2

[TABLE]
[ROW][C]Partial Autocorrelation Function[/C][/ROW]
[ROW][C]Time lag k[/C][C]PACF(k)[/C][C]T-STAT[/C][C]P-value[/C][/ROW]
[ROW][C]1[/C][C]-0.478999[/C][C]-3.6793[/C][C]0.000254[/C][/ROW]
[ROW][C]2[/C][C]-0.174356[/C][C]-1.3393[/C][C]0.092812[/C][/ROW]
[ROW][C]3[/C][C]0.00061[/C][C]0.0047[/C][C]0.498138[/C][/ROW]
[ROW][C]4[/C][C]-0.014235[/C][C]-0.1093[/C][C]0.456651[/C][/ROW]
[ROW][C]5[/C][C]0.014898[/C][C]0.1144[/C][C]0.45464[/C][/ROW]
[ROW][C]6[/C][C]-0.004134[/C][C]-0.0318[/C][C]0.487389[/C][/ROW]
[ROW][C]7[/C][C]-0.097486[/C][C]-0.7488[/C][C]0.228475[/C][/ROW]
[ROW][C]8[/C][C]-0.087704[/C][C]-0.6737[/C][C]0.251577[/C][/ROW]
[ROW][C]9[/C][C]0.142551[/C][C]1.095[/C][C]0.138992[/C][/ROW]
[ROW][C]10[/C][C]-0.091724[/C][C]-0.7045[/C][C]0.241932[/C][/ROW]
[ROW][C]11[/C][C]-0.045348[/C][C]-0.3483[/C][C]0.364417[/C][/ROW]
[ROW][C]12[/C][C]-0.341405[/C][C]-2.6224[/C][C]0.005546[/C][/ROW]
[ROW][C]13[/C][C]-0.151519[/C][C]-1.1638[/C][C]0.124587[/C][/ROW]
[ROW][C]14[/C][C]0.094971[/C][C]0.7295[/C][C]0.234296[/C][/ROW]
[ROW][C]15[/C][C]-0.017485[/C][C]-0.1343[/C][C]0.446809[/C][/ROW]
[ROW][C]16[/C][C]-0.013288[/C][C]-0.1021[/C][C]0.459524[/C][/ROW]
[ROW][C]17[/C][C]-0.146345[/C][C]-1.1241[/C][C]0.132763[/C][/ROW]
[ROW][C]18[/C][C]-0.004328[/C][C]-0.0332[/C][C]0.486797[/C][/ROW]
[ROW][C]19[/C][C]0.109585[/C][C]0.8417[/C][C]0.201667[/C][/ROW]
[ROW][C]20[/C][C]-0.161485[/C][C]-1.2404[/C][C]0.109871[/C][/ROW]
[ROW][C]21[/C][C]0.04438[/C][C]0.3409[/C][C]0.367198[/C][/ROW]
[ROW][C]22[/C][C]0.018903[/C][C]0.1452[/C][C]0.442524[/C][/ROW]
[ROW][C]23[/C][C]0.226721[/C][C]1.7415[/C][C]0.043406[/C][/ROW]
[ROW][C]24[/C][C]0.116995[/C][C]0.8987[/C][C]0.186245[/C][/ROW]
[ROW][C]25[/C][C]-0.085158[/C][C]-0.6541[/C][C]0.25779[/C][/ROW]
[ROW][C]26[/C][C]-0.133555[/C][C]-1.0259[/C][C]0.154574[/C][/ROW]
[ROW][C]27[/C][C]-0.121888[/C][C]-0.9362[/C][C]0.176484[/C][/ROW]
[ROW][C]28[/C][C]-0.126426[/C][C]-0.9711[/C][C]0.167732[/C][/ROW]
[ROW][C]29[/C][C]-0.106076[/C][C]-0.8148[/C][C]0.209237[/C][/ROW]
[ROW][C]30[/C][C]0.094678[/C][C]0.7272[/C][C]0.234979[/C][/ROW]
[ROW][C]31[/C][C]-0.030807[/C][C]-0.2366[/C][C]0.406882[/C][/ROW]
[ROW][C]32[/C][C]-0.012485[/C][C]-0.0959[/C][C]0.461962[/C][/ROW]
[ROW][C]33[/C][C]-0.07876[/C][C]-0.605[/C][C]0.27376[/C][/ROW]
[ROW][C]34[/C][C]-0.040257[/C][C]-0.3092[/C][C]0.379121[/C][/ROW]
[ROW][C]35[/C][C]0.148452[/C][C]1.1403[/C][C]0.129389[/C][/ROW]
[ROW][C]36[/C][C]-0.136938[/C][C]-1.0518[/C][C]0.148582[/C][/ROW]
[/TABLE]
Source: https://freestatistics.org/blog/index.php?pk=59230&T=2

Globally Unique Identifier (entire table): ba.freestatistics.org/blog/index.php?pk=59230&T=2

As an alternative you can also use a QR Code:  

The GUIDs for individual cells are displayed in the table below:

Partial Autocorrelation Function
Time lag kPACF(k)T-STATP-value
1-0.478999-3.67930.000254
2-0.174356-1.33930.092812
30.000610.00470.498138
4-0.014235-0.10930.456651
50.0148980.11440.45464
6-0.004134-0.03180.487389
7-0.097486-0.74880.228475
8-0.087704-0.67370.251577
90.1425511.0950.138992
10-0.091724-0.70450.241932
11-0.045348-0.34830.364417
12-0.341405-2.62240.005546
13-0.151519-1.16380.124587
140.0949710.72950.234296
15-0.017485-0.13430.446809
16-0.013288-0.10210.459524
17-0.146345-1.12410.132763
18-0.004328-0.03320.486797
190.1095850.84170.201667
20-0.161485-1.24040.109871
210.044380.34090.367198
220.0189030.14520.442524
230.2267211.74150.043406
240.1169950.89870.186245
25-0.085158-0.65410.25779
26-0.133555-1.02590.154574
27-0.121888-0.93620.176484
28-0.126426-0.97110.167732
29-0.106076-0.81480.209237
300.0946780.72720.234979
31-0.030807-0.23660.406882
32-0.012485-0.09590.461962
33-0.07876-0.6050.27376
34-0.040257-0.30920.379121
350.1484521.14030.129389
36-0.136938-1.05180.148582


Parameters (Session):
par1 = 36 ; par2 = 1 ; par3 = 1 ; par4 = 1 ; par5 = 12 ; par6 = MA ; par7 = 0.95 ;
Parameters (R input):
par1 = 36 ; par2 = 1 ; par3 = 1 ; par4 = 1 ; par5 = 12 ; par6 = MA ; par7 = 0.95 ;
R code (references can be found in the software module):
if (par1 == 'Default') {
par1 = 10*log10(length(x))
} else {
par1 <- as.numeric(par1)
}
par2 <- as.numeric(par2)
par3 <- as.numeric(par3)
par4 <- as.numeric(par4)
par5 <- as.numeric(par5)
if (par6 == 'White Noise') par6 <- 'white' else par6 <- 'ma'
par7 <- as.numeric(par7)
if (par2 == 0) {
x <- log(x)
} else {
x <- (x ^ par2 - 1) / par2
}
if (par3 > 0) x <- diff(x,lag=1,difference=par3)
if (par4 > 0) x <- diff(x,lag=par5,difference=par4)
bitmap(file='pic1.png')
racf <- acf(x, par1, main='Autocorrelation', xlab='time lag', ylab='ACF', ci.type=par6, ci=par7, sub=paste('(lambda=',par2,', d=',par3,', D=',par4,', CI=', par7, ', CI type=',par6,')',sep=''))
dev.off()
bitmap(file='pic2.png')
rpacf <- pacf(x,par1,main='Partial Autocorrelation',xlab='lags',ylab='PACF')
dev.off()
(myacf <- c(racf$acf))
(mypacf <- c(rpacf$acf))
lengthx <- length(x)
sqrtn <- sqrt(lengthx)
load(file='createtable')
a<-table.start()
a<-table.row.start(a)
a<-table.element(a,'Autocorrelation Function',4,TRUE)
a<-table.row.end(a)
a<-table.row.start(a)
a<-table.element(a,'Time lag k',header=TRUE)
a<-table.element(a,hyperlink('basics.htm','ACF(k)','click here for more information about the Autocorrelation Function'),header=TRUE)
a<-table.element(a,'T-STAT',header=TRUE)
a<-table.element(a,'P-value',header=TRUE)
a<-table.row.end(a)
for (i in 2:(par1+1)) {
a<-table.row.start(a)
a<-table.element(a,i-1,header=TRUE)
a<-table.element(a,round(myacf[i],6))
mytstat <- myacf[i]*sqrtn
a<-table.element(a,round(mytstat,4))
a<-table.element(a,round(1-pt(abs(mytstat),lengthx),6))
a<-table.row.end(a)
}
a<-table.end(a)
table.save(a,file='mytable.tab')
a<-table.start()
a<-table.row.start(a)
a<-table.element(a,'Partial Autocorrelation Function',4,TRUE)
a<-table.row.end(a)
a<-table.row.start(a)
a<-table.element(a,'Time lag k',header=TRUE)
a<-table.element(a,hyperlink('basics.htm','PACF(k)','click here for more information about the Partial Autocorrelation Function'),header=TRUE)
a<-table.element(a,'T-STAT',header=TRUE)
a<-table.element(a,'P-value',header=TRUE)
a<-table.row.end(a)
for (i in 1:par1) {
a<-table.row.start(a)
a<-table.element(a,i,header=TRUE)
a<-table.element(a,round(mypacf[i],6))
mytstat <- mypacf[i]*sqrtn
a<-table.element(a,round(mytstat,4))
a<-table.element(a,round(1-pt(abs(mytstat),lengthx),6))
a<-table.row.end(a)
}
a<-table.end(a)
table.save(a,file='mytable1.tab')