Free Statistics

of Irreproducible Research!

Author's title

Author*The author of this computation has been verified*
R Software Modulerwasp_autocorrelation.wasp
Title produced by software(Partial) Autocorrelation Function
Date of computationTue, 24 Nov 2009 11:56:53 -0700
Cite this page as followsStatistical Computations at FreeStatistics.org, Office for Research Development and Education, URL https://freestatistics.org/blog/index.php?v=date/2009/Nov/24/t12590892206d3r8rwwjfk7os3.htm/, Retrieved Thu, 25 Apr 2024 16:18:33 +0000
Statistical Computations at FreeStatistics.org, Office for Research Development and Education, URL https://freestatistics.org/blog/index.php?pk=59228, Retrieved Thu, 25 Apr 2024 16:18:33 +0000
QR Codes:

Original text written by user:
IsPrivate?No (this computation is public)
User-defined keywordsws8
Estimated Impact124
Family? (F = Feedback message, R = changed R code, M = changed R Module, P = changed Parameters, D = changed Data)
-       [(Partial) Autocorrelation Function] [] [2009-11-24 18:56:53] [4563e36d4b7005634fe3557528d9fcab] [Current]
Feedback Forum

Post a new message
Dataseries X:
7291
6820
8031
7862
7357
7213
7079
7012
7319
8148
7599
6908
7878
7407
7911
7323
7179
6758
6934
6696
7688
8296
7697
7907
7592
7710
9011
8225
7733
8062
7859
8221
8330
8868
9053
8811
8120
7953
8878
8601
8361
9116
9310
9891
10147
10317
10682
10276
10614
9413
11068
9772
10350
10541
10049
10714
10759
11684
11462
10485
11056
10184
11082
10554
11315
10847
11104
11026
11073
12073
12328
11172


Summary of computational transaction
Raw Inputview raw input (R code)
Raw Outputview raw output of R engine
Computing time2 seconds
R Server'Gwilym Jenkins' @ 72.249.127.135

\begin{tabular}{lllllllll}
\hline
Summary of computational transaction \tabularnewline
Raw Input & view raw input (R code)  \tabularnewline
Raw Output & view raw output of R engine  \tabularnewline
Computing time & 2 seconds \tabularnewline
R Server & 'Gwilym Jenkins' @ 72.249.127.135 \tabularnewline
\hline
\end{tabular}
%Source: https://freestatistics.org/blog/index.php?pk=59228&T=0

[TABLE]
[ROW][C]Summary of computational transaction[/C][/ROW]
[ROW][C]Raw Input[/C][C]view raw input (R code) [/C][/ROW]
[ROW][C]Raw Output[/C][C]view raw output of R engine [/C][/ROW]
[ROW][C]Computing time[/C][C]2 seconds[/C][/ROW]
[ROW][C]R Server[/C][C]'Gwilym Jenkins' @ 72.249.127.135[/C][/ROW]
[/TABLE]
Source: https://freestatistics.org/blog/index.php?pk=59228&T=0

Globally Unique Identifier (entire table): ba.freestatistics.org/blog/index.php?pk=59228&T=0

As an alternative you can also use a QR Code:  

The GUIDs for individual cells are displayed in the table below:

Summary of computational transaction
Raw Inputview raw input (R code)
Raw Outputview raw output of R engine
Computing time2 seconds
R Server'Gwilym Jenkins' @ 72.249.127.135


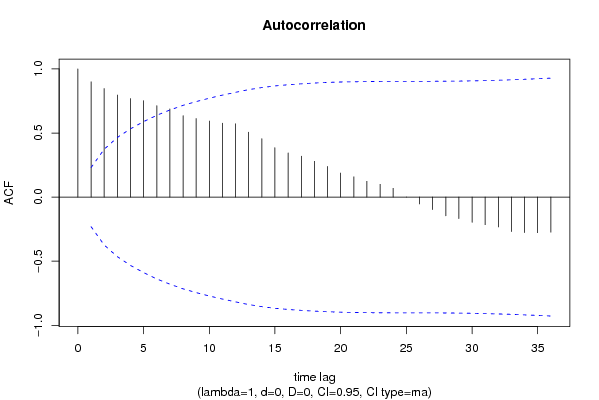
Autocorrelation Function
Time lag kACF(k)T-STATP-value
10.9001417.63790
20.8473247.18980
30.7967166.76040
40.769326.52790
50.752396.38420
60.7133366.05290
70.6880925.83870
80.6356085.39330
90.6125435.19761e-06
100.5937775.03842e-06
110.5765484.89223e-06
120.5715894.85013e-06
130.5067614.32.6e-05
140.4562263.87120.000118
150.3852613.26910.000828
160.3448072.92580.002297
170.3194832.71090.004192
180.2791272.36850.010274
190.239692.03380.022827
200.1876061.59190.057896
210.1585041.3450.091431
220.1236511.04920.148794
230.0998110.84690.199923
240.0688190.58390.28054
250.0006390.00540.497846
26-0.053754-0.45610.324839
27-0.096902-0.82220.206828
28-0.146288-1.24130.109262
29-0.167944-1.42510.079231
30-0.196895-1.67070.04956
31-0.215325-1.82710.035915
32-0.233023-1.97730.02592
33-0.269322-2.28530.012622
34-0.27651-2.34630.010859
35-0.277633-2.35580.010605
36-0.273534-2.3210.011561

\begin{tabular}{lllllllll}
\hline
Autocorrelation Function \tabularnewline
Time lag k & ACF(k) & T-STAT & P-value \tabularnewline
1 & 0.900141 & 7.6379 & 0 \tabularnewline
2 & 0.847324 & 7.1898 & 0 \tabularnewline
3 & 0.796716 & 6.7604 & 0 \tabularnewline
4 & 0.76932 & 6.5279 & 0 \tabularnewline
5 & 0.75239 & 6.3842 & 0 \tabularnewline
6 & 0.713336 & 6.0529 & 0 \tabularnewline
7 & 0.688092 & 5.8387 & 0 \tabularnewline
8 & 0.635608 & 5.3933 & 0 \tabularnewline
9 & 0.612543 & 5.1976 & 1e-06 \tabularnewline
10 & 0.593777 & 5.0384 & 2e-06 \tabularnewline
11 & 0.576548 & 4.8922 & 3e-06 \tabularnewline
12 & 0.571589 & 4.8501 & 3e-06 \tabularnewline
13 & 0.506761 & 4.3 & 2.6e-05 \tabularnewline
14 & 0.456226 & 3.8712 & 0.000118 \tabularnewline
15 & 0.385261 & 3.2691 & 0.000828 \tabularnewline
16 & 0.344807 & 2.9258 & 0.002297 \tabularnewline
17 & 0.319483 & 2.7109 & 0.004192 \tabularnewline
18 & 0.279127 & 2.3685 & 0.010274 \tabularnewline
19 & 0.23969 & 2.0338 & 0.022827 \tabularnewline
20 & 0.187606 & 1.5919 & 0.057896 \tabularnewline
21 & 0.158504 & 1.345 & 0.091431 \tabularnewline
22 & 0.123651 & 1.0492 & 0.148794 \tabularnewline
23 & 0.099811 & 0.8469 & 0.199923 \tabularnewline
24 & 0.068819 & 0.5839 & 0.28054 \tabularnewline
25 & 0.000639 & 0.0054 & 0.497846 \tabularnewline
26 & -0.053754 & -0.4561 & 0.324839 \tabularnewline
27 & -0.096902 & -0.8222 & 0.206828 \tabularnewline
28 & -0.146288 & -1.2413 & 0.109262 \tabularnewline
29 & -0.167944 & -1.4251 & 0.079231 \tabularnewline
30 & -0.196895 & -1.6707 & 0.04956 \tabularnewline
31 & -0.215325 & -1.8271 & 0.035915 \tabularnewline
32 & -0.233023 & -1.9773 & 0.02592 \tabularnewline
33 & -0.269322 & -2.2853 & 0.012622 \tabularnewline
34 & -0.27651 & -2.3463 & 0.010859 \tabularnewline
35 & -0.277633 & -2.3558 & 0.010605 \tabularnewline
36 & -0.273534 & -2.321 & 0.011561 \tabularnewline
\hline
\end{tabular}
%Source: https://freestatistics.org/blog/index.php?pk=59228&T=1

[TABLE]
[ROW][C]Autocorrelation Function[/C][/ROW]
[ROW][C]Time lag k[/C][C]ACF(k)[/C][C]T-STAT[/C][C]P-value[/C][/ROW]
[ROW][C]1[/C][C]0.900141[/C][C]7.6379[/C][C]0[/C][/ROW]
[ROW][C]2[/C][C]0.847324[/C][C]7.1898[/C][C]0[/C][/ROW]
[ROW][C]3[/C][C]0.796716[/C][C]6.7604[/C][C]0[/C][/ROW]
[ROW][C]4[/C][C]0.76932[/C][C]6.5279[/C][C]0[/C][/ROW]
[ROW][C]5[/C][C]0.75239[/C][C]6.3842[/C][C]0[/C][/ROW]
[ROW][C]6[/C][C]0.713336[/C][C]6.0529[/C][C]0[/C][/ROW]
[ROW][C]7[/C][C]0.688092[/C][C]5.8387[/C][C]0[/C][/ROW]
[ROW][C]8[/C][C]0.635608[/C][C]5.3933[/C][C]0[/C][/ROW]
[ROW][C]9[/C][C]0.612543[/C][C]5.1976[/C][C]1e-06[/C][/ROW]
[ROW][C]10[/C][C]0.593777[/C][C]5.0384[/C][C]2e-06[/C][/ROW]
[ROW][C]11[/C][C]0.576548[/C][C]4.8922[/C][C]3e-06[/C][/ROW]
[ROW][C]12[/C][C]0.571589[/C][C]4.8501[/C][C]3e-06[/C][/ROW]
[ROW][C]13[/C][C]0.506761[/C][C]4.3[/C][C]2.6e-05[/C][/ROW]
[ROW][C]14[/C][C]0.456226[/C][C]3.8712[/C][C]0.000118[/C][/ROW]
[ROW][C]15[/C][C]0.385261[/C][C]3.2691[/C][C]0.000828[/C][/ROW]
[ROW][C]16[/C][C]0.344807[/C][C]2.9258[/C][C]0.002297[/C][/ROW]
[ROW][C]17[/C][C]0.319483[/C][C]2.7109[/C][C]0.004192[/C][/ROW]
[ROW][C]18[/C][C]0.279127[/C][C]2.3685[/C][C]0.010274[/C][/ROW]
[ROW][C]19[/C][C]0.23969[/C][C]2.0338[/C][C]0.022827[/C][/ROW]
[ROW][C]20[/C][C]0.187606[/C][C]1.5919[/C][C]0.057896[/C][/ROW]
[ROW][C]21[/C][C]0.158504[/C][C]1.345[/C][C]0.091431[/C][/ROW]
[ROW][C]22[/C][C]0.123651[/C][C]1.0492[/C][C]0.148794[/C][/ROW]
[ROW][C]23[/C][C]0.099811[/C][C]0.8469[/C][C]0.199923[/C][/ROW]
[ROW][C]24[/C][C]0.068819[/C][C]0.5839[/C][C]0.28054[/C][/ROW]
[ROW][C]25[/C][C]0.000639[/C][C]0.0054[/C][C]0.497846[/C][/ROW]
[ROW][C]26[/C][C]-0.053754[/C][C]-0.4561[/C][C]0.324839[/C][/ROW]
[ROW][C]27[/C][C]-0.096902[/C][C]-0.8222[/C][C]0.206828[/C][/ROW]
[ROW][C]28[/C][C]-0.146288[/C][C]-1.2413[/C][C]0.109262[/C][/ROW]
[ROW][C]29[/C][C]-0.167944[/C][C]-1.4251[/C][C]0.079231[/C][/ROW]
[ROW][C]30[/C][C]-0.196895[/C][C]-1.6707[/C][C]0.04956[/C][/ROW]
[ROW][C]31[/C][C]-0.215325[/C][C]-1.8271[/C][C]0.035915[/C][/ROW]
[ROW][C]32[/C][C]-0.233023[/C][C]-1.9773[/C][C]0.02592[/C][/ROW]
[ROW][C]33[/C][C]-0.269322[/C][C]-2.2853[/C][C]0.012622[/C][/ROW]
[ROW][C]34[/C][C]-0.27651[/C][C]-2.3463[/C][C]0.010859[/C][/ROW]
[ROW][C]35[/C][C]-0.277633[/C][C]-2.3558[/C][C]0.010605[/C][/ROW]
[ROW][C]36[/C][C]-0.273534[/C][C]-2.321[/C][C]0.011561[/C][/ROW]
[/TABLE]
Source: https://freestatistics.org/blog/index.php?pk=59228&T=1

Globally Unique Identifier (entire table): ba.freestatistics.org/blog/index.php?pk=59228&T=1

As an alternative you can also use a QR Code:  

The GUIDs for individual cells are displayed in the table below:

Autocorrelation Function
Time lag kACF(k)T-STATP-value
10.9001417.63790
20.8473247.18980
30.7967166.76040
40.769326.52790
50.752396.38420
60.7133366.05290
70.6880925.83870
80.6356085.39330
90.6125435.19761e-06
100.5937775.03842e-06
110.5765484.89223e-06
120.5715894.85013e-06
130.5067614.32.6e-05
140.4562263.87120.000118
150.3852613.26910.000828
160.3448072.92580.002297
170.3194832.71090.004192
180.2791272.36850.010274
190.239692.03380.022827
200.1876061.59190.057896
210.1585041.3450.091431
220.1236511.04920.148794
230.0998110.84690.199923
240.0688190.58390.28054
250.0006390.00540.497846
26-0.053754-0.45610.324839
27-0.096902-0.82220.206828
28-0.146288-1.24130.109262
29-0.167944-1.42510.079231
30-0.196895-1.67070.04956
31-0.215325-1.82710.035915
32-0.233023-1.97730.02592
33-0.269322-2.28530.012622
34-0.27651-2.34630.010859
35-0.277633-2.35580.010605
36-0.273534-2.3210.011561


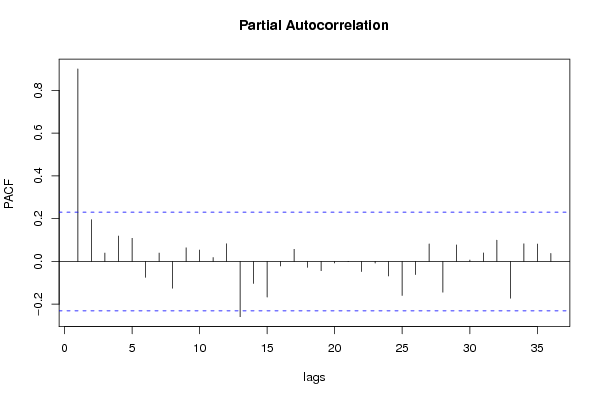
Partial Autocorrelation Function
Time lag kPACF(k)T-STATP-value
10.9001417.63790
20.1953691.65780.050858
30.0392050.33270.370176
40.1185651.00610.158879
50.1082370.91840.180732
6-0.074177-0.62940.265535
70.0391030.33180.370502
8-0.125115-1.06160.145974
90.0638160.54150.294917
100.0531510.4510.326673
110.0178520.15150.44001
120.0821850.69740.243911
13-0.258441-2.19290.015771
14-0.103363-0.87710.191685
15-0.166831-1.41560.080601
16-0.021074-0.17880.42929
170.0564690.47920.31664
18-0.0277-0.2350.407423
19-0.043651-0.37040.356089
20-0.007364-0.06250.475173
21-0.001432-0.01220.495168
22-0.047398-0.40220.344371
23-0.007695-0.06530.474059
24-0.068186-0.57860.282339
25-0.15894-1.34860.090838
26-0.061537-0.52220.30158
270.0814470.69110.245861
28-0.143952-1.22150.112945
290.0769480.65290.257943
300.0060390.05120.479638
310.0397340.33720.368491
320.0990090.84010.201811
33-0.171985-1.45930.07441
340.0823490.69880.243478
350.0808780.68630.247373
360.0372860.31640.376314

\begin{tabular}{lllllllll}
\hline
Partial Autocorrelation Function \tabularnewline
Time lag k & PACF(k) & T-STAT & P-value \tabularnewline
1 & 0.900141 & 7.6379 & 0 \tabularnewline
2 & 0.195369 & 1.6578 & 0.050858 \tabularnewline
3 & 0.039205 & 0.3327 & 0.370176 \tabularnewline
4 & 0.118565 & 1.0061 & 0.158879 \tabularnewline
5 & 0.108237 & 0.9184 & 0.180732 \tabularnewline
6 & -0.074177 & -0.6294 & 0.265535 \tabularnewline
7 & 0.039103 & 0.3318 & 0.370502 \tabularnewline
8 & -0.125115 & -1.0616 & 0.145974 \tabularnewline
9 & 0.063816 & 0.5415 & 0.294917 \tabularnewline
10 & 0.053151 & 0.451 & 0.326673 \tabularnewline
11 & 0.017852 & 0.1515 & 0.44001 \tabularnewline
12 & 0.082185 & 0.6974 & 0.243911 \tabularnewline
13 & -0.258441 & -2.1929 & 0.015771 \tabularnewline
14 & -0.103363 & -0.8771 & 0.191685 \tabularnewline
15 & -0.166831 & -1.4156 & 0.080601 \tabularnewline
16 & -0.021074 & -0.1788 & 0.42929 \tabularnewline
17 & 0.056469 & 0.4792 & 0.31664 \tabularnewline
18 & -0.0277 & -0.235 & 0.407423 \tabularnewline
19 & -0.043651 & -0.3704 & 0.356089 \tabularnewline
20 & -0.007364 & -0.0625 & 0.475173 \tabularnewline
21 & -0.001432 & -0.0122 & 0.495168 \tabularnewline
22 & -0.047398 & -0.4022 & 0.344371 \tabularnewline
23 & -0.007695 & -0.0653 & 0.474059 \tabularnewline
24 & -0.068186 & -0.5786 & 0.282339 \tabularnewline
25 & -0.15894 & -1.3486 & 0.090838 \tabularnewline
26 & -0.061537 & -0.5222 & 0.30158 \tabularnewline
27 & 0.081447 & 0.6911 & 0.245861 \tabularnewline
28 & -0.143952 & -1.2215 & 0.112945 \tabularnewline
29 & 0.076948 & 0.6529 & 0.257943 \tabularnewline
30 & 0.006039 & 0.0512 & 0.479638 \tabularnewline
31 & 0.039734 & 0.3372 & 0.368491 \tabularnewline
32 & 0.099009 & 0.8401 & 0.201811 \tabularnewline
33 & -0.171985 & -1.4593 & 0.07441 \tabularnewline
34 & 0.082349 & 0.6988 & 0.243478 \tabularnewline
35 & 0.080878 & 0.6863 & 0.247373 \tabularnewline
36 & 0.037286 & 0.3164 & 0.376314 \tabularnewline
\hline
\end{tabular}
%Source: https://freestatistics.org/blog/index.php?pk=59228&T=2

[TABLE]
[ROW][C]Partial Autocorrelation Function[/C][/ROW]
[ROW][C]Time lag k[/C][C]PACF(k)[/C][C]T-STAT[/C][C]P-value[/C][/ROW]
[ROW][C]1[/C][C]0.900141[/C][C]7.6379[/C][C]0[/C][/ROW]
[ROW][C]2[/C][C]0.195369[/C][C]1.6578[/C][C]0.050858[/C][/ROW]
[ROW][C]3[/C][C]0.039205[/C][C]0.3327[/C][C]0.370176[/C][/ROW]
[ROW][C]4[/C][C]0.118565[/C][C]1.0061[/C][C]0.158879[/C][/ROW]
[ROW][C]5[/C][C]0.108237[/C][C]0.9184[/C][C]0.180732[/C][/ROW]
[ROW][C]6[/C][C]-0.074177[/C][C]-0.6294[/C][C]0.265535[/C][/ROW]
[ROW][C]7[/C][C]0.039103[/C][C]0.3318[/C][C]0.370502[/C][/ROW]
[ROW][C]8[/C][C]-0.125115[/C][C]-1.0616[/C][C]0.145974[/C][/ROW]
[ROW][C]9[/C][C]0.063816[/C][C]0.5415[/C][C]0.294917[/C][/ROW]
[ROW][C]10[/C][C]0.053151[/C][C]0.451[/C][C]0.326673[/C][/ROW]
[ROW][C]11[/C][C]0.017852[/C][C]0.1515[/C][C]0.44001[/C][/ROW]
[ROW][C]12[/C][C]0.082185[/C][C]0.6974[/C][C]0.243911[/C][/ROW]
[ROW][C]13[/C][C]-0.258441[/C][C]-2.1929[/C][C]0.015771[/C][/ROW]
[ROW][C]14[/C][C]-0.103363[/C][C]-0.8771[/C][C]0.191685[/C][/ROW]
[ROW][C]15[/C][C]-0.166831[/C][C]-1.4156[/C][C]0.080601[/C][/ROW]
[ROW][C]16[/C][C]-0.021074[/C][C]-0.1788[/C][C]0.42929[/C][/ROW]
[ROW][C]17[/C][C]0.056469[/C][C]0.4792[/C][C]0.31664[/C][/ROW]
[ROW][C]18[/C][C]-0.0277[/C][C]-0.235[/C][C]0.407423[/C][/ROW]
[ROW][C]19[/C][C]-0.043651[/C][C]-0.3704[/C][C]0.356089[/C][/ROW]
[ROW][C]20[/C][C]-0.007364[/C][C]-0.0625[/C][C]0.475173[/C][/ROW]
[ROW][C]21[/C][C]-0.001432[/C][C]-0.0122[/C][C]0.495168[/C][/ROW]
[ROW][C]22[/C][C]-0.047398[/C][C]-0.4022[/C][C]0.344371[/C][/ROW]
[ROW][C]23[/C][C]-0.007695[/C][C]-0.0653[/C][C]0.474059[/C][/ROW]
[ROW][C]24[/C][C]-0.068186[/C][C]-0.5786[/C][C]0.282339[/C][/ROW]
[ROW][C]25[/C][C]-0.15894[/C][C]-1.3486[/C][C]0.090838[/C][/ROW]
[ROW][C]26[/C][C]-0.061537[/C][C]-0.5222[/C][C]0.30158[/C][/ROW]
[ROW][C]27[/C][C]0.081447[/C][C]0.6911[/C][C]0.245861[/C][/ROW]
[ROW][C]28[/C][C]-0.143952[/C][C]-1.2215[/C][C]0.112945[/C][/ROW]
[ROW][C]29[/C][C]0.076948[/C][C]0.6529[/C][C]0.257943[/C][/ROW]
[ROW][C]30[/C][C]0.006039[/C][C]0.0512[/C][C]0.479638[/C][/ROW]
[ROW][C]31[/C][C]0.039734[/C][C]0.3372[/C][C]0.368491[/C][/ROW]
[ROW][C]32[/C][C]0.099009[/C][C]0.8401[/C][C]0.201811[/C][/ROW]
[ROW][C]33[/C][C]-0.171985[/C][C]-1.4593[/C][C]0.07441[/C][/ROW]
[ROW][C]34[/C][C]0.082349[/C][C]0.6988[/C][C]0.243478[/C][/ROW]
[ROW][C]35[/C][C]0.080878[/C][C]0.6863[/C][C]0.247373[/C][/ROW]
[ROW][C]36[/C][C]0.037286[/C][C]0.3164[/C][C]0.376314[/C][/ROW]
[/TABLE]
Source: https://freestatistics.org/blog/index.php?pk=59228&T=2

Globally Unique Identifier (entire table): ba.freestatistics.org/blog/index.php?pk=59228&T=2

As an alternative you can also use a QR Code:  

The GUIDs for individual cells are displayed in the table below:

Partial Autocorrelation Function
Time lag kPACF(k)T-STATP-value
10.9001417.63790
20.1953691.65780.050858
30.0392050.33270.370176
40.1185651.00610.158879
50.1082370.91840.180732
6-0.074177-0.62940.265535
70.0391030.33180.370502
8-0.125115-1.06160.145974
90.0638160.54150.294917
100.0531510.4510.326673
110.0178520.15150.44001
120.0821850.69740.243911
13-0.258441-2.19290.015771
14-0.103363-0.87710.191685
15-0.166831-1.41560.080601
16-0.021074-0.17880.42929
170.0564690.47920.31664
18-0.0277-0.2350.407423
19-0.043651-0.37040.356089
20-0.007364-0.06250.475173
21-0.001432-0.01220.495168
22-0.047398-0.40220.344371
23-0.007695-0.06530.474059
24-0.068186-0.57860.282339
25-0.15894-1.34860.090838
26-0.061537-0.52220.30158
270.0814470.69110.245861
28-0.143952-1.22150.112945
290.0769480.65290.257943
300.0060390.05120.479638
310.0397340.33720.368491
320.0990090.84010.201811
33-0.171985-1.45930.07441
340.0823490.69880.243478
350.0808780.68630.247373
360.0372860.31640.376314


Parameters (Session):
par1 = 36 ; par2 = 1 ; par3 = 0 ; par4 = 0 ; par5 = 12 ; par6 = MA ; par7 = 0.95 ;
Parameters (R input):
par1 = 36 ; par2 = 1 ; par3 = 0 ; par4 = 0 ; par5 = 12 ; par6 = MA ; par7 = 0.95 ;
R code (references can be found in the software module):
if (par1 == 'Default') {
par1 = 10*log10(length(x))
} else {
par1 <- as.numeric(par1)
}
par2 <- as.numeric(par2)
par3 <- as.numeric(par3)
par4 <- as.numeric(par4)
par5 <- as.numeric(par5)
if (par6 == 'White Noise') par6 <- 'white' else par6 <- 'ma'
par7 <- as.numeric(par7)
if (par2 == 0) {
x <- log(x)
} else {
x <- (x ^ par2 - 1) / par2
}
if (par3 > 0) x <- diff(x,lag=1,difference=par3)
if (par4 > 0) x <- diff(x,lag=par5,difference=par4)
bitmap(file='pic1.png')
racf <- acf(x, par1, main='Autocorrelation', xlab='time lag', ylab='ACF', ci.type=par6, ci=par7, sub=paste('(lambda=',par2,', d=',par3,', D=',par4,', CI=', par7, ', CI type=',par6,')',sep=''))
dev.off()
bitmap(file='pic2.png')
rpacf <- pacf(x,par1,main='Partial Autocorrelation',xlab='lags',ylab='PACF')
dev.off()
(myacf <- c(racf$acf))
(mypacf <- c(rpacf$acf))
lengthx <- length(x)
sqrtn <- sqrt(lengthx)
load(file='createtable')
a<-table.start()
a<-table.row.start(a)
a<-table.element(a,'Autocorrelation Function',4,TRUE)
a<-table.row.end(a)
a<-table.row.start(a)
a<-table.element(a,'Time lag k',header=TRUE)
a<-table.element(a,hyperlink('basics.htm','ACF(k)','click here for more information about the Autocorrelation Function'),header=TRUE)
a<-table.element(a,'T-STAT',header=TRUE)
a<-table.element(a,'P-value',header=TRUE)
a<-table.row.end(a)
for (i in 2:(par1+1)) {
a<-table.row.start(a)
a<-table.element(a,i-1,header=TRUE)
a<-table.element(a,round(myacf[i],6))
mytstat <- myacf[i]*sqrtn
a<-table.element(a,round(mytstat,4))
a<-table.element(a,round(1-pt(abs(mytstat),lengthx),6))
a<-table.row.end(a)
}
a<-table.end(a)
table.save(a,file='mytable.tab')
a<-table.start()
a<-table.row.start(a)
a<-table.element(a,'Partial Autocorrelation Function',4,TRUE)
a<-table.row.end(a)
a<-table.row.start(a)
a<-table.element(a,'Time lag k',header=TRUE)
a<-table.element(a,hyperlink('basics.htm','PACF(k)','click here for more information about the Partial Autocorrelation Function'),header=TRUE)
a<-table.element(a,'T-STAT',header=TRUE)
a<-table.element(a,'P-value',header=TRUE)
a<-table.row.end(a)
for (i in 1:par1) {
a<-table.row.start(a)
a<-table.element(a,i,header=TRUE)
a<-table.element(a,round(mypacf[i],6))
mytstat <- mypacf[i]*sqrtn
a<-table.element(a,round(mytstat,4))
a<-table.element(a,round(1-pt(abs(mytstat),lengthx),6))
a<-table.row.end(a)
}
a<-table.end(a)
table.save(a,file='mytable1.tab')