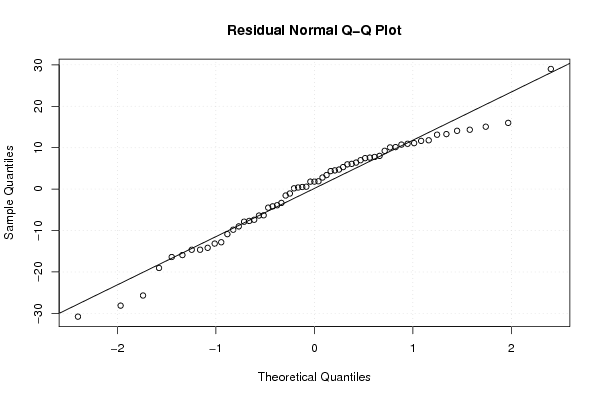
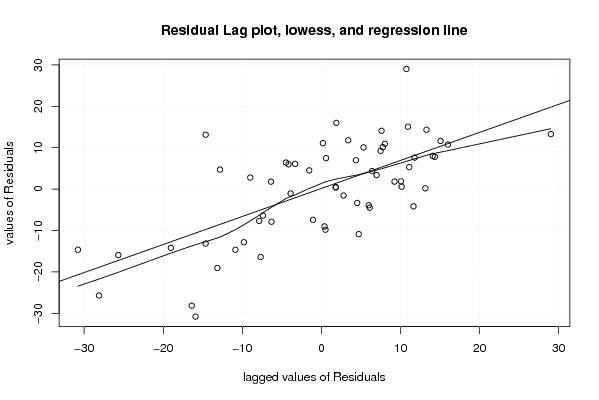
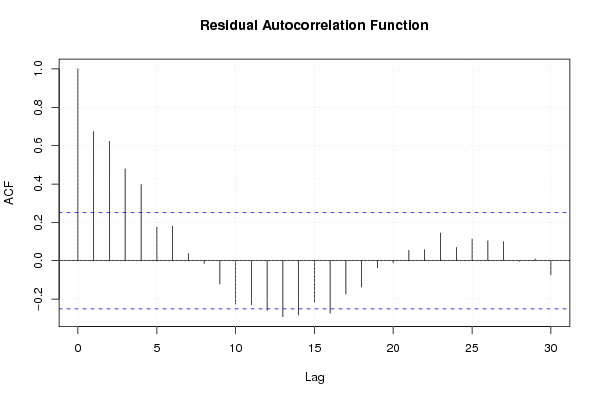
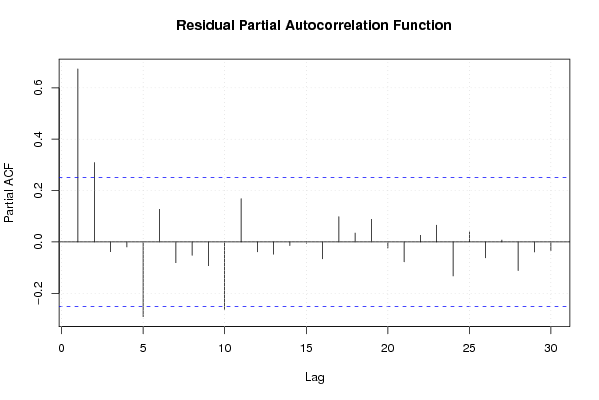
| Multiple Linear Regression - Estimated Regression Equation |
| InvoerEU[t] = + 82.683850593337 + 0.467262809361258InvoerAM[t] -18.0508952623992M1[t] -17.0173631257305M2[t] + 0.0395977543686826M3[t] -2.95888240981108M4[t] -6.85649107502474M5[t] -7.99701999658972M6[t] -7.7807311043623M7[t] + 0.569266808576778M8[t] + 6.64215551133062M9[t] -4.11520638896474M10[t] -10.0454795242434M11[t] -0.158814190838987t + e[t] |
| Multiple Linear Regression - Ordinary Least Squares | |||||
| Variable | Parameter | S.D. | T-STAT H0: parameter = 0 | 2-tail p-value | 1-tail p-value |
| (Intercept) | 82.683850593337 | 14.786529 | 5.5918 | 1e-06 | 1e-06 |
| InvoerAM | 0.467262809361258 | 0.098679 | 4.7352 | 2e-05 | 1e-05 |
| M1 | -18.0508952623992 | 8.131757 | -2.2198 | 0.031293 | 0.015647 |
| M2 | -17.0173631257305 | 8.589618 | -1.9812 | 0.053442 | 0.026721 |
| M3 | 0.0395977543686826 | 8.507552 | 0.0047 | 0.996306 | 0.498153 |
| M4 | -2.95888240981108 | 8.494898 | -0.3483 | 0.729161 | 0.36458 |
| M5 | -6.85649107502474 | 8.482331 | -0.8083 | 0.422975 | 0.211488 |
| M6 | -7.99701999658972 | 8.502859 | -0.9405 | 0.351765 | 0.175883 |
| M7 | -7.7807311043623 | 8.572446 | -0.9076 | 0.368697 | 0.184348 |
| M8 | 0.569266808576778 | 8.879305 | 0.0641 | 0.949153 | 0.474577 |
| M9 | 6.64215551133062 | 8.474143 | 0.7838 | 0.437081 | 0.218541 |
| M10 | -4.11520638896474 | 8.605814 | -0.4782 | 0.634732 | 0.317366 |
| M11 | -10.0454795242434 | 8.476515 | -1.1851 | 0.241937 | 0.120969 |
| t | -0.158814190838987 | 0.163431 | -0.9718 | 0.336149 | 0.168075 |
| Multiple Linear Regression - Regression Statistics | |
| Multiple R | 0.770106253769868 |
| R-squared | 0.59306364209546 |
| Adjusted R-squared | 0.480506777143141 |
| F-TEST (value) | 5.26901351016386 |
| F-TEST (DF numerator) | 13 |
| F-TEST (DF denominator) | 47 |
| p-value | 1.07834850648914e-05 |
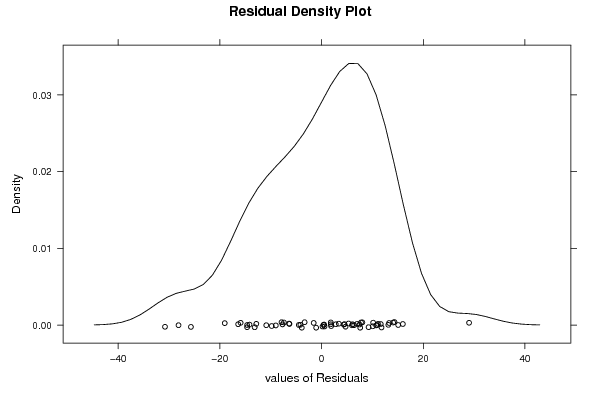
| Multiple Linear Regression - Residual Statistics | |
| Residual Standard Deviation | 13.3604016177259 |
| Sum Squared Residuals | 8389.5155751859 |
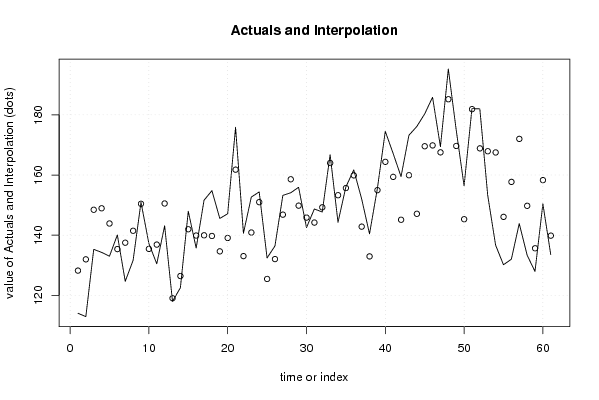
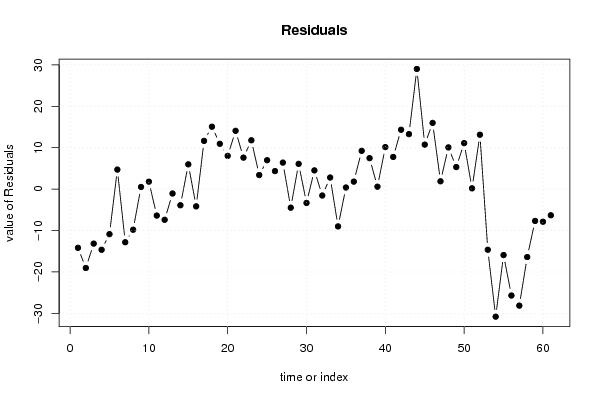
| Multiple Linear Regression - Actuals, Interpolation, and Residuals | |||
| Time or Index | Actuals | Interpolation Forecast | Residuals Prediction Error |
| 1 | 114.08 | 128.250841989817 | -14.1708419898174 |
| 2 | 112.95 | 131.989880957031 | -19.0398809570312 |
| 3 | 135.31 | 148.462818489773 | -13.1528184897726 |
| 4 | 134.31 | 148.950174047772 | -14.6401740477717 |
| 5 | 133.03 | 143.903154035873 | -10.8731540358732 |
| 6 | 140.11 | 135.393945775025 | 4.71605422497503 |
| 7 | 124.69 | 137.516722093790 | -12.8267220937902 |
| 8 | 131.68 | 141.483850019265 | -9.8038500192645 |
| 9 | 150.95 | 150.439805420121 | 0.51019457987886 |
| 10 | 137.26 | 135.453770259450 | 1.80622974054976 |
| 11 | 130.51 | 136.892286792142 | -6.38228679214242 |
| 12 | 143.15 | 150.549762997092 | -7.3997629970922 |
| 13 | 118.01 | 119.069789757994 | -1.05978975799429 |
| 14 | 122.56 | 126.453478638226 | -3.89347863822638 |
| 15 | 147.97 | 141.987217924152 | 5.98278207584834 |
| 16 | 135.74 | 139.899955402570 | -4.15995540257019 |
| 17 | 151.62 | 139.978808409365 | 11.6411915906353 |
| 18 | 154.82 | 139.754169758492 | 15.0658302415084 |
| 19 | 145.59 | 134.648390416438 | 10.9416095835619 |
| 20 | 147.12 | 139.096799035555 | 8.02320096444544 |
| 21 | 175.86 | 161.785608403539 | 14.0743915964614 |
| 22 | 140.66 | 133.057374019553 | 7.60262598044692 |
| 23 | 152.69 | 140.902063668588 | 11.7879363314119 |
| 24 | 154.38 | 150.989652010018 | 3.39034798998211 |
| 25 | 132.45 | 125.471952218370 | 6.97804778163037 |
| 26 | 136.44 | 132.084657463156 | 4.35534253684437 |
| 27 | 153.24 | 146.838067857448 | 6.40193214255241 |
| 28 | 154.11 | 158.591129749147 | -4.48112974914660 |
| 29 | 155.93 | 149.829370402826 | 6.10062959717393 |
| 30 | 142.53 | 145.861956648969 | -3.33195664896934 |
| 31 | 148.73 | 144.209249468096 | 4.52075053190441 |
| 32 | 147.73 | 149.274444995569 | -1.54444499556885 |
| 33 | 166.79 | 163.991750835850 | 2.7982491641502 |
| 34 | 144.3 | 153.299860893209 | -8.99986089320883 |
| 35 | 156.07 | 155.682248300811 | 0.387751699189206 |
| 36 | 161.7 | 159.886997872382 | 1.81300212761766 |
| 37 | 152.1 | 142.854790698734 | 9.2452093012655 |
| 38 | 140.45 | 132.973118773068 | 7.47688122693188 |
| 39 | 155.56 | 154.978447968647 | 0.581552031353204 |
| 40 | 174.53 | 164.385850557352 | 10.1441494426477 |
| 41 | 167.16 | 159.394902082577 | 7.76509791742287 |
| 42 | 159.48 | 145.143033894679 | 14.3369661053209 |
| 43 | 173.22 | 159.937977603322 | 13.2820223966784 |
| 44 | 176.13 | 147.121025416540 | 29.0089745834604 |
| 45 | 180.31 | 169.566858123656 | 10.7431418763443 |
| 46 | 185.84 | 169.850971572911 | 15.9890284270893 |
| 47 | 169.43 | 167.542040374526 | 1.8879596254744 |
| 48 | 195.25 | 185.185268343327 | 10.0647316566731 |
| 49 | 174.99 | 169.666992672010 | 5.32300732799045 |
| 50 | 156.42 | 145.318864168519 | 11.1011358314814 |
| 51 | 182.08 | 181.893447759981 | 0.186552240018664 |
| 52 | 182 | 168.862890243159 | 13.1371097568408 |
| 53 | 153.28 | 167.913765069359 | -14.6337650693590 |
| 54 | 136.72 | 167.506893922835 | -30.7868939228350 |
| 55 | 130.19 | 146.107660418354 | -15.9176604183545 |
| 56 | 132.04 | 157.723880533073 | -25.6838805330726 |
| 57 | 143.89 | 172.015977216835 | -28.1259772168348 |
| 58 | 133.38 | 149.778023254877 | -16.3980232548771 |
| 59 | 127.98 | 135.661360863933 | -7.68136086393306 |
| 60 | 150.45 | 158.318318777181 | -7.86831877718068 |
| 61 | 133.55 | 139.865632663075 | -6.31563266307461 |
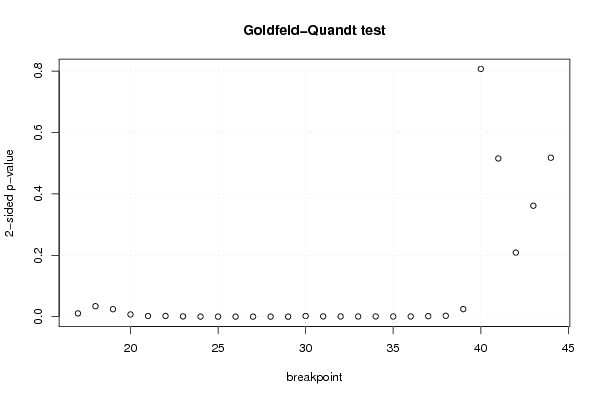
| Goldfeld-Quandt test for Heteroskedasticity | |||
| p-values | Alternative Hypothesis | ||
| breakpoint index | greater | 2-sided | less |
| 17 | 0.00529033439112727 | 0.0105806687822545 | 0.994709665608873 |
| 18 | 0.0170618036388247 | 0.0341236072776495 | 0.982938196361175 |
| 19 | 0.0121568556843005 | 0.0243137113686010 | 0.9878431443157 |
| 20 | 0.00359891049774835 | 0.0071978209954967 | 0.996401089502252 |
| 21 | 0.00104163843375873 | 0.00208327686751746 | 0.998958361566241 |
| 22 | 0.00118109164654624 | 0.00236218329309247 | 0.998818908353454 |
| 23 | 0.000393697706978438 | 0.000787395413956877 | 0.999606302293021 |
| 24 | 0.000144422465824639 | 0.000288844931649278 | 0.999855577534175 |
| 25 | 8.87137090871153e-05 | 0.000177427418174231 | 0.999911286290913 |
| 26 | 3.69589071457293e-05 | 7.39178142914585e-05 | 0.999963041092854 |
| 27 | 3.6496548818841e-05 | 7.2993097637682e-05 | 0.999963503451181 |
| 28 | 4.59821952321633e-05 | 9.19643904643266e-05 | 0.999954017804768 |
| 29 | 2.75024263123857e-05 | 5.50048526247715e-05 | 0.999972497573688 |
| 30 | 0.00103139031821666 | 0.00206278063643332 | 0.998968609681783 |
| 31 | 0.000450451447721435 | 0.00090090289544287 | 0.999549548552279 |
| 32 | 0.000355546243191837 | 0.000711092486383675 | 0.999644453756808 |
| 33 | 0.0002845640868886 | 0.0005691281737772 | 0.999715435913111 |
| 34 | 0.000410225652435575 | 0.00082045130487115 | 0.999589774347564 |
| 35 | 0.000291300058127802 | 0.000582600116255603 | 0.999708699941872 |
| 36 | 0.0003329290540057 | 0.0006658581080114 | 0.999667070945994 |
| 37 | 0.00079260885666607 | 0.00158521771333214 | 0.999207391143334 |
| 38 | 0.00140958056179293 | 0.00281916112358585 | 0.998590419438207 |
| 39 | 0.0123060565132756 | 0.0246121130265513 | 0.987693943486724 |
| 40 | 0.403438455834657 | 0.806876911669314 | 0.596561544165343 |
| 41 | 0.742314336499743 | 0.515371327000513 | 0.257685663500257 |
| 42 | 0.895650787760174 | 0.208698424479652 | 0.104349212239826 |
| 43 | 0.819344299312323 | 0.361311401375354 | 0.180655700687677 |
| 44 | 0.741171778259962 | 0.517656443480076 | 0.258828221740038 |
| Meta Analysis of Goldfeld-Quandt test for Heteroskedasticity | |||
| Description | # significant tests | % significant tests | OK/NOK |
| 1% type I error level | 19 | 0.678571428571429 | NOK |
| 5% type I error level | 23 | 0.821428571428571 | NOK |
| 10% type I error level | 23 | 0.821428571428571 | NOK |