| Multiple Linear Regression - Estimated Regression Equation |
| InvoerEU[t] = + 82.0823843016541 + 0.405853219646718InvoerAM[t] + e[t] |
| Multiple Linear Regression - Ordinary Least Squares | |||||
| Variable | Parameter | S.D. | T-STAT H0: parameter = 0 | 2-tail p-value | 1-tail p-value |
| (Intercept) | 82.0823843016541 | 10.050437 | 8.167 | 0 | 0 |
| InvoerAM | 0.405853219646718 | 0.059794 | 6.7875 | 0 | 0 |
| Multiple Linear Regression - Regression Statistics | |
| Multiple R | 0.662171795257425 |
| R-squared | 0.438471486434441 |
| Adjusted R-squared | 0.428954054001127 |
| F-TEST (value) | 46.0703545317146 |
| F-TEST (DF numerator) | 1 |
| F-TEST (DF denominator) | 59 |
| p-value | 6.18692874709836e-09 |
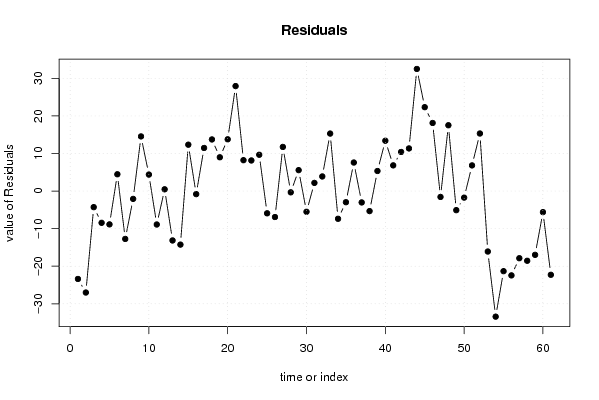
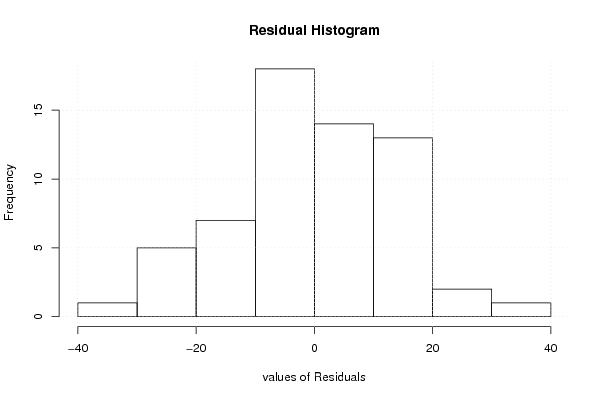
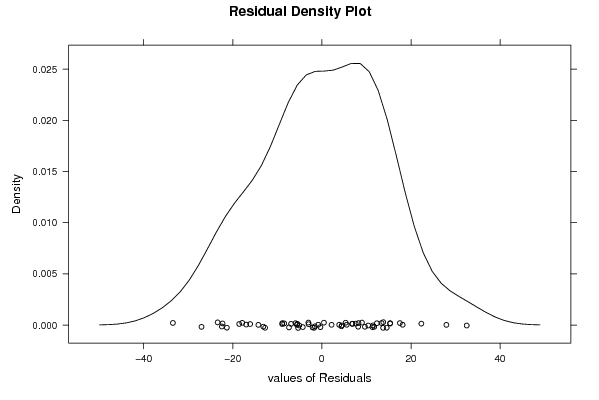
| Multiple Linear Regression - Residual Statistics | |
| Residual Standard Deviation | 14.0076440268092 |
| Sum Squared Residuals | 11576.6313797264 |
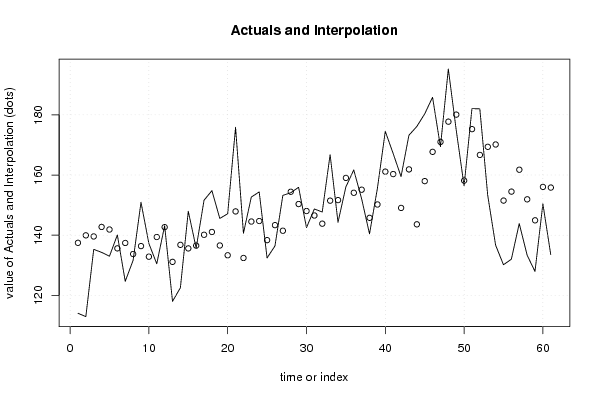
| Multiple Linear Regression - Actuals, Interpolation, and Residuals | |||
| Time or Index | Actuals | Interpolation Forecast | Residuals Prediction Error |
| 1 | 114.08 | 137.477290251235 | -23.3972902512352 |
| 2 | 112.95 | 139.965170487669 | -27.0151704876691 |
| 3 | 135.31 | 139.595844057791 | -4.2858440577906 |
| 4 | 134.31 | 142.761499171035 | -8.451499171035 |
| 5 | 133.03 | 141.901090345384 | -8.87109034538395 |
| 6 | 140.11 | 135.638775166235 | 4.47122483376492 |
| 7 | 124.69 | 137.432646397074 | -12.7426463970736 |
| 8 | 131.68 | 133.763733291467 | -2.08373329146725 |
| 9 | 150.95 | 136.405837751367 | 14.5441622486326 |
| 10 | 137.26 | 132.870856208244 | 4.38914379175551 |
| 11 | 130.51 | 139.409151576753 | -8.89915157675312 |
| 12 | 143.15 | 142.684387059302 | 0.465612940697883 |
| 13 | 118.01 | 131.158155621335 | -13.1481556213353 |
| 14 | 122.56 | 136.811690971014 | -14.2516909710141 |
| 15 | 147.97 | 135.626599569646 | 12.3434004303543 |
| 16 | 135.74 | 136.556003442637 | -0.816003442636669 |
| 17 | 151.62 | 140.14780443651 | 11.4721955634899 |
| 18 | 154.82 | 141.081266841698 | 13.7387331583024 |
| 19 | 145.59 | 136.596588764601 | 8.99341123539866 |
| 20 | 147.12 | 133.345704475231 | 13.7742955247689 |
| 21 | 175.86 | 147.915835060548 | 27.9441649394517 |
| 22 | 140.66 | 132.444710327615 | 8.21528967238457 |
| 23 | 152.69 | 144.547253337481 | 8.14274666251944 |
| 24 | 154.38 | 144.721770221929 | 9.65822977807134 |
| 25 | 132.45 | 138.374225866654 | -5.92422586665398 |
| 26 | 136.44 | 143.358103403916 | -6.91810340391568 |
| 27 | 153.24 | 141.495237125737 | 11.7447628742628 |
| 28 | 154.11 | 154.446013364664 | -0.336013364664014 |
| 29 | 155.93 | 150.359071442822 | 5.57092855717844 |
| 30 | 142.53 | 148.041649558639 | -5.51164955863881 |
| 31 | 148.73 | 146.556226774732 | 2.17377322526817 |
| 32 | 147.73 | 143.841068735295 | 3.88893126470472 |
| 33 | 166.79 | 151.487343393439 | 15.3026566065606 |
| 34 | 144.3 | 151.68215293887 | -7.38215293886986 |
| 35 | 156.07 | 159.040271811065 | -2.97027181106488 |
| 36 | 161.7 | 154.105096660161 | 7.5949033398392 |
| 37 | 152.1 | 155.127846773671 | -3.02784677367051 |
| 38 | 140.45 | 145.785105657403 | -5.33510565740307 |
| 39 | 155.56 | 150.221081348142 | 5.33891865185832 |
| 40 | 174.53 | 161.134474424442 | 13.3955255755581 |
| 41 | 167.16 | 160.322767985149 | 6.83723201485149 |
| 42 | 159.48 | 149.072516736541 | 10.4074832634585 |
| 43 | 173.22 | 161.873127284199 | 11.3468727158010 |
| 44 | 176.13 | 143.625966528883 | 32.5040334711175 |
| 45 | 180.31 | 157.985053439983 | 22.3249465600166 |
| 46 | 185.84 | 167.713355114915 | 18.1266448850848 |
| 47 | 169.43 | 170.996707661857 | -1.56670766185720 |
| 48 | 195.25 | 177.733871107993 | 17.5161288920073 |
| 49 | 174.99 | 180.071585653158 | -5.08158565315781 |
| 50 | 156.42 | 158.163628856628 | -1.74362885662798 |
| 51 | 182.08 | 175.254107935951 | 6.82589206404874 |
| 52 | 182 | 166.678429404816 | 15.3215705951839 |
| 53 | 153.28 | 169.377353315467 | -16.0973533154668 |
| 54 | 136.72 | 170.152532964992 | -33.432532964992 |
| 55 | 130.19 | 151.515753118815 | -21.3257531188147 |
| 56 | 132.04 | 154.490657218825 | -22.4506572188252 |
| 57 | 143.89 | 161.767605447091 | -17.8776054470908 |
| 58 | 133.38 | 151.933781935051 | -18.5537819350508 |
| 59 | 127.98 | 144.961223621520 | -16.9812236215202 |
| 60 | 150.45 | 156.053192114465 | -5.60319211446504 |
| 61 | 133.55 | 155.842148440249 | -22.2921484402487 |
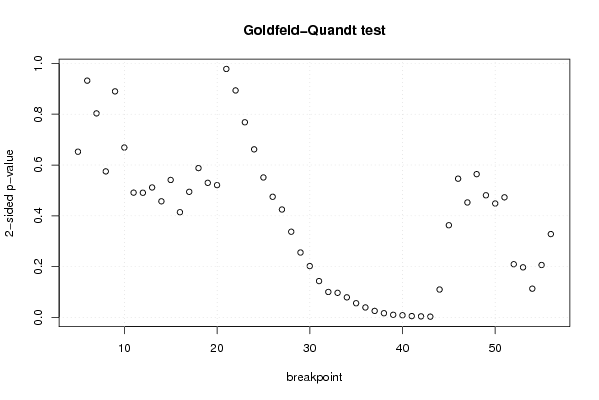
| Goldfeld-Quandt test for Heteroskedasticity | |||
| p-values | Alternative Hypothesis | ||
| breakpoint index | greater | 2-sided | less |
| 5 | 0.326189404113174 | 0.652378808226349 | 0.673810595886826 |
| 6 | 0.53395555111065 | 0.9320888977787 | 0.46604444888935 |
| 7 | 0.401683345183835 | 0.80336669036767 | 0.598316654816165 |
| 8 | 0.287483874154723 | 0.574967748309445 | 0.712516125845277 |
| 9 | 0.444946976899485 | 0.889893953798969 | 0.555053023100515 |
| 10 | 0.334427756784060 | 0.668855513568119 | 0.66557224321594 |
| 11 | 0.245667223357378 | 0.491334446714756 | 0.754332776642622 |
| 12 | 0.245455456284912 | 0.490910912569823 | 0.754544543715088 |
| 13 | 0.255882170926344 | 0.511764341852688 | 0.744117829073656 |
| 14 | 0.228607012201552 | 0.457214024403105 | 0.771392987798448 |
| 15 | 0.270652801046952 | 0.541305602093904 | 0.729347198953048 |
| 16 | 0.207173549307149 | 0.414347098614298 | 0.792826450692851 |
| 17 | 0.247299305905333 | 0.494598611810667 | 0.752700694094667 |
| 18 | 0.293979928809691 | 0.587959857619383 | 0.706020071190309 |
| 19 | 0.264975352601441 | 0.529950705202882 | 0.735024647398559 |
| 20 | 0.260498326825826 | 0.520996653651652 | 0.739501673174174 |
| 21 | 0.489071672935862 | 0.978143345871723 | 0.510928327064138 |
| 22 | 0.446792937682433 | 0.893585875364867 | 0.553207062317567 |
| 23 | 0.384135820350593 | 0.768271640701187 | 0.615864179649407 |
| 24 | 0.33085228468771 | 0.66170456937542 | 0.66914771531229 |
| 25 | 0.275546628188883 | 0.551093256377766 | 0.724453371811117 |
| 26 | 0.237520477304389 | 0.475040954608778 | 0.762479522695611 |
| 27 | 0.212467741885758 | 0.424935483771517 | 0.787532258114242 |
| 28 | 0.168750033336141 | 0.337500066672281 | 0.83124996666386 |
| 29 | 0.127837377876334 | 0.255674755752669 | 0.872162622123666 |
| 30 | 0.101138416100487 | 0.202276832200974 | 0.898861583899513 |
| 31 | 0.0716534128556518 | 0.143306825711304 | 0.928346587144348 |
| 32 | 0.0502357330508296 | 0.100471466101659 | 0.94976426694917 |
| 33 | 0.0485425242379713 | 0.0970850484759425 | 0.951457475762029 |
| 34 | 0.0396526468854478 | 0.0793052937708957 | 0.960347353114552 |
| 35 | 0.0280188135182369 | 0.0560376270364737 | 0.971981186481763 |
| 36 | 0.0197707850220263 | 0.0395415700440527 | 0.980229214977974 |
| 37 | 0.0129625866340042 | 0.0259251732680084 | 0.987037413365996 |
| 38 | 0.00838577949259833 | 0.0167715589851967 | 0.991614220507402 |
| 39 | 0.00528297407998074 | 0.0105659481599615 | 0.99471702592002 |
| 40 | 0.00441798654885528 | 0.00883597309771056 | 0.995582013451145 |
| 41 | 0.00273056966232526 | 0.00546113932465051 | 0.997269430337675 |
| 42 | 0.00219312796157651 | 0.00438625592315302 | 0.997806872038423 |
| 43 | 0.00163618991097458 | 0.00327237982194916 | 0.998363810089025 |
| 44 | 0.0550037723720441 | 0.110007544744088 | 0.944996227627956 |
| 45 | 0.181538892118653 | 0.363077784237305 | 0.818461107881347 |
| 46 | 0.273131858208746 | 0.546263716417493 | 0.726868141791254 |
| 47 | 0.226360009961055 | 0.45272001992211 | 0.773639990038945 |
| 48 | 0.282069578535098 | 0.564139157070195 | 0.717930421464902 |
| 49 | 0.240464625684858 | 0.480929251369715 | 0.759535374315143 |
| 50 | 0.224293787068309 | 0.448587574136619 | 0.77570621293169 |
| 51 | 0.236474793661368 | 0.472949587322736 | 0.763525206338632 |
| 52 | 0.8951951853279 | 0.209609629344198 | 0.104804814672099 |
| 53 | 0.901283299328306 | 0.197433401343387 | 0.0987167006716937 |
| 54 | 0.943303300619555 | 0.113393398760890 | 0.0566966993804448 |
| 55 | 0.896730496419142 | 0.206539007161715 | 0.103269503580857 |
| 56 | 0.835865026720133 | 0.328269946559734 | 0.164134973279867 |
| Meta Analysis of Goldfeld-Quandt test for Heteroskedasticity | |||
| Description | # significant tests | % significant tests | OK/NOK |
| 1% type I error level | 4 | 0.0769230769230769 | NOK |
| 5% type I error level | 8 | 0.153846153846154 | NOK |
| 10% type I error level | 11 | 0.211538461538462 | NOK |