| Multiple Linear Regression - Estimated Regression Equation |
| InvoerEU[t] = + 90.7172722565875 + 0.390789979219476InvoerAM[t] -18.2713893456953M1[t] -17.3592425044589M2[t] + 0.221347720986538M3[t] -2.20547816051791M4[t] -6.24186513507341M5[t] -8.22411062064349M6[t] -8.5439528631746M7[t] -1.29139665823474M8[t] + 6.37482333788861M9[t] -5.25423247582743M10[t] -10.5025775073663M11[t] + e[t] |
| Multiple Linear Regression - Ordinary Least Squares | |||||
| Variable | Parameter | S.D. | T-STAT H0: parameter = 0 | 2-tail p-value | 1-tail p-value |
| (Intercept) | 90.7172722565875 | 12.252527 | 7.404 | 0 | 0 |
| InvoerAM | 0.390789979219476 | 0.0595 | 6.5679 | 0 | 0 |
| M1 | -18.2713893456953 | 8.123873 | -2.2491 | 0.029131 | 0.014566 |
| M2 | -17.3592425044589 | 8.577429 | -2.0238 | 0.048574 | 0.024287 |
| M3 | 0.221347720986538 | 8.50056 | 0.026 | 0.979334 | 0.489667 |
| M4 | -2.20547816051791 | 8.454535 | -0.2609 | 0.795314 | 0.397657 |
| M5 | -6.24186513507341 | 8.453807 | -0.7383 | 0.463897 | 0.231948 |
| M6 | -8.22411062064349 | 8.494714 | -0.9681 | 0.337825 | 0.168913 |
| M7 | -8.5439528631746 | 8.531436 | -1.0015 | 0.321623 | 0.160812 |
| M8 | -1.29139665823474 | 8.665364 | -0.149 | 0.882155 | 0.441077 |
| M9 | 6.37482333788861 | 8.464761 | 0.7531 | 0.455067 | 0.227533 |
| M10 | -5.25423247582743 | 8.520668 | -0.6166 | 0.540382 | 0.270191 |
| M11 | -10.5025775073663 | 8.458542 | -1.2417 | 0.220398 | 0.110199 |
| Multiple Linear Regression - Regression Statistics | |
| Multiple R | 0.76477950540453 |
| R-squared | 0.584887691886798 |
| Adjusted R-squared | 0.481109614858498 |
| F-TEST (value) | 5.63594651813888 |
| F-TEST (DF numerator) | 12 |
| F-TEST (DF denominator) | 48 |
| p-value | 6.45611813276936e-06 |
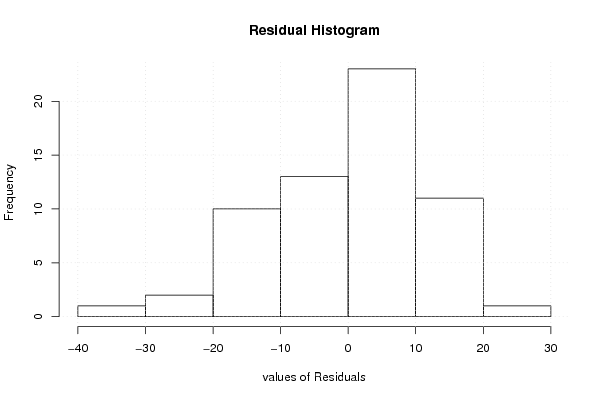
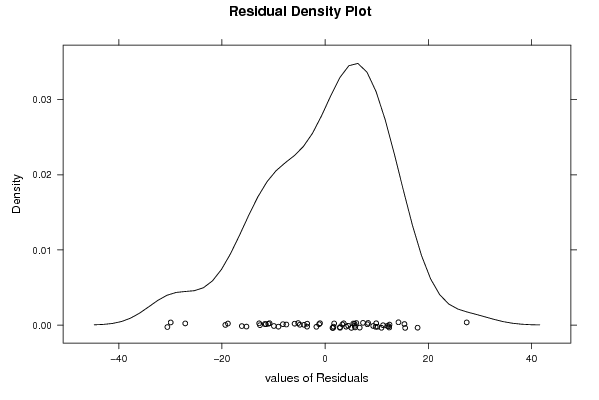
| Multiple Linear Regression - Residual Statistics | |
| Residual Standard Deviation | 13.3526474338707 |
| Sum Squared Residuals | 8558.07328767618 |
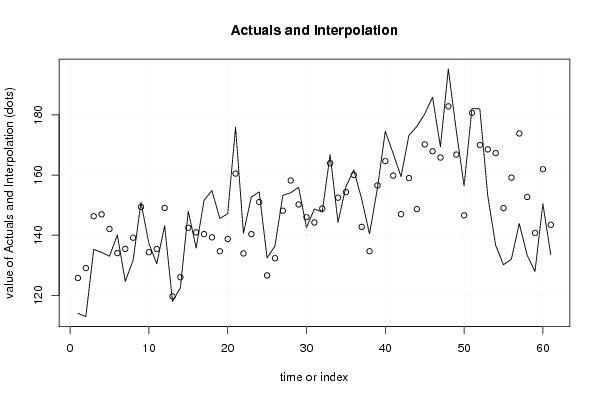
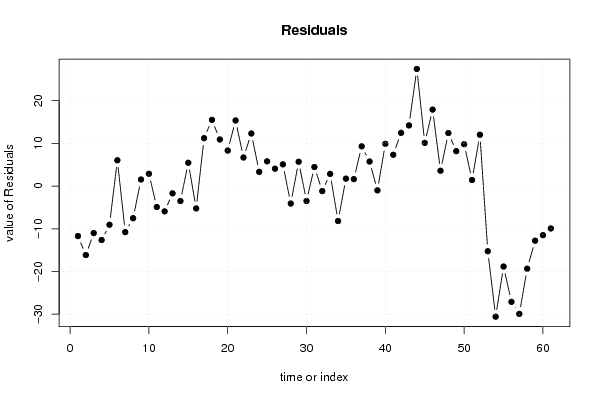
| Multiple Linear Regression - Actuals, Interpolation, and Residuals | |||
| Time or Index | Actuals | Interpolation Forecast | Residuals Prediction Error |
| 1 | 114.08 | 125.784807174559 | -11.7048071745590 |
| 2 | 112.95 | 129.092496588410 | -16.1424965884104 |
| 3 | 135.31 | 146.317467932766 | -11.0074679327661 |
| 4 | 134.31 | 146.938803889174 | -12.6288038891735 |
| 5 | 133.03 | 142.073942158673 | -9.04394215867274 |
| 6 | 140.11 | 134.061807293746 | 6.04819270625387 |
| 7 | 124.69 | 135.469256759365 | -10.7792567593651 |
| 8 | 131.68 | 139.189071552161 | -7.5090715521609 |
| 9 | 150.95 | 149.399334313003 | 1.55066568699694 |
| 10 | 137.26 | 134.366497780285 | 2.89350221971461 |
| 11 | 130.51 | 135.413779313972 | -4.90377931397221 |
| 12 | 143.15 | 149.070031953640 | -5.92003195363972 |
| 13 | 118.01 | 119.700207198111 | -1.69020719811132 |
| 14 | 122.56 | 126.056058449875 | -3.49605844987504 |
| 15 | 147.97 | 142.495541936000 | 5.47445806400042 |
| 16 | 135.74 | 140.963625106908 | -5.22362510690773 |
| 17 | 151.62 | 140.385729448445 | 11.2342705515554 |
| 18 | 154.82 | 139.302300915079 | 15.5176990849207 |
| 19 | 145.59 | 134.664229402173 | 10.9257705978270 |
| 20 | 147.12 | 138.786557873565 | 8.33344212643516 |
| 21 | 175.86 | 160.482138123667 | 15.3778618763326 |
| 22 | 140.66 | 133.956168302105 | 6.70383169789507 |
| 23 | 152.69 | 140.361180450891 | 12.3288195491092 |
| 24 | 154.38 | 151.031797649322 | 3.34820235067849 |
| 25 | 132.45 | 126.648453028634 | 5.80154697136638 |
| 26 | 136.44 | 132.359500814685 | 4.08049918531481 |
| 27 | 153.24 | 148.146365035513 | 5.09363496448681 |
| 28 | 154.11 | 158.189647390902 | -4.07964739090224 |
| 29 | 155.93 | 150.218005325607 | 5.71199467439339 |
| 30 | 142.53 | 146.004349058693 | -3.47434905869334 |
| 31 | 148.73 | 144.254215492219 | 4.47578450778104 |
| 32 | 147.73 | 148.892386736180 | -1.16238673618050 |
| 33 | 166.79 | 163.921089940799 | 2.86891005920120 |
| 34 | 144.3 | 152.479613317108 | -8.17961331710809 |
| 35 | 156.07 | 154.316290608818 | 1.75370939118171 |
| 36 | 161.7 | 160.066861968876 | 1.63313803112419 |
| 37 | 152.1 | 142.780263370814 | 9.3197366291864 |
| 38 | 140.45 | 134.696424890418 | 5.75357510958232 |
| 39 | 155.56 | 156.548349588732 | -0.988349588731937 |
| 40 | 174.53 | 164.629866248439 | 9.90013375156078 |
| 41 | 167.16 | 159.811899315445 | 7.34810068455523 |
| 42 | 159.48 | 146.996955605911 | 12.4830443940892 |
| 43 | 173.22 | 159.002629307962 | 14.2173706920380 |
| 44 | 176.13 | 148.685268047194 | 27.4447319528058 |
| 45 | 180.31 | 170.177637508103 | 10.1323624918974 |
| 46 | 185.84 | 167.915817496277 | 17.9241825037226 |
| 47 | 169.43 | 165.828963396624 | 3.60103660337595 |
| 48 | 195.25 | 182.818654559034 | 12.4313454409663 |
| 49 | 174.99 | 166.798215493643 | 8.19178450635741 |
| 50 | 156.42 | 146.615519256612 | 9.8044807433883 |
| 51 | 182.08 | 180.652275506989 | 1.42772449301077 |
| 52 | 182 | 169.968057364577 | 12.0319426354227 |
| 53 | 153.28 | 168.530423751831 | -15.2504237518313 |
| 54 | 136.72 | 167.294587126570 | -30.5745871265704 |
| 55 | 130.19 | 149.029669038281 | -18.8396690382810 |
| 56 | 132.04 | 159.146715790900 | -27.1067157908995 |
| 57 | 143.89 | 173.819800114428 | -29.9298001144281 |
| 58 | 133.38 | 152.721903104224 | -19.3419031042242 |
| 59 | 127.98 | 140.759786229695 | -12.7797862296947 |
| 60 | 150.45 | 161.942653869129 | -11.4926538691293 |
| 61 | 133.55 | 143.46805373424 | -9.91805373423986 |
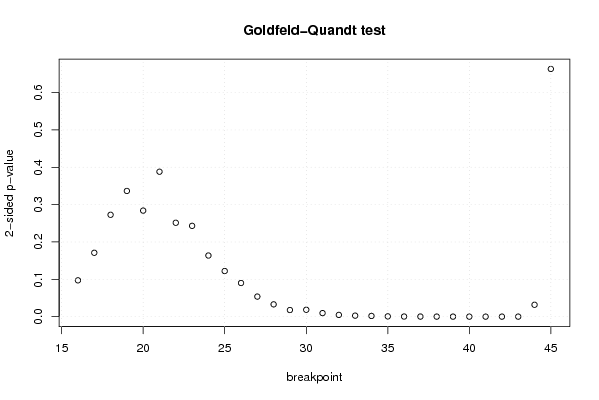
| Goldfeld-Quandt test for Heteroskedasticity | |||
| p-values | Alternative Hypothesis | ||
| breakpoint index | greater | 2-sided | less |
| 16 | 0.0486338734819288 | 0.0972677469638577 | 0.951366126518071 |
| 17 | 0.0855024121052266 | 0.171004824210453 | 0.914497587894773 |
| 18 | 0.136381760951064 | 0.272763521902128 | 0.863618239048936 |
| 19 | 0.168284263652392 | 0.336568527304783 | 0.831715736347608 |
| 20 | 0.141997551445717 | 0.283995102891434 | 0.858002448554283 |
| 21 | 0.194063397447900 | 0.388126794895799 | 0.8059366025521 |
| 22 | 0.125686060427097 | 0.251372120854195 | 0.874313939572903 |
| 23 | 0.121559508866286 | 0.243119017732571 | 0.878440491133714 |
| 24 | 0.0818332958846213 | 0.163666591769243 | 0.918166704115379 |
| 25 | 0.0610848267875819 | 0.122169653575164 | 0.938915173212418 |
| 26 | 0.0450513158694378 | 0.0901026317388757 | 0.954948684130562 |
| 27 | 0.0268859024935885 | 0.0537718049871769 | 0.973114097506412 |
| 28 | 0.0164608245889039 | 0.0329216491778077 | 0.983539175411096 |
| 29 | 0.00889120805113204 | 0.0177824161022641 | 0.991108791948868 |
| 30 | 0.00922489919333084 | 0.0184497983866617 | 0.990775100806669 |
| 31 | 0.0047633577917952 | 0.0095267155835904 | 0.995236642208205 |
| 32 | 0.00232191386933862 | 0.00464382773867724 | 0.997678086130661 |
| 33 | 0.00136306750855467 | 0.00272613501710933 | 0.998636932491445 |
| 34 | 0.000957822407401818 | 0.00191564481480364 | 0.999042177592598 |
| 35 | 0.000415166629240552 | 0.000830333258481104 | 0.99958483337076 |
| 36 | 0.000171471968665296 | 0.000342943937330592 | 0.999828528031335 |
| 37 | 0.000114567488303261 | 0.000229134976606521 | 0.999885432511697 |
| 38 | 5.84924889815724e-05 | 0.000116984977963145 | 0.999941507511018 |
| 39 | 2.02215353975267e-05 | 4.04430707950534e-05 | 0.999979778464603 |
| 40 | 1.30628728061160e-05 | 2.61257456122319e-05 | 0.999986937127194 |
| 41 | 6.76569317837849e-06 | 1.35313863567570e-05 | 0.999993234306822 |
| 42 | 3.98026062621464e-05 | 7.96052125242928e-05 | 0.999960197393738 |
| 43 | 3.30720316337286e-05 | 6.61440632674571e-05 | 0.999966927968366 |
| 44 | 0.0159132858608517 | 0.0318265717217033 | 0.984086714139148 |
| 45 | 0.331643211450914 | 0.663286422901828 | 0.668356788549086 |
| Meta Analysis of Goldfeld-Quandt test for Heteroskedasticity | |||
| Description | # significant tests | % significant tests | OK/NOK |
| 1% type I error level | 13 | 0.433333333333333 | NOK |
| 5% type I error level | 17 | 0.566666666666667 | NOK |
| 10% type I error level | 20 | 0.666666666666667 | NOK |