Free Statistics

of Irreproducible Research!

Author's title

Author*The author of this computation has been verified*
R Software Modulerwasp_autocorrelation.wasp
Title produced by software(Partial) Autocorrelation Function
Date of computationTue, 24 Nov 2009 11:15:17 -0700
Cite this page as followsStatistical Computations at FreeStatistics.org, Office for Research Development and Education, URL https://freestatistics.org/blog/index.php?v=date/2009/Nov/24/t1259086584ftb8uhqv46w54si.htm/, Retrieved Thu, 25 Apr 2024 05:35:23 +0000
Statistical Computations at FreeStatistics.org, Office for Research Development and Education, URL https://freestatistics.org/blog/index.php?pk=59200, Retrieved Thu, 25 Apr 2024 05:35:23 +0000
QR Codes:

Original text written by user:
IsPrivate?No (this computation is public)
User-defined keywordsWS 8 - methode 1 link 1
Estimated Impact135
Family? (F = Feedback message, R = changed R code, M = changed R Module, P = changed Parameters, D = changed Data)
-     [Univariate Explorative Data Analysis] [Run Sequence gebo...] [2008-12-12 13:32:37] [76963dc1903f0f612b6153510a3818cf]
- R  D  [Univariate Explorative Data Analysis] [Run Sequence gebo...] [2008-12-17 12:14:40] [76963dc1903f0f612b6153510a3818cf]
-         [Univariate Explorative Data Analysis] [Run Sequence Plot...] [2008-12-22 18:19:51] [1ce0d16c8f4225c977b42c8fa93bc163]
- RMP       [(Partial) Autocorrelation Function] [Identifying Integ...] [2009-11-22 12:16:10] [b98453cac15ba1066b407e146608df68]
-    D          [(Partial) Autocorrelation Function] [Workshop 8] [2009-11-24 18:15:17] [100339cefec36dfa6f2b82a1c918e250] [Current]
Feedback Forum

Post a new message
Dataseries X:
449
452
462
455
461
461
463
462
456
455
456
472
472
471
465
459
465
468
467
463
460
462
461
476
476
471
453
443
442
444
438
427
424
416
406
431
434
418
412
404
409
412
406
398
397
385
390
413
413
401
397
397
409
419
424
428
430
424
433
456
459


Summary of computational transaction
Raw Inputview raw input (R code)
Raw Outputview raw output of R engine
Computing time1 seconds
R Server'Gwilym Jenkins' @ 72.249.127.135

\begin{tabular}{lllllllll}
\hline
Summary of computational transaction \tabularnewline
Raw Input & view raw input (R code)  \tabularnewline
Raw Output & view raw output of R engine  \tabularnewline
Computing time & 1 seconds \tabularnewline
R Server & 'Gwilym Jenkins' @ 72.249.127.135 \tabularnewline
\hline
\end{tabular}
%Source: https://freestatistics.org/blog/index.php?pk=59200&T=0

[TABLE]
[ROW][C]Summary of computational transaction[/C][/ROW]
[ROW][C]Raw Input[/C][C]view raw input (R code) [/C][/ROW]
[ROW][C]Raw Output[/C][C]view raw output of R engine [/C][/ROW]
[ROW][C]Computing time[/C][C]1 seconds[/C][/ROW]
[ROW][C]R Server[/C][C]'Gwilym Jenkins' @ 72.249.127.135[/C][/ROW]
[/TABLE]
Source: https://freestatistics.org/blog/index.php?pk=59200&T=0

Globally Unique Identifier (entire table): ba.freestatistics.org/blog/index.php?pk=59200&T=0

As an alternative you can also use a QR Code:  

The GUIDs for individual cells are displayed in the table below:

Summary of computational transaction
Raw Inputview raw input (R code)
Raw Outputview raw output of R engine
Computing time1 seconds
R Server'Gwilym Jenkins' @ 72.249.127.135


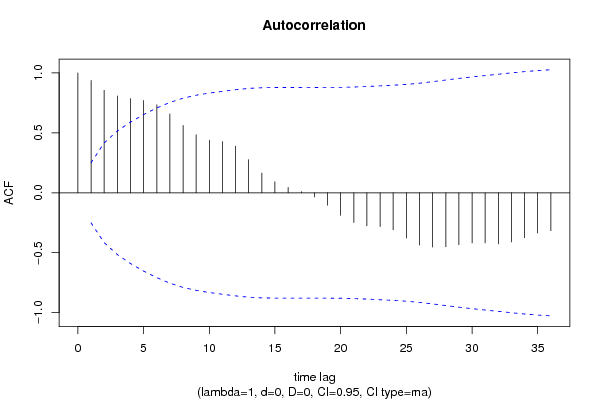
Autocorrelation Function
Time lag kACF(k)T-STATP-value
10.938247.32790
20.8559246.6850
30.8085766.31520
40.7867336.14460
50.7711266.02270
60.7342525.73470
70.6581825.14062e-06
80.5617864.38772.3e-05
90.4842453.78210.000178
100.4396233.43360.000538
110.4280473.34320.00071
120.3887233.0360.001761
130.2764442.15910.017392
140.1645461.28510.1018
150.0919130.71790.237791
160.0449820.35130.363279
170.0097660.07630.469724
18-0.034368-0.26840.39464
19-0.103045-0.80480.212028
20-0.188026-1.46850.073549
21-0.247664-1.93430.028858
22-0.275676-2.15310.017637
23-0.281743-2.20050.015784
24-0.30907-2.41390.009399
25-0.377711-2.950.002251
26-0.435865-3.40420.000589
27-0.452589-3.53480.000393
28-0.450347-3.51730.000415
29-0.433437-3.38530.000624
30-0.418307-3.26710.000893
31-0.418164-3.2660.000896
32-0.426459-3.33080.000737
33-0.409694-3.19980.001092
34-0.374195-2.92260.002432
35-0.334936-2.61590.0056
36-0.315803-2.46650.008235

\begin{tabular}{lllllllll}
\hline
Autocorrelation Function \tabularnewline
Time lag k & ACF(k) & T-STAT & P-value \tabularnewline
1 & 0.93824 & 7.3279 & 0 \tabularnewline
2 & 0.855924 & 6.685 & 0 \tabularnewline
3 & 0.808576 & 6.3152 & 0 \tabularnewline
4 & 0.786733 & 6.1446 & 0 \tabularnewline
5 & 0.771126 & 6.0227 & 0 \tabularnewline
6 & 0.734252 & 5.7347 & 0 \tabularnewline
7 & 0.658182 & 5.1406 & 2e-06 \tabularnewline
8 & 0.561786 & 4.3877 & 2.3e-05 \tabularnewline
9 & 0.484245 & 3.7821 & 0.000178 \tabularnewline
10 & 0.439623 & 3.4336 & 0.000538 \tabularnewline
11 & 0.428047 & 3.3432 & 0.00071 \tabularnewline
12 & 0.388723 & 3.036 & 0.001761 \tabularnewline
13 & 0.276444 & 2.1591 & 0.017392 \tabularnewline
14 & 0.164546 & 1.2851 & 0.1018 \tabularnewline
15 & 0.091913 & 0.7179 & 0.237791 \tabularnewline
16 & 0.044982 & 0.3513 & 0.363279 \tabularnewline
17 & 0.009766 & 0.0763 & 0.469724 \tabularnewline
18 & -0.034368 & -0.2684 & 0.39464 \tabularnewline
19 & -0.103045 & -0.8048 & 0.212028 \tabularnewline
20 & -0.188026 & -1.4685 & 0.073549 \tabularnewline
21 & -0.247664 & -1.9343 & 0.028858 \tabularnewline
22 & -0.275676 & -2.1531 & 0.017637 \tabularnewline
23 & -0.281743 & -2.2005 & 0.015784 \tabularnewline
24 & -0.30907 & -2.4139 & 0.009399 \tabularnewline
25 & -0.377711 & -2.95 & 0.002251 \tabularnewline
26 & -0.435865 & -3.4042 & 0.000589 \tabularnewline
27 & -0.452589 & -3.5348 & 0.000393 \tabularnewline
28 & -0.450347 & -3.5173 & 0.000415 \tabularnewline
29 & -0.433437 & -3.3853 & 0.000624 \tabularnewline
30 & -0.418307 & -3.2671 & 0.000893 \tabularnewline
31 & -0.418164 & -3.266 & 0.000896 \tabularnewline
32 & -0.426459 & -3.3308 & 0.000737 \tabularnewline
33 & -0.409694 & -3.1998 & 0.001092 \tabularnewline
34 & -0.374195 & -2.9226 & 0.002432 \tabularnewline
35 & -0.334936 & -2.6159 & 0.0056 \tabularnewline
36 & -0.315803 & -2.4665 & 0.008235 \tabularnewline
\hline
\end{tabular}
%Source: https://freestatistics.org/blog/index.php?pk=59200&T=1

[TABLE]
[ROW][C]Autocorrelation Function[/C][/ROW]
[ROW][C]Time lag k[/C][C]ACF(k)[/C][C]T-STAT[/C][C]P-value[/C][/ROW]
[ROW][C]1[/C][C]0.93824[/C][C]7.3279[/C][C]0[/C][/ROW]
[ROW][C]2[/C][C]0.855924[/C][C]6.685[/C][C]0[/C][/ROW]
[ROW][C]3[/C][C]0.808576[/C][C]6.3152[/C][C]0[/C][/ROW]
[ROW][C]4[/C][C]0.786733[/C][C]6.1446[/C][C]0[/C][/ROW]
[ROW][C]5[/C][C]0.771126[/C][C]6.0227[/C][C]0[/C][/ROW]
[ROW][C]6[/C][C]0.734252[/C][C]5.7347[/C][C]0[/C][/ROW]
[ROW][C]7[/C][C]0.658182[/C][C]5.1406[/C][C]2e-06[/C][/ROW]
[ROW][C]8[/C][C]0.561786[/C][C]4.3877[/C][C]2.3e-05[/C][/ROW]
[ROW][C]9[/C][C]0.484245[/C][C]3.7821[/C][C]0.000178[/C][/ROW]
[ROW][C]10[/C][C]0.439623[/C][C]3.4336[/C][C]0.000538[/C][/ROW]
[ROW][C]11[/C][C]0.428047[/C][C]3.3432[/C][C]0.00071[/C][/ROW]
[ROW][C]12[/C][C]0.388723[/C][C]3.036[/C][C]0.001761[/C][/ROW]
[ROW][C]13[/C][C]0.276444[/C][C]2.1591[/C][C]0.017392[/C][/ROW]
[ROW][C]14[/C][C]0.164546[/C][C]1.2851[/C][C]0.1018[/C][/ROW]
[ROW][C]15[/C][C]0.091913[/C][C]0.7179[/C][C]0.237791[/C][/ROW]
[ROW][C]16[/C][C]0.044982[/C][C]0.3513[/C][C]0.363279[/C][/ROW]
[ROW][C]17[/C][C]0.009766[/C][C]0.0763[/C][C]0.469724[/C][/ROW]
[ROW][C]18[/C][C]-0.034368[/C][C]-0.2684[/C][C]0.39464[/C][/ROW]
[ROW][C]19[/C][C]-0.103045[/C][C]-0.8048[/C][C]0.212028[/C][/ROW]
[ROW][C]20[/C][C]-0.188026[/C][C]-1.4685[/C][C]0.073549[/C][/ROW]
[ROW][C]21[/C][C]-0.247664[/C][C]-1.9343[/C][C]0.028858[/C][/ROW]
[ROW][C]22[/C][C]-0.275676[/C][C]-2.1531[/C][C]0.017637[/C][/ROW]
[ROW][C]23[/C][C]-0.281743[/C][C]-2.2005[/C][C]0.015784[/C][/ROW]
[ROW][C]24[/C][C]-0.30907[/C][C]-2.4139[/C][C]0.009399[/C][/ROW]
[ROW][C]25[/C][C]-0.377711[/C][C]-2.95[/C][C]0.002251[/C][/ROW]
[ROW][C]26[/C][C]-0.435865[/C][C]-3.4042[/C][C]0.000589[/C][/ROW]
[ROW][C]27[/C][C]-0.452589[/C][C]-3.5348[/C][C]0.000393[/C][/ROW]
[ROW][C]28[/C][C]-0.450347[/C][C]-3.5173[/C][C]0.000415[/C][/ROW]
[ROW][C]29[/C][C]-0.433437[/C][C]-3.3853[/C][C]0.000624[/C][/ROW]
[ROW][C]30[/C][C]-0.418307[/C][C]-3.2671[/C][C]0.000893[/C][/ROW]
[ROW][C]31[/C][C]-0.418164[/C][C]-3.266[/C][C]0.000896[/C][/ROW]
[ROW][C]32[/C][C]-0.426459[/C][C]-3.3308[/C][C]0.000737[/C][/ROW]
[ROW][C]33[/C][C]-0.409694[/C][C]-3.1998[/C][C]0.001092[/C][/ROW]
[ROW][C]34[/C][C]-0.374195[/C][C]-2.9226[/C][C]0.002432[/C][/ROW]
[ROW][C]35[/C][C]-0.334936[/C][C]-2.6159[/C][C]0.0056[/C][/ROW]
[ROW][C]36[/C][C]-0.315803[/C][C]-2.4665[/C][C]0.008235[/C][/ROW]
[/TABLE]
Source: https://freestatistics.org/blog/index.php?pk=59200&T=1

Globally Unique Identifier (entire table): ba.freestatistics.org/blog/index.php?pk=59200&T=1

As an alternative you can also use a QR Code:  

The GUIDs for individual cells are displayed in the table below:

Autocorrelation Function
Time lag kACF(k)T-STATP-value
10.938247.32790
20.8559246.6850
30.8085766.31520
40.7867336.14460
50.7711266.02270
60.7342525.73470
70.6581825.14062e-06
80.5617864.38772.3e-05
90.4842453.78210.000178
100.4396233.43360.000538
110.4280473.34320.00071
120.3887233.0360.001761
130.2764442.15910.017392
140.1645461.28510.1018
150.0919130.71790.237791
160.0449820.35130.363279
170.0097660.07630.469724
18-0.034368-0.26840.39464
19-0.103045-0.80480.212028
20-0.188026-1.46850.073549
21-0.247664-1.93430.028858
22-0.275676-2.15310.017637
23-0.281743-2.20050.015784
24-0.30907-2.41390.009399
25-0.377711-2.950.002251
26-0.435865-3.40420.000589
27-0.452589-3.53480.000393
28-0.450347-3.51730.000415
29-0.433437-3.38530.000624
30-0.418307-3.26710.000893
31-0.418164-3.2660.000896
32-0.426459-3.33080.000737
33-0.409694-3.19980.001092
34-0.374195-2.92260.002432
35-0.334936-2.61590.0056
36-0.315803-2.46650.008235


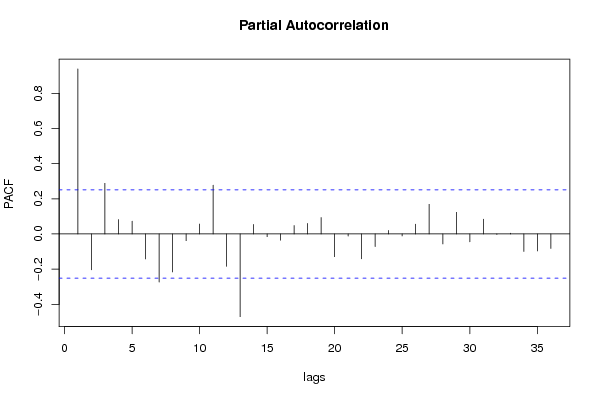
Partial Autocorrelation Function
Time lag kPACF(k)T-STATP-value
10.938247.32790
2-0.203592-1.59010.05849
30.2879032.24860.014081
40.0822920.64270.261407
50.0725570.56670.286503
6-0.141629-1.10620.136501
7-0.273623-2.13710.018306
8-0.21574-1.6850.048551
9-0.038445-0.30030.382498
100.0562080.4390.331106
110.2773382.16610.017111
12-0.183891-1.43620.078023
13-0.47004-3.67110.000255
140.0543050.42410.336479
15-0.015599-0.12180.451715
16-0.035638-0.27830.390845
170.0479210.37430.354749
180.0597590.46670.321177
190.0930480.72670.235085
20-0.129365-1.01040.158154
21-0.012155-0.09490.462339
22-0.140899-1.10050.137729
23-0.071808-0.56080.28848
240.0200520.15660.438034
25-0.011417-0.08920.464619
260.055430.43290.333299
270.1685681.31660.096456
28-0.056864-0.44410.329262
290.1230890.96140.170085
30-0.044842-0.35020.363688
310.0844150.65930.256093
32-0.002725-0.02130.491546
330.0044010.03440.486345
34-0.099621-0.77810.21977
35-0.096221-0.75150.227618
36-0.082018-0.64060.262098

\begin{tabular}{lllllllll}
\hline
Partial Autocorrelation Function \tabularnewline
Time lag k & PACF(k) & T-STAT & P-value \tabularnewline
1 & 0.93824 & 7.3279 & 0 \tabularnewline
2 & -0.203592 & -1.5901 & 0.05849 \tabularnewline
3 & 0.287903 & 2.2486 & 0.014081 \tabularnewline
4 & 0.082292 & 0.6427 & 0.261407 \tabularnewline
5 & 0.072557 & 0.5667 & 0.286503 \tabularnewline
6 & -0.141629 & -1.1062 & 0.136501 \tabularnewline
7 & -0.273623 & -2.1371 & 0.018306 \tabularnewline
8 & -0.21574 & -1.685 & 0.048551 \tabularnewline
9 & -0.038445 & -0.3003 & 0.382498 \tabularnewline
10 & 0.056208 & 0.439 & 0.331106 \tabularnewline
11 & 0.277338 & 2.1661 & 0.017111 \tabularnewline
12 & -0.183891 & -1.4362 & 0.078023 \tabularnewline
13 & -0.47004 & -3.6711 & 0.000255 \tabularnewline
14 & 0.054305 & 0.4241 & 0.336479 \tabularnewline
15 & -0.015599 & -0.1218 & 0.451715 \tabularnewline
16 & -0.035638 & -0.2783 & 0.390845 \tabularnewline
17 & 0.047921 & 0.3743 & 0.354749 \tabularnewline
18 & 0.059759 & 0.4667 & 0.321177 \tabularnewline
19 & 0.093048 & 0.7267 & 0.235085 \tabularnewline
20 & -0.129365 & -1.0104 & 0.158154 \tabularnewline
21 & -0.012155 & -0.0949 & 0.462339 \tabularnewline
22 & -0.140899 & -1.1005 & 0.137729 \tabularnewline
23 & -0.071808 & -0.5608 & 0.28848 \tabularnewline
24 & 0.020052 & 0.1566 & 0.438034 \tabularnewline
25 & -0.011417 & -0.0892 & 0.464619 \tabularnewline
26 & 0.05543 & 0.4329 & 0.333299 \tabularnewline
27 & 0.168568 & 1.3166 & 0.096456 \tabularnewline
28 & -0.056864 & -0.4441 & 0.329262 \tabularnewline
29 & 0.123089 & 0.9614 & 0.170085 \tabularnewline
30 & -0.044842 & -0.3502 & 0.363688 \tabularnewline
31 & 0.084415 & 0.6593 & 0.256093 \tabularnewline
32 & -0.002725 & -0.0213 & 0.491546 \tabularnewline
33 & 0.004401 & 0.0344 & 0.486345 \tabularnewline
34 & -0.099621 & -0.7781 & 0.21977 \tabularnewline
35 & -0.096221 & -0.7515 & 0.227618 \tabularnewline
36 & -0.082018 & -0.6406 & 0.262098 \tabularnewline
\hline
\end{tabular}
%Source: https://freestatistics.org/blog/index.php?pk=59200&T=2

[TABLE]
[ROW][C]Partial Autocorrelation Function[/C][/ROW]
[ROW][C]Time lag k[/C][C]PACF(k)[/C][C]T-STAT[/C][C]P-value[/C][/ROW]
[ROW][C]1[/C][C]0.93824[/C][C]7.3279[/C][C]0[/C][/ROW]
[ROW][C]2[/C][C]-0.203592[/C][C]-1.5901[/C][C]0.05849[/C][/ROW]
[ROW][C]3[/C][C]0.287903[/C][C]2.2486[/C][C]0.014081[/C][/ROW]
[ROW][C]4[/C][C]0.082292[/C][C]0.6427[/C][C]0.261407[/C][/ROW]
[ROW][C]5[/C][C]0.072557[/C][C]0.5667[/C][C]0.286503[/C][/ROW]
[ROW][C]6[/C][C]-0.141629[/C][C]-1.1062[/C][C]0.136501[/C][/ROW]
[ROW][C]7[/C][C]-0.273623[/C][C]-2.1371[/C][C]0.018306[/C][/ROW]
[ROW][C]8[/C][C]-0.21574[/C][C]-1.685[/C][C]0.048551[/C][/ROW]
[ROW][C]9[/C][C]-0.038445[/C][C]-0.3003[/C][C]0.382498[/C][/ROW]
[ROW][C]10[/C][C]0.056208[/C][C]0.439[/C][C]0.331106[/C][/ROW]
[ROW][C]11[/C][C]0.277338[/C][C]2.1661[/C][C]0.017111[/C][/ROW]
[ROW][C]12[/C][C]-0.183891[/C][C]-1.4362[/C][C]0.078023[/C][/ROW]
[ROW][C]13[/C][C]-0.47004[/C][C]-3.6711[/C][C]0.000255[/C][/ROW]
[ROW][C]14[/C][C]0.054305[/C][C]0.4241[/C][C]0.336479[/C][/ROW]
[ROW][C]15[/C][C]-0.015599[/C][C]-0.1218[/C][C]0.451715[/C][/ROW]
[ROW][C]16[/C][C]-0.035638[/C][C]-0.2783[/C][C]0.390845[/C][/ROW]
[ROW][C]17[/C][C]0.047921[/C][C]0.3743[/C][C]0.354749[/C][/ROW]
[ROW][C]18[/C][C]0.059759[/C][C]0.4667[/C][C]0.321177[/C][/ROW]
[ROW][C]19[/C][C]0.093048[/C][C]0.7267[/C][C]0.235085[/C][/ROW]
[ROW][C]20[/C][C]-0.129365[/C][C]-1.0104[/C][C]0.158154[/C][/ROW]
[ROW][C]21[/C][C]-0.012155[/C][C]-0.0949[/C][C]0.462339[/C][/ROW]
[ROW][C]22[/C][C]-0.140899[/C][C]-1.1005[/C][C]0.137729[/C][/ROW]
[ROW][C]23[/C][C]-0.071808[/C][C]-0.5608[/C][C]0.28848[/C][/ROW]
[ROW][C]24[/C][C]0.020052[/C][C]0.1566[/C][C]0.438034[/C][/ROW]
[ROW][C]25[/C][C]-0.011417[/C][C]-0.0892[/C][C]0.464619[/C][/ROW]
[ROW][C]26[/C][C]0.05543[/C][C]0.4329[/C][C]0.333299[/C][/ROW]
[ROW][C]27[/C][C]0.168568[/C][C]1.3166[/C][C]0.096456[/C][/ROW]
[ROW][C]28[/C][C]-0.056864[/C][C]-0.4441[/C][C]0.329262[/C][/ROW]
[ROW][C]29[/C][C]0.123089[/C][C]0.9614[/C][C]0.170085[/C][/ROW]
[ROW][C]30[/C][C]-0.044842[/C][C]-0.3502[/C][C]0.363688[/C][/ROW]
[ROW][C]31[/C][C]0.084415[/C][C]0.6593[/C][C]0.256093[/C][/ROW]
[ROW][C]32[/C][C]-0.002725[/C][C]-0.0213[/C][C]0.491546[/C][/ROW]
[ROW][C]33[/C][C]0.004401[/C][C]0.0344[/C][C]0.486345[/C][/ROW]
[ROW][C]34[/C][C]-0.099621[/C][C]-0.7781[/C][C]0.21977[/C][/ROW]
[ROW][C]35[/C][C]-0.096221[/C][C]-0.7515[/C][C]0.227618[/C][/ROW]
[ROW][C]36[/C][C]-0.082018[/C][C]-0.6406[/C][C]0.262098[/C][/ROW]
[/TABLE]
Source: https://freestatistics.org/blog/index.php?pk=59200&T=2

Globally Unique Identifier (entire table): ba.freestatistics.org/blog/index.php?pk=59200&T=2

As an alternative you can also use a QR Code:  

The GUIDs for individual cells are displayed in the table below:

Partial Autocorrelation Function
Time lag kPACF(k)T-STATP-value
10.938247.32790
2-0.203592-1.59010.05849
30.2879032.24860.014081
40.0822920.64270.261407
50.0725570.56670.286503
6-0.141629-1.10620.136501
7-0.273623-2.13710.018306
8-0.21574-1.6850.048551
9-0.038445-0.30030.382498
100.0562080.4390.331106
110.2773382.16610.017111
12-0.183891-1.43620.078023
13-0.47004-3.67110.000255
140.0543050.42410.336479
15-0.015599-0.12180.451715
16-0.035638-0.27830.390845
170.0479210.37430.354749
180.0597590.46670.321177
190.0930480.72670.235085
20-0.129365-1.01040.158154
21-0.012155-0.09490.462339
22-0.140899-1.10050.137729
23-0.071808-0.56080.28848
240.0200520.15660.438034
25-0.011417-0.08920.464619
260.055430.43290.333299
270.1685681.31660.096456
28-0.056864-0.44410.329262
290.1230890.96140.170085
30-0.044842-0.35020.363688
310.0844150.65930.256093
32-0.002725-0.02130.491546
330.0044010.03440.486345
34-0.099621-0.77810.21977
35-0.096221-0.75150.227618
36-0.082018-0.64060.262098


Parameters (Session):
par1 = 36 ; par2 = 1 ; par3 = 0 ; par4 = 0 ; par5 = 12 ; par6 = MA ; par7 = 0.95 ;
Parameters (R input):
par1 = 36 ; par2 = 1 ; par3 = 0 ; par4 = 0 ; par5 = 12 ; par6 = MA ; par7 = 0.95 ;
R code (references can be found in the software module):
if (par1 == 'Default') {
par1 = 10*log10(length(x))
} else {
par1 <- as.numeric(par1)
}
par2 <- as.numeric(par2)
par3 <- as.numeric(par3)
par4 <- as.numeric(par4)
par5 <- as.numeric(par5)
if (par6 == 'White Noise') par6 <- 'white' else par6 <- 'ma'
par7 <- as.numeric(par7)
if (par2 == 0) {
x <- log(x)
} else {
x <- (x ^ par2 - 1) / par2
}
if (par3 > 0) x <- diff(x,lag=1,difference=par3)
if (par4 > 0) x <- diff(x,lag=par5,difference=par4)
bitmap(file='pic1.png')
racf <- acf(x, par1, main='Autocorrelation', xlab='time lag', ylab='ACF', ci.type=par6, ci=par7, sub=paste('(lambda=',par2,', d=',par3,', D=',par4,', CI=', par7, ', CI type=',par6,')',sep=''))
dev.off()
bitmap(file='pic2.png')
rpacf <- pacf(x,par1,main='Partial Autocorrelation',xlab='lags',ylab='PACF')
dev.off()
(myacf <- c(racf$acf))
(mypacf <- c(rpacf$acf))
lengthx <- length(x)
sqrtn <- sqrt(lengthx)
load(file='createtable')
a<-table.start()
a<-table.row.start(a)
a<-table.element(a,'Autocorrelation Function',4,TRUE)
a<-table.row.end(a)
a<-table.row.start(a)
a<-table.element(a,'Time lag k',header=TRUE)
a<-table.element(a,hyperlink('basics.htm','ACF(k)','click here for more information about the Autocorrelation Function'),header=TRUE)
a<-table.element(a,'T-STAT',header=TRUE)
a<-table.element(a,'P-value',header=TRUE)
a<-table.row.end(a)
for (i in 2:(par1+1)) {
a<-table.row.start(a)
a<-table.element(a,i-1,header=TRUE)
a<-table.element(a,round(myacf[i],6))
mytstat <- myacf[i]*sqrtn
a<-table.element(a,round(mytstat,4))
a<-table.element(a,round(1-pt(abs(mytstat),lengthx),6))
a<-table.row.end(a)
}
a<-table.end(a)
table.save(a,file='mytable.tab')
a<-table.start()
a<-table.row.start(a)
a<-table.element(a,'Partial Autocorrelation Function',4,TRUE)
a<-table.row.end(a)
a<-table.row.start(a)
a<-table.element(a,'Time lag k',header=TRUE)
a<-table.element(a,hyperlink('basics.htm','PACF(k)','click here for more information about the Partial Autocorrelation Function'),header=TRUE)
a<-table.element(a,'T-STAT',header=TRUE)
a<-table.element(a,'P-value',header=TRUE)
a<-table.row.end(a)
for (i in 1:par1) {
a<-table.row.start(a)
a<-table.element(a,i,header=TRUE)
a<-table.element(a,round(mypacf[i],6))
mytstat <- mypacf[i]*sqrtn
a<-table.element(a,round(mytstat,4))
a<-table.element(a,round(1-pt(abs(mytstat),lengthx),6))
a<-table.row.end(a)
}
a<-table.end(a)
table.save(a,file='mytable1.tab')