Free Statistics

of Irreproducible Research!

Author's title

Author*The author of this computation has been verified*
R Software Modulerwasp_autocorrelation.wasp
Title produced by software(Partial) Autocorrelation Function
Date of computationTue, 24 Nov 2009 10:53:19 -0700
Cite this page as followsStatistical Computations at FreeStatistics.org, Office for Research Development and Education, URL https://freestatistics.org/blog/index.php?v=date/2009/Nov/24/t1259085395svtspwmvr5f4br5.htm/, Retrieved Tue, 16 Apr 2024 22:49:16 +0000
Statistical Computations at FreeStatistics.org, Office for Research Development and Education, URL https://freestatistics.org/blog/index.php?pk=59188, Retrieved Tue, 16 Apr 2024 22:49:16 +0000
QR Codes:

Original text written by user:
IsPrivate?No (this computation is public)
User-defined keywords
Estimated Impact163
Family? (F = Feedback message, R = changed R code, M = changed R Module, P = changed Parameters, D = changed Data)
-     [Univariate Explorative Data Analysis] [Run Sequence gebo...] [2008-12-12 13:32:37] [76963dc1903f0f612b6153510a3818cf]
- R  D  [Univariate Explorative Data Analysis] [Run Sequence gebo...] [2008-12-17 12:14:40] [76963dc1903f0f612b6153510a3818cf]
-         [Univariate Explorative Data Analysis] [Run Sequence Plot...] [2008-12-22 18:19:51] [1ce0d16c8f4225c977b42c8fa93bc163]
- RMP       [(Partial) Autocorrelation Function] [Identifying Integ...] [2009-11-22 12:26:39] [b98453cac15ba1066b407e146608df68]
-   PD          [(Partial) Autocorrelation Function] [] [2009-11-24 17:53:19] [7dd0431c761b876151627bfbf92230c8] [Current]
Feedback Forum

Post a new message
Dataseries X:
90398
90269
90390
88219
87032
87175
92603
93571
94118
92159
89528
89955
89587
89488
88521
86587
85159
84915
91378
92729
92194
89664
86285
86858
87184
86629
85220
84816
84831
84957
90951
92134
91790
86625
83324
82719
83614
81640
78665
77828
75728
72187
79357
81329
77304
75576
72932
74291
74988
73302
70483
69848
66466
67610
75091
76207
73454
72008
71362
74250


Summary of computational transaction
Raw Inputview raw input (R code)
Raw Outputview raw output of R engine
Computing time1 seconds
R Server'Gwilym Jenkins' @ 72.249.127.135

\begin{tabular}{lllllllll}
\hline
Summary of computational transaction \tabularnewline
Raw Input & view raw input (R code)  \tabularnewline
Raw Output & view raw output of R engine  \tabularnewline
Computing time & 1 seconds \tabularnewline
R Server & 'Gwilym Jenkins' @ 72.249.127.135 \tabularnewline
\hline
\end{tabular}
%Source: https://freestatistics.org/blog/index.php?pk=59188&T=0

[TABLE]
[ROW][C]Summary of computational transaction[/C][/ROW]
[ROW][C]Raw Input[/C][C]view raw input (R code) [/C][/ROW]
[ROW][C]Raw Output[/C][C]view raw output of R engine [/C][/ROW]
[ROW][C]Computing time[/C][C]1 seconds[/C][/ROW]
[ROW][C]R Server[/C][C]'Gwilym Jenkins' @ 72.249.127.135[/C][/ROW]
[/TABLE]
Source: https://freestatistics.org/blog/index.php?pk=59188&T=0

Globally Unique Identifier (entire table): ba.freestatistics.org/blog/index.php?pk=59188&T=0

As an alternative you can also use a QR Code:  

The GUIDs for individual cells are displayed in the table below:

Summary of computational transaction
Raw Inputview raw input (R code)
Raw Outputview raw output of R engine
Computing time1 seconds
R Server'Gwilym Jenkins' @ 72.249.127.135


Autocorrelation Function
Time lag kACF(k)T-STATP-value
10.1996511.53360.065243
2-0.285103-2.18990.016248
3-0.325974-2.50390.007535
4-0.204735-1.57260.060579
50.1371921.05380.148137
60.2362071.81430.037356
70.0694160.53320.297951
8-0.229051-1.75940.041849
9-0.32796-2.51910.007247
10-0.204204-1.56850.061054
110.2616212.00960.02453
120.6846715.25911e-06
130.0774070.59460.2772
14-0.260856-2.00370.024852
15-0.273833-2.10340.019854
16-0.133326-1.02410.154984
170.1348921.03610.152185
180.1443311.10860.136044
190.0551070.42330.336815
20-0.25978-1.99540.025311
21-0.270238-2.07570.021143
22-0.078474-0.60280.274486
230.1753341.34680.091603
240.4537243.48510.000467
250.0781210.60010.275383
26-0.20422-1.56860.06104
27-0.203975-1.56680.061259
28-0.069218-0.53170.298474
290.1220040.93710.176256
300.1230990.94550.17412
310.0215920.16590.43442
32-0.191208-1.46870.073614
33-0.168951-1.29770.099714
34-0.028518-0.2190.413684
350.1063740.81710.208586
360.2931112.25140.014048

\begin{tabular}{lllllllll}
\hline
Autocorrelation Function \tabularnewline
Time lag k & ACF(k) & T-STAT & P-value \tabularnewline
1 & 0.199651 & 1.5336 & 0.065243 \tabularnewline
2 & -0.285103 & -2.1899 & 0.016248 \tabularnewline
3 & -0.325974 & -2.5039 & 0.007535 \tabularnewline
4 & -0.204735 & -1.5726 & 0.060579 \tabularnewline
5 & 0.137192 & 1.0538 & 0.148137 \tabularnewline
6 & 0.236207 & 1.8143 & 0.037356 \tabularnewline
7 & 0.069416 & 0.5332 & 0.297951 \tabularnewline
8 & -0.229051 & -1.7594 & 0.041849 \tabularnewline
9 & -0.32796 & -2.5191 & 0.007247 \tabularnewline
10 & -0.204204 & -1.5685 & 0.061054 \tabularnewline
11 & 0.261621 & 2.0096 & 0.02453 \tabularnewline
12 & 0.684671 & 5.2591 & 1e-06 \tabularnewline
13 & 0.077407 & 0.5946 & 0.2772 \tabularnewline
14 & -0.260856 & -2.0037 & 0.024852 \tabularnewline
15 & -0.273833 & -2.1034 & 0.019854 \tabularnewline
16 & -0.133326 & -1.0241 & 0.154984 \tabularnewline
17 & 0.134892 & 1.0361 & 0.152185 \tabularnewline
18 & 0.144331 & 1.1086 & 0.136044 \tabularnewline
19 & 0.055107 & 0.4233 & 0.336815 \tabularnewline
20 & -0.25978 & -1.9954 & 0.025311 \tabularnewline
21 & -0.270238 & -2.0757 & 0.021143 \tabularnewline
22 & -0.078474 & -0.6028 & 0.274486 \tabularnewline
23 & 0.175334 & 1.3468 & 0.091603 \tabularnewline
24 & 0.453724 & 3.4851 & 0.000467 \tabularnewline
25 & 0.078121 & 0.6001 & 0.275383 \tabularnewline
26 & -0.20422 & -1.5686 & 0.06104 \tabularnewline
27 & -0.203975 & -1.5668 & 0.061259 \tabularnewline
28 & -0.069218 & -0.5317 & 0.298474 \tabularnewline
29 & 0.122004 & 0.9371 & 0.176256 \tabularnewline
30 & 0.123099 & 0.9455 & 0.17412 \tabularnewline
31 & 0.021592 & 0.1659 & 0.43442 \tabularnewline
32 & -0.191208 & -1.4687 & 0.073614 \tabularnewline
33 & -0.168951 & -1.2977 & 0.099714 \tabularnewline
34 & -0.028518 & -0.219 & 0.413684 \tabularnewline
35 & 0.106374 & 0.8171 & 0.208586 \tabularnewline
36 & 0.293111 & 2.2514 & 0.014048 \tabularnewline
\hline
\end{tabular}
%Source: https://freestatistics.org/blog/index.php?pk=59188&T=1

[TABLE]
[ROW][C]Autocorrelation Function[/C][/ROW]
[ROW][C]Time lag k[/C][C]ACF(k)[/C][C]T-STAT[/C][C]P-value[/C][/ROW]
[ROW][C]1[/C][C]0.199651[/C][C]1.5336[/C][C]0.065243[/C][/ROW]
[ROW][C]2[/C][C]-0.285103[/C][C]-2.1899[/C][C]0.016248[/C][/ROW]
[ROW][C]3[/C][C]-0.325974[/C][C]-2.5039[/C][C]0.007535[/C][/ROW]
[ROW][C]4[/C][C]-0.204735[/C][C]-1.5726[/C][C]0.060579[/C][/ROW]
[ROW][C]5[/C][C]0.137192[/C][C]1.0538[/C][C]0.148137[/C][/ROW]
[ROW][C]6[/C][C]0.236207[/C][C]1.8143[/C][C]0.037356[/C][/ROW]
[ROW][C]7[/C][C]0.069416[/C][C]0.5332[/C][C]0.297951[/C][/ROW]
[ROW][C]8[/C][C]-0.229051[/C][C]-1.7594[/C][C]0.041849[/C][/ROW]
[ROW][C]9[/C][C]-0.32796[/C][C]-2.5191[/C][C]0.007247[/C][/ROW]
[ROW][C]10[/C][C]-0.204204[/C][C]-1.5685[/C][C]0.061054[/C][/ROW]
[ROW][C]11[/C][C]0.261621[/C][C]2.0096[/C][C]0.02453[/C][/ROW]
[ROW][C]12[/C][C]0.684671[/C][C]5.2591[/C][C]1e-06[/C][/ROW]
[ROW][C]13[/C][C]0.077407[/C][C]0.5946[/C][C]0.2772[/C][/ROW]
[ROW][C]14[/C][C]-0.260856[/C][C]-2.0037[/C][C]0.024852[/C][/ROW]
[ROW][C]15[/C][C]-0.273833[/C][C]-2.1034[/C][C]0.019854[/C][/ROW]
[ROW][C]16[/C][C]-0.133326[/C][C]-1.0241[/C][C]0.154984[/C][/ROW]
[ROW][C]17[/C][C]0.134892[/C][C]1.0361[/C][C]0.152185[/C][/ROW]
[ROW][C]18[/C][C]0.144331[/C][C]1.1086[/C][C]0.136044[/C][/ROW]
[ROW][C]19[/C][C]0.055107[/C][C]0.4233[/C][C]0.336815[/C][/ROW]
[ROW][C]20[/C][C]-0.25978[/C][C]-1.9954[/C][C]0.025311[/C][/ROW]
[ROW][C]21[/C][C]-0.270238[/C][C]-2.0757[/C][C]0.021143[/C][/ROW]
[ROW][C]22[/C][C]-0.078474[/C][C]-0.6028[/C][C]0.274486[/C][/ROW]
[ROW][C]23[/C][C]0.175334[/C][C]1.3468[/C][C]0.091603[/C][/ROW]
[ROW][C]24[/C][C]0.453724[/C][C]3.4851[/C][C]0.000467[/C][/ROW]
[ROW][C]25[/C][C]0.078121[/C][C]0.6001[/C][C]0.275383[/C][/ROW]
[ROW][C]26[/C][C]-0.20422[/C][C]-1.5686[/C][C]0.06104[/C][/ROW]
[ROW][C]27[/C][C]-0.203975[/C][C]-1.5668[/C][C]0.061259[/C][/ROW]
[ROW][C]28[/C][C]-0.069218[/C][C]-0.5317[/C][C]0.298474[/C][/ROW]
[ROW][C]29[/C][C]0.122004[/C][C]0.9371[/C][C]0.176256[/C][/ROW]
[ROW][C]30[/C][C]0.123099[/C][C]0.9455[/C][C]0.17412[/C][/ROW]
[ROW][C]31[/C][C]0.021592[/C][C]0.1659[/C][C]0.43442[/C][/ROW]
[ROW][C]32[/C][C]-0.191208[/C][C]-1.4687[/C][C]0.073614[/C][/ROW]
[ROW][C]33[/C][C]-0.168951[/C][C]-1.2977[/C][C]0.099714[/C][/ROW]
[ROW][C]34[/C][C]-0.028518[/C][C]-0.219[/C][C]0.413684[/C][/ROW]
[ROW][C]35[/C][C]0.106374[/C][C]0.8171[/C][C]0.208586[/C][/ROW]
[ROW][C]36[/C][C]0.293111[/C][C]2.2514[/C][C]0.014048[/C][/ROW]
[/TABLE]
Source: https://freestatistics.org/blog/index.php?pk=59188&T=1

Globally Unique Identifier (entire table): ba.freestatistics.org/blog/index.php?pk=59188&T=1

As an alternative you can also use a QR Code:  

The GUIDs for individual cells are displayed in the table below:

Autocorrelation Function
Time lag kACF(k)T-STATP-value
10.1996511.53360.065243
2-0.285103-2.18990.016248
3-0.325974-2.50390.007535
4-0.204735-1.57260.060579
50.1371921.05380.148137
60.2362071.81430.037356
70.0694160.53320.297951
8-0.229051-1.75940.041849
9-0.32796-2.51910.007247
10-0.204204-1.56850.061054
110.2616212.00960.02453
120.6846715.25911e-06
130.0774070.59460.2772
14-0.260856-2.00370.024852
15-0.273833-2.10340.019854
16-0.133326-1.02410.154984
170.1348921.03610.152185
180.1443311.10860.136044
190.0551070.42330.336815
20-0.25978-1.99540.025311
21-0.270238-2.07570.021143
22-0.078474-0.60280.274486
230.1753341.34680.091603
240.4537243.48510.000467
250.0781210.60010.275383
26-0.20422-1.56860.06104
27-0.203975-1.56680.061259
28-0.069218-0.53170.298474
290.1220040.93710.176256
300.1230990.94550.17412
310.0215920.16590.43442
32-0.191208-1.46870.073614
33-0.168951-1.29770.099714
34-0.028518-0.2190.413684
350.1063740.81710.208586
360.2931112.25140.014048


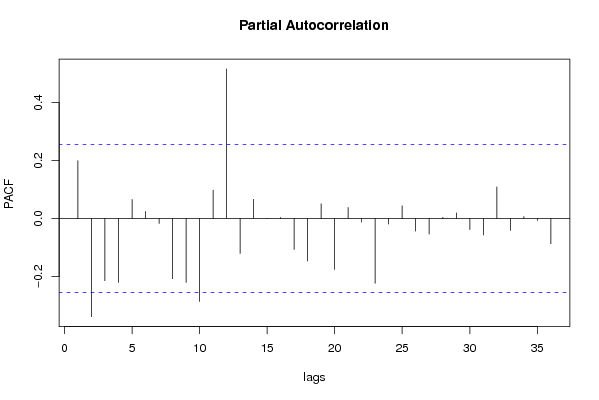
Partial Autocorrelation Function
Time lag kPACF(k)T-STATP-value
10.1996511.53360.065243
2-0.338455-2.59970.005885
3-0.214331-1.64630.052509
4-0.220254-1.69180.04798
50.0656070.50390.30809
60.0245230.18840.425618
7-0.017011-0.13070.448244
8-0.207641-1.59490.058036
9-0.22054-1.6940.047769
10-0.285918-2.19620.016011
110.0979310.75220.227454
120.5161583.96470.000101
13-0.120223-0.92340.179767
140.0664430.51040.305851
15-0.000409-0.00310.498751
160.0039670.03050.487898
17-0.106788-0.82030.207687
18-0.146765-1.12730.132084
190.0506750.38920.349249
20-0.175666-1.34930.091195
210.0381120.29270.385371
22-0.012009-0.09220.463409
23-0.22357-1.71730.045588
24-0.018847-0.14480.442694
250.0439420.33750.368461
26-0.043065-0.33080.370988
27-0.053363-0.40990.341685
280.0041750.03210.487262
290.0192620.1480.441443
30-0.03785-0.29070.386139
31-0.056558-0.43440.332781
320.1091080.83810.202686
33-0.040993-0.31490.376985
340.0070510.05420.478494
35-0.00633-0.04860.480692
36-0.087224-0.670.252742

\begin{tabular}{lllllllll}
\hline
Partial Autocorrelation Function \tabularnewline
Time lag k & PACF(k) & T-STAT & P-value \tabularnewline
1 & 0.199651 & 1.5336 & 0.065243 \tabularnewline
2 & -0.338455 & -2.5997 & 0.005885 \tabularnewline
3 & -0.214331 & -1.6463 & 0.052509 \tabularnewline
4 & -0.220254 & -1.6918 & 0.04798 \tabularnewline
5 & 0.065607 & 0.5039 & 0.30809 \tabularnewline
6 & 0.024523 & 0.1884 & 0.425618 \tabularnewline
7 & -0.017011 & -0.1307 & 0.448244 \tabularnewline
8 & -0.207641 & -1.5949 & 0.058036 \tabularnewline
9 & -0.22054 & -1.694 & 0.047769 \tabularnewline
10 & -0.285918 & -2.1962 & 0.016011 \tabularnewline
11 & 0.097931 & 0.7522 & 0.227454 \tabularnewline
12 & 0.516158 & 3.9647 & 0.000101 \tabularnewline
13 & -0.120223 & -0.9234 & 0.179767 \tabularnewline
14 & 0.066443 & 0.5104 & 0.305851 \tabularnewline
15 & -0.000409 & -0.0031 & 0.498751 \tabularnewline
16 & 0.003967 & 0.0305 & 0.487898 \tabularnewline
17 & -0.106788 & -0.8203 & 0.207687 \tabularnewline
18 & -0.146765 & -1.1273 & 0.132084 \tabularnewline
19 & 0.050675 & 0.3892 & 0.349249 \tabularnewline
20 & -0.175666 & -1.3493 & 0.091195 \tabularnewline
21 & 0.038112 & 0.2927 & 0.385371 \tabularnewline
22 & -0.012009 & -0.0922 & 0.463409 \tabularnewline
23 & -0.22357 & -1.7173 & 0.045588 \tabularnewline
24 & -0.018847 & -0.1448 & 0.442694 \tabularnewline
25 & 0.043942 & 0.3375 & 0.368461 \tabularnewline
26 & -0.043065 & -0.3308 & 0.370988 \tabularnewline
27 & -0.053363 & -0.4099 & 0.341685 \tabularnewline
28 & 0.004175 & 0.0321 & 0.487262 \tabularnewline
29 & 0.019262 & 0.148 & 0.441443 \tabularnewline
30 & -0.03785 & -0.2907 & 0.386139 \tabularnewline
31 & -0.056558 & -0.4344 & 0.332781 \tabularnewline
32 & 0.109108 & 0.8381 & 0.202686 \tabularnewline
33 & -0.040993 & -0.3149 & 0.376985 \tabularnewline
34 & 0.007051 & 0.0542 & 0.478494 \tabularnewline
35 & -0.00633 & -0.0486 & 0.480692 \tabularnewline
36 & -0.087224 & -0.67 & 0.252742 \tabularnewline
\hline
\end{tabular}
%Source: https://freestatistics.org/blog/index.php?pk=59188&T=2

[TABLE]
[ROW][C]Partial Autocorrelation Function[/C][/ROW]
[ROW][C]Time lag k[/C][C]PACF(k)[/C][C]T-STAT[/C][C]P-value[/C][/ROW]
[ROW][C]1[/C][C]0.199651[/C][C]1.5336[/C][C]0.065243[/C][/ROW]
[ROW][C]2[/C][C]-0.338455[/C][C]-2.5997[/C][C]0.005885[/C][/ROW]
[ROW][C]3[/C][C]-0.214331[/C][C]-1.6463[/C][C]0.052509[/C][/ROW]
[ROW][C]4[/C][C]-0.220254[/C][C]-1.6918[/C][C]0.04798[/C][/ROW]
[ROW][C]5[/C][C]0.065607[/C][C]0.5039[/C][C]0.30809[/C][/ROW]
[ROW][C]6[/C][C]0.024523[/C][C]0.1884[/C][C]0.425618[/C][/ROW]
[ROW][C]7[/C][C]-0.017011[/C][C]-0.1307[/C][C]0.448244[/C][/ROW]
[ROW][C]8[/C][C]-0.207641[/C][C]-1.5949[/C][C]0.058036[/C][/ROW]
[ROW][C]9[/C][C]-0.22054[/C][C]-1.694[/C][C]0.047769[/C][/ROW]
[ROW][C]10[/C][C]-0.285918[/C][C]-2.1962[/C][C]0.016011[/C][/ROW]
[ROW][C]11[/C][C]0.097931[/C][C]0.7522[/C][C]0.227454[/C][/ROW]
[ROW][C]12[/C][C]0.516158[/C][C]3.9647[/C][C]0.000101[/C][/ROW]
[ROW][C]13[/C][C]-0.120223[/C][C]-0.9234[/C][C]0.179767[/C][/ROW]
[ROW][C]14[/C][C]0.066443[/C][C]0.5104[/C][C]0.305851[/C][/ROW]
[ROW][C]15[/C][C]-0.000409[/C][C]-0.0031[/C][C]0.498751[/C][/ROW]
[ROW][C]16[/C][C]0.003967[/C][C]0.0305[/C][C]0.487898[/C][/ROW]
[ROW][C]17[/C][C]-0.106788[/C][C]-0.8203[/C][C]0.207687[/C][/ROW]
[ROW][C]18[/C][C]-0.146765[/C][C]-1.1273[/C][C]0.132084[/C][/ROW]
[ROW][C]19[/C][C]0.050675[/C][C]0.3892[/C][C]0.349249[/C][/ROW]
[ROW][C]20[/C][C]-0.175666[/C][C]-1.3493[/C][C]0.091195[/C][/ROW]
[ROW][C]21[/C][C]0.038112[/C][C]0.2927[/C][C]0.385371[/C][/ROW]
[ROW][C]22[/C][C]-0.012009[/C][C]-0.0922[/C][C]0.463409[/C][/ROW]
[ROW][C]23[/C][C]-0.22357[/C][C]-1.7173[/C][C]0.045588[/C][/ROW]
[ROW][C]24[/C][C]-0.018847[/C][C]-0.1448[/C][C]0.442694[/C][/ROW]
[ROW][C]25[/C][C]0.043942[/C][C]0.3375[/C][C]0.368461[/C][/ROW]
[ROW][C]26[/C][C]-0.043065[/C][C]-0.3308[/C][C]0.370988[/C][/ROW]
[ROW][C]27[/C][C]-0.053363[/C][C]-0.4099[/C][C]0.341685[/C][/ROW]
[ROW][C]28[/C][C]0.004175[/C][C]0.0321[/C][C]0.487262[/C][/ROW]
[ROW][C]29[/C][C]0.019262[/C][C]0.148[/C][C]0.441443[/C][/ROW]
[ROW][C]30[/C][C]-0.03785[/C][C]-0.2907[/C][C]0.386139[/C][/ROW]
[ROW][C]31[/C][C]-0.056558[/C][C]-0.4344[/C][C]0.332781[/C][/ROW]
[ROW][C]32[/C][C]0.109108[/C][C]0.8381[/C][C]0.202686[/C][/ROW]
[ROW][C]33[/C][C]-0.040993[/C][C]-0.3149[/C][C]0.376985[/C][/ROW]
[ROW][C]34[/C][C]0.007051[/C][C]0.0542[/C][C]0.478494[/C][/ROW]
[ROW][C]35[/C][C]-0.00633[/C][C]-0.0486[/C][C]0.480692[/C][/ROW]
[ROW][C]36[/C][C]-0.087224[/C][C]-0.67[/C][C]0.252742[/C][/ROW]
[/TABLE]
Source: https://freestatistics.org/blog/index.php?pk=59188&T=2

Globally Unique Identifier (entire table): ba.freestatistics.org/blog/index.php?pk=59188&T=2

As an alternative you can also use a QR Code:  

The GUIDs for individual cells are displayed in the table below:

Partial Autocorrelation Function
Time lag kPACF(k)T-STATP-value
10.1996511.53360.065243
2-0.338455-2.59970.005885
3-0.214331-1.64630.052509
4-0.220254-1.69180.04798
50.0656070.50390.30809
60.0245230.18840.425618
7-0.017011-0.13070.448244
8-0.207641-1.59490.058036
9-0.22054-1.6940.047769
10-0.285918-2.19620.016011
110.0979310.75220.227454
120.5161583.96470.000101
13-0.120223-0.92340.179767
140.0664430.51040.305851
15-0.000409-0.00310.498751
160.0039670.03050.487898
17-0.106788-0.82030.207687
18-0.146765-1.12730.132084
190.0506750.38920.349249
20-0.175666-1.34930.091195
210.0381120.29270.385371
22-0.012009-0.09220.463409
23-0.22357-1.71730.045588
24-0.018847-0.14480.442694
250.0439420.33750.368461
26-0.043065-0.33080.370988
27-0.053363-0.40990.341685
280.0041750.03210.487262
290.0192620.1480.441443
30-0.03785-0.29070.386139
31-0.056558-0.43440.332781
320.1091080.83810.202686
33-0.040993-0.31490.376985
340.0070510.05420.478494
35-0.00633-0.04860.480692
36-0.087224-0.670.252742


Parameters (Session):
par1 = 36 ; par2 = 1 ; par3 = 1 ; par4 = 0 ; par5 = 12 ; par6 = MA ; par7 = 0.95 ;
Parameters (R input):
par1 = 36 ; par2 = 1 ; par3 = 1 ; par4 = 0 ; par5 = 12 ; par6 = MA ; par7 = 0.95 ;
R code (references can be found in the software module):
if (par1 == 'Default') {
par1 = 10*log10(length(x))
} else {
par1 <- as.numeric(par1)
}
par2 <- as.numeric(par2)
par3 <- as.numeric(par3)
par4 <- as.numeric(par4)
par5 <- as.numeric(par5)
if (par6 == 'White Noise') par6 <- 'white' else par6 <- 'ma'
par7 <- as.numeric(par7)
if (par2 == 0) {
x <- log(x)
} else {
x <- (x ^ par2 - 1) / par2
}
if (par3 > 0) x <- diff(x,lag=1,difference=par3)
if (par4 > 0) x <- diff(x,lag=par5,difference=par4)
bitmap(file='pic1.png')
racf <- acf(x, par1, main='Autocorrelation', xlab='time lag', ylab='ACF', ci.type=par6, ci=par7, sub=paste('(lambda=',par2,', d=',par3,', D=',par4,', CI=', par7, ', CI type=',par6,')',sep=''))
dev.off()
bitmap(file='pic2.png')
rpacf <- pacf(x,par1,main='Partial Autocorrelation',xlab='lags',ylab='PACF')
dev.off()
(myacf <- c(racf$acf))
(mypacf <- c(rpacf$acf))
lengthx <- length(x)
sqrtn <- sqrt(lengthx)
load(file='createtable')
a<-table.start()
a<-table.row.start(a)
a<-table.element(a,'Autocorrelation Function',4,TRUE)
a<-table.row.end(a)
a<-table.row.start(a)
a<-table.element(a,'Time lag k',header=TRUE)
a<-table.element(a,hyperlink('basics.htm','ACF(k)','click here for more information about the Autocorrelation Function'),header=TRUE)
a<-table.element(a,'T-STAT',header=TRUE)
a<-table.element(a,'P-value',header=TRUE)
a<-table.row.end(a)
for (i in 2:(par1+1)) {
a<-table.row.start(a)
a<-table.element(a,i-1,header=TRUE)
a<-table.element(a,round(myacf[i],6))
mytstat <- myacf[i]*sqrtn
a<-table.element(a,round(mytstat,4))
a<-table.element(a,round(1-pt(abs(mytstat),lengthx),6))
a<-table.row.end(a)
}
a<-table.end(a)
table.save(a,file='mytable.tab')
a<-table.start()
a<-table.row.start(a)
a<-table.element(a,'Partial Autocorrelation Function',4,TRUE)
a<-table.row.end(a)
a<-table.row.start(a)
a<-table.element(a,'Time lag k',header=TRUE)
a<-table.element(a,hyperlink('basics.htm','PACF(k)','click here for more information about the Partial Autocorrelation Function'),header=TRUE)
a<-table.element(a,'T-STAT',header=TRUE)
a<-table.element(a,'P-value',header=TRUE)
a<-table.row.end(a)
for (i in 1:par1) {
a<-table.row.start(a)
a<-table.element(a,i,header=TRUE)
a<-table.element(a,round(mypacf[i],6))
mytstat <- mypacf[i]*sqrtn
a<-table.element(a,round(mytstat,4))
a<-table.element(a,round(1-pt(abs(mytstat),lengthx),6))
a<-table.row.end(a)
}
a<-table.end(a)
table.save(a,file='mytable1.tab')