Free Statistics

of Irreproducible Research!

Author's title

Author*The author of this computation has been verified*
R Software Modulerwasp_autocorrelation.wasp
Title produced by software(Partial) Autocorrelation Function
Date of computationTue, 24 Nov 2009 10:42:25 -0700
Cite this page as followsStatistical Computations at FreeStatistics.org, Office for Research Development and Education, URL https://freestatistics.org/blog/index.php?v=date/2009/Nov/24/t1259084605e0szbvixq4k6281.htm/, Retrieved Thu, 25 Apr 2024 17:54:33 +0000
Statistical Computations at FreeStatistics.org, Office for Research Development and Education, URL https://freestatistics.org/blog/index.php?pk=59180, Retrieved Thu, 25 Apr 2024 17:54:33 +0000
QR Codes:

Original text written by user:
IsPrivate?No (this computation is public)
User-defined keywords
Estimated Impact111
Family? (F = Feedback message, R = changed R code, M = changed R Module, P = changed Parameters, D = changed Data)
-     [Univariate Explorative Data Analysis] [Run Sequence gebo...] [2008-12-12 13:32:37] [76963dc1903f0f612b6153510a3818cf]
- R  D  [Univariate Explorative Data Analysis] [Run Sequence gebo...] [2008-12-17 12:14:40] [76963dc1903f0f612b6153510a3818cf]
-         [Univariate Explorative Data Analysis] [Run Sequence Plot...] [2008-12-22 18:19:51] [1ce0d16c8f4225c977b42c8fa93bc163]
- RMP       [(Partial) Autocorrelation Function] [Identifying Integ...] [2009-11-22 12:16:10] [b98453cac15ba1066b407e146608df68]
-   PD          [(Partial) Autocorrelation Function] [] [2009-11-24 17:42:25] [7dd0431c761b876151627bfbf92230c8] [Current]
Feedback Forum

Post a new message
Dataseries X:
90398
90269
90390
88219
87032
87175
92603
93571
94118
92159
89528
89955
89587
89488
88521
86587
85159
84915
91378
92729
92194
89664
86285
86858
87184
86629
85220
84816
84831
84957
90951
92134
91790
86625
83324
82719
83614
81640
78665
77828
75728
72187
79357
81329
77304
75576
72932
74291
74988
73302
70483
69848
66466
67610
75091
76207
73454
72008
71362
74250


Summary of computational transaction
Raw Inputview raw input (R code)
Raw Outputview raw output of R engine
Computing time1 seconds
R Server'Gwilym Jenkins' @ 72.249.127.135

\begin{tabular}{lllllllll}
\hline
Summary of computational transaction \tabularnewline
Raw Input & view raw input (R code)  \tabularnewline
Raw Output & view raw output of R engine  \tabularnewline
Computing time & 1 seconds \tabularnewline
R Server & 'Gwilym Jenkins' @ 72.249.127.135 \tabularnewline
\hline
\end{tabular}
%Source: https://freestatistics.org/blog/index.php?pk=59180&T=0

[TABLE]
[ROW][C]Summary of computational transaction[/C][/ROW]
[ROW][C]Raw Input[/C][C]view raw input (R code) [/C][/ROW]
[ROW][C]Raw Output[/C][C]view raw output of R engine [/C][/ROW]
[ROW][C]Computing time[/C][C]1 seconds[/C][/ROW]
[ROW][C]R Server[/C][C]'Gwilym Jenkins' @ 72.249.127.135[/C][/ROW]
[/TABLE]
Source: https://freestatistics.org/blog/index.php?pk=59180&T=0

Globally Unique Identifier (entire table): ba.freestatistics.org/blog/index.php?pk=59180&T=0

As an alternative you can also use a QR Code:  

The GUIDs for individual cells are displayed in the table below:

Summary of computational transaction
Raw Inputview raw input (R code)
Raw Outputview raw output of R engine
Computing time1 seconds
R Server'Gwilym Jenkins' @ 72.249.127.135


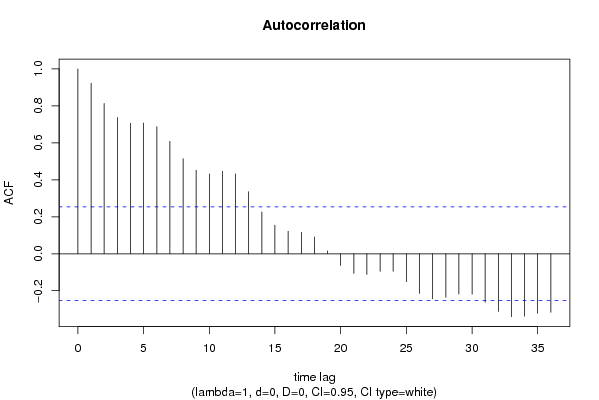
Autocorrelation Function
Time lag kACF(k)T-STATP-value
10.9226047.14650
20.8135336.30160
30.7373985.71190
40.7060135.46880
50.7068675.47540
60.6876475.32651e-06
70.6086894.71497e-06
80.5144973.98539.3e-05
90.4521873.50260.000438
100.4316923.34390.000714
110.4460083.45480.000508
120.4319753.34610.000709
130.3361542.60380.005801
140.2265571.75490.042191
150.1545841.19740.117929
160.1217110.94280.17479
170.1168140.90480.184585
180.0910070.70490.241788
190.014930.11560.45416
20-0.063138-0.48910.31329
21-0.106224-0.82280.206937
22-0.1119-0.86680.194759
23-0.094725-0.73370.232984
24-0.094817-0.73440.232769
25-0.151295-1.17190.122929
26-0.214929-1.66480.05058
27-0.244048-1.89040.031769
28-0.235649-1.82530.036465
29-0.218419-1.69190.04793
30-0.218735-1.69430.047695
31-0.262129-2.03040.023376
32-0.312054-2.41720.009349
33-0.340373-2.63650.005324
34-0.33811-2.6190.005575
35-0.322545-2.49840.007616
36-0.317036-2.45580.008486

\begin{tabular}{lllllllll}
\hline
Autocorrelation Function \tabularnewline
Time lag k & ACF(k) & T-STAT & P-value \tabularnewline
1 & 0.922604 & 7.1465 & 0 \tabularnewline
2 & 0.813533 & 6.3016 & 0 \tabularnewline
3 & 0.737398 & 5.7119 & 0 \tabularnewline
4 & 0.706013 & 5.4688 & 0 \tabularnewline
5 & 0.706867 & 5.4754 & 0 \tabularnewline
6 & 0.687647 & 5.3265 & 1e-06 \tabularnewline
7 & 0.608689 & 4.7149 & 7e-06 \tabularnewline
8 & 0.514497 & 3.9853 & 9.3e-05 \tabularnewline
9 & 0.452187 & 3.5026 & 0.000438 \tabularnewline
10 & 0.431692 & 3.3439 & 0.000714 \tabularnewline
11 & 0.446008 & 3.4548 & 0.000508 \tabularnewline
12 & 0.431975 & 3.3461 & 0.000709 \tabularnewline
13 & 0.336154 & 2.6038 & 0.005801 \tabularnewline
14 & 0.226557 & 1.7549 & 0.042191 \tabularnewline
15 & 0.154584 & 1.1974 & 0.117929 \tabularnewline
16 & 0.121711 & 0.9428 & 0.17479 \tabularnewline
17 & 0.116814 & 0.9048 & 0.184585 \tabularnewline
18 & 0.091007 & 0.7049 & 0.241788 \tabularnewline
19 & 0.01493 & 0.1156 & 0.45416 \tabularnewline
20 & -0.063138 & -0.4891 & 0.31329 \tabularnewline
21 & -0.106224 & -0.8228 & 0.206937 \tabularnewline
22 & -0.1119 & -0.8668 & 0.194759 \tabularnewline
23 & -0.094725 & -0.7337 & 0.232984 \tabularnewline
24 & -0.094817 & -0.7344 & 0.232769 \tabularnewline
25 & -0.151295 & -1.1719 & 0.122929 \tabularnewline
26 & -0.214929 & -1.6648 & 0.05058 \tabularnewline
27 & -0.244048 & -1.8904 & 0.031769 \tabularnewline
28 & -0.235649 & -1.8253 & 0.036465 \tabularnewline
29 & -0.218419 & -1.6919 & 0.04793 \tabularnewline
30 & -0.218735 & -1.6943 & 0.047695 \tabularnewline
31 & -0.262129 & -2.0304 & 0.023376 \tabularnewline
32 & -0.312054 & -2.4172 & 0.009349 \tabularnewline
33 & -0.340373 & -2.6365 & 0.005324 \tabularnewline
34 & -0.33811 & -2.619 & 0.005575 \tabularnewline
35 & -0.322545 & -2.4984 & 0.007616 \tabularnewline
36 & -0.317036 & -2.4558 & 0.008486 \tabularnewline
\hline
\end{tabular}
%Source: https://freestatistics.org/blog/index.php?pk=59180&T=1

[TABLE]
[ROW][C]Autocorrelation Function[/C][/ROW]
[ROW][C]Time lag k[/C][C]ACF(k)[/C][C]T-STAT[/C][C]P-value[/C][/ROW]
[ROW][C]1[/C][C]0.922604[/C][C]7.1465[/C][C]0[/C][/ROW]
[ROW][C]2[/C][C]0.813533[/C][C]6.3016[/C][C]0[/C][/ROW]
[ROW][C]3[/C][C]0.737398[/C][C]5.7119[/C][C]0[/C][/ROW]
[ROW][C]4[/C][C]0.706013[/C][C]5.4688[/C][C]0[/C][/ROW]
[ROW][C]5[/C][C]0.706867[/C][C]5.4754[/C][C]0[/C][/ROW]
[ROW][C]6[/C][C]0.687647[/C][C]5.3265[/C][C]1e-06[/C][/ROW]
[ROW][C]7[/C][C]0.608689[/C][C]4.7149[/C][C]7e-06[/C][/ROW]
[ROW][C]8[/C][C]0.514497[/C][C]3.9853[/C][C]9.3e-05[/C][/ROW]
[ROW][C]9[/C][C]0.452187[/C][C]3.5026[/C][C]0.000438[/C][/ROW]
[ROW][C]10[/C][C]0.431692[/C][C]3.3439[/C][C]0.000714[/C][/ROW]
[ROW][C]11[/C][C]0.446008[/C][C]3.4548[/C][C]0.000508[/C][/ROW]
[ROW][C]12[/C][C]0.431975[/C][C]3.3461[/C][C]0.000709[/C][/ROW]
[ROW][C]13[/C][C]0.336154[/C][C]2.6038[/C][C]0.005801[/C][/ROW]
[ROW][C]14[/C][C]0.226557[/C][C]1.7549[/C][C]0.042191[/C][/ROW]
[ROW][C]15[/C][C]0.154584[/C][C]1.1974[/C][C]0.117929[/C][/ROW]
[ROW][C]16[/C][C]0.121711[/C][C]0.9428[/C][C]0.17479[/C][/ROW]
[ROW][C]17[/C][C]0.116814[/C][C]0.9048[/C][C]0.184585[/C][/ROW]
[ROW][C]18[/C][C]0.091007[/C][C]0.7049[/C][C]0.241788[/C][/ROW]
[ROW][C]19[/C][C]0.01493[/C][C]0.1156[/C][C]0.45416[/C][/ROW]
[ROW][C]20[/C][C]-0.063138[/C][C]-0.4891[/C][C]0.31329[/C][/ROW]
[ROW][C]21[/C][C]-0.106224[/C][C]-0.8228[/C][C]0.206937[/C][/ROW]
[ROW][C]22[/C][C]-0.1119[/C][C]-0.8668[/C][C]0.194759[/C][/ROW]
[ROW][C]23[/C][C]-0.094725[/C][C]-0.7337[/C][C]0.232984[/C][/ROW]
[ROW][C]24[/C][C]-0.094817[/C][C]-0.7344[/C][C]0.232769[/C][/ROW]
[ROW][C]25[/C][C]-0.151295[/C][C]-1.1719[/C][C]0.122929[/C][/ROW]
[ROW][C]26[/C][C]-0.214929[/C][C]-1.6648[/C][C]0.05058[/C][/ROW]
[ROW][C]27[/C][C]-0.244048[/C][C]-1.8904[/C][C]0.031769[/C][/ROW]
[ROW][C]28[/C][C]-0.235649[/C][C]-1.8253[/C][C]0.036465[/C][/ROW]
[ROW][C]29[/C][C]-0.218419[/C][C]-1.6919[/C][C]0.04793[/C][/ROW]
[ROW][C]30[/C][C]-0.218735[/C][C]-1.6943[/C][C]0.047695[/C][/ROW]
[ROW][C]31[/C][C]-0.262129[/C][C]-2.0304[/C][C]0.023376[/C][/ROW]
[ROW][C]32[/C][C]-0.312054[/C][C]-2.4172[/C][C]0.009349[/C][/ROW]
[ROW][C]33[/C][C]-0.340373[/C][C]-2.6365[/C][C]0.005324[/C][/ROW]
[ROW][C]34[/C][C]-0.33811[/C][C]-2.619[/C][C]0.005575[/C][/ROW]
[ROW][C]35[/C][C]-0.322545[/C][C]-2.4984[/C][C]0.007616[/C][/ROW]
[ROW][C]36[/C][C]-0.317036[/C][C]-2.4558[/C][C]0.008486[/C][/ROW]
[/TABLE]
Source: https://freestatistics.org/blog/index.php?pk=59180&T=1

Globally Unique Identifier (entire table): ba.freestatistics.org/blog/index.php?pk=59180&T=1

As an alternative you can also use a QR Code:  

The GUIDs for individual cells are displayed in the table below:

Autocorrelation Function
Time lag kACF(k)T-STATP-value
10.9226047.14650
20.8135336.30160
30.7373985.71190
40.7060135.46880
50.7068675.47540
60.6876475.32651e-06
70.6086894.71497e-06
80.5144973.98539.3e-05
90.4521873.50260.000438
100.4316923.34390.000714
110.4460083.45480.000508
120.4319753.34610.000709
130.3361542.60380.005801
140.2265571.75490.042191
150.1545841.19740.117929
160.1217110.94280.17479
170.1168140.90480.184585
180.0910070.70490.241788
190.014930.11560.45416
20-0.063138-0.48910.31329
21-0.106224-0.82280.206937
22-0.1119-0.86680.194759
23-0.094725-0.73370.232984
24-0.094817-0.73440.232769
25-0.151295-1.17190.122929
26-0.214929-1.66480.05058
27-0.244048-1.89040.031769
28-0.235649-1.82530.036465
29-0.218419-1.69190.04793
30-0.218735-1.69430.047695
31-0.262129-2.03040.023376
32-0.312054-2.41720.009349
33-0.340373-2.63650.005324
34-0.33811-2.6190.005575
35-0.322545-2.49840.007616
36-0.317036-2.45580.008486


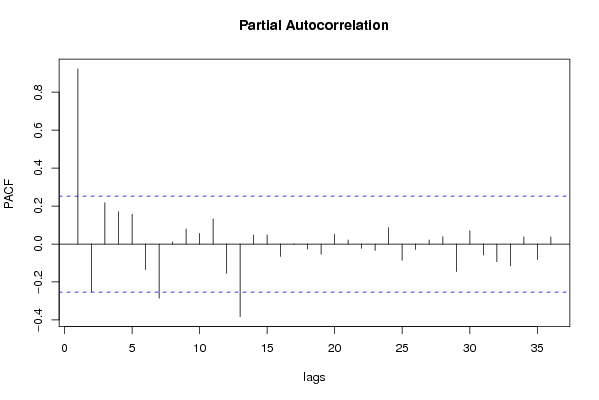
Partial Autocorrelation Function
Time lag kPACF(k)T-STATP-value
10.9226047.14650
2-0.253124-1.96070.027281
30.2181051.68940.048164
40.1704581.32040.095864
50.1572541.21810.11398
6-0.134433-1.04130.150954
7-0.285361-2.21040.015451
80.0112780.08740.465338
90.0790690.61250.271273
100.0560950.43450.332739
110.1322831.02470.154818
12-0.154616-1.19770.117881
13-0.382749-2.96480.002171
140.0471020.36490.358252
150.0482490.37370.354959
16-0.06577-0.50950.306151
170.0009850.00760.49697
18-0.026717-0.20690.418376
19-0.054379-0.42120.337551
200.052180.40420.343758
210.0216080.16740.433818
22-0.022357-0.17320.431549
23-0.033915-0.26270.396838
240.0866860.67150.252251
25-0.085686-0.66370.254706
26-0.029441-0.2280.410193
270.0216610.16780.433658
280.0385820.29890.383043
29-0.145197-1.12470.132599
300.0701030.5430.294566
31-0.057902-0.44850.327702
32-0.092899-0.71960.237286
33-0.114843-0.88960.188626
340.0374810.29030.386284
35-0.081096-0.62820.266138
360.0372320.28840.387017

\begin{tabular}{lllllllll}
\hline
Partial Autocorrelation Function \tabularnewline
Time lag k & PACF(k) & T-STAT & P-value \tabularnewline
1 & 0.922604 & 7.1465 & 0 \tabularnewline
2 & -0.253124 & -1.9607 & 0.027281 \tabularnewline
3 & 0.218105 & 1.6894 & 0.048164 \tabularnewline
4 & 0.170458 & 1.3204 & 0.095864 \tabularnewline
5 & 0.157254 & 1.2181 & 0.11398 \tabularnewline
6 & -0.134433 & -1.0413 & 0.150954 \tabularnewline
7 & -0.285361 & -2.2104 & 0.015451 \tabularnewline
8 & 0.011278 & 0.0874 & 0.465338 \tabularnewline
9 & 0.079069 & 0.6125 & 0.271273 \tabularnewline
10 & 0.056095 & 0.4345 & 0.332739 \tabularnewline
11 & 0.132283 & 1.0247 & 0.154818 \tabularnewline
12 & -0.154616 & -1.1977 & 0.117881 \tabularnewline
13 & -0.382749 & -2.9648 & 0.002171 \tabularnewline
14 & 0.047102 & 0.3649 & 0.358252 \tabularnewline
15 & 0.048249 & 0.3737 & 0.354959 \tabularnewline
16 & -0.06577 & -0.5095 & 0.306151 \tabularnewline
17 & 0.000985 & 0.0076 & 0.49697 \tabularnewline
18 & -0.026717 & -0.2069 & 0.418376 \tabularnewline
19 & -0.054379 & -0.4212 & 0.337551 \tabularnewline
20 & 0.05218 & 0.4042 & 0.343758 \tabularnewline
21 & 0.021608 & 0.1674 & 0.433818 \tabularnewline
22 & -0.022357 & -0.1732 & 0.431549 \tabularnewline
23 & -0.033915 & -0.2627 & 0.396838 \tabularnewline
24 & 0.086686 & 0.6715 & 0.252251 \tabularnewline
25 & -0.085686 & -0.6637 & 0.254706 \tabularnewline
26 & -0.029441 & -0.228 & 0.410193 \tabularnewline
27 & 0.021661 & 0.1678 & 0.433658 \tabularnewline
28 & 0.038582 & 0.2989 & 0.383043 \tabularnewline
29 & -0.145197 & -1.1247 & 0.132599 \tabularnewline
30 & 0.070103 & 0.543 & 0.294566 \tabularnewline
31 & -0.057902 & -0.4485 & 0.327702 \tabularnewline
32 & -0.092899 & -0.7196 & 0.237286 \tabularnewline
33 & -0.114843 & -0.8896 & 0.188626 \tabularnewline
34 & 0.037481 & 0.2903 & 0.386284 \tabularnewline
35 & -0.081096 & -0.6282 & 0.266138 \tabularnewline
36 & 0.037232 & 0.2884 & 0.387017 \tabularnewline
\hline
\end{tabular}
%Source: https://freestatistics.org/blog/index.php?pk=59180&T=2

[TABLE]
[ROW][C]Partial Autocorrelation Function[/C][/ROW]
[ROW][C]Time lag k[/C][C]PACF(k)[/C][C]T-STAT[/C][C]P-value[/C][/ROW]
[ROW][C]1[/C][C]0.922604[/C][C]7.1465[/C][C]0[/C][/ROW]
[ROW][C]2[/C][C]-0.253124[/C][C]-1.9607[/C][C]0.027281[/C][/ROW]
[ROW][C]3[/C][C]0.218105[/C][C]1.6894[/C][C]0.048164[/C][/ROW]
[ROW][C]4[/C][C]0.170458[/C][C]1.3204[/C][C]0.095864[/C][/ROW]
[ROW][C]5[/C][C]0.157254[/C][C]1.2181[/C][C]0.11398[/C][/ROW]
[ROW][C]6[/C][C]-0.134433[/C][C]-1.0413[/C][C]0.150954[/C][/ROW]
[ROW][C]7[/C][C]-0.285361[/C][C]-2.2104[/C][C]0.015451[/C][/ROW]
[ROW][C]8[/C][C]0.011278[/C][C]0.0874[/C][C]0.465338[/C][/ROW]
[ROW][C]9[/C][C]0.079069[/C][C]0.6125[/C][C]0.271273[/C][/ROW]
[ROW][C]10[/C][C]0.056095[/C][C]0.4345[/C][C]0.332739[/C][/ROW]
[ROW][C]11[/C][C]0.132283[/C][C]1.0247[/C][C]0.154818[/C][/ROW]
[ROW][C]12[/C][C]-0.154616[/C][C]-1.1977[/C][C]0.117881[/C][/ROW]
[ROW][C]13[/C][C]-0.382749[/C][C]-2.9648[/C][C]0.002171[/C][/ROW]
[ROW][C]14[/C][C]0.047102[/C][C]0.3649[/C][C]0.358252[/C][/ROW]
[ROW][C]15[/C][C]0.048249[/C][C]0.3737[/C][C]0.354959[/C][/ROW]
[ROW][C]16[/C][C]-0.06577[/C][C]-0.5095[/C][C]0.306151[/C][/ROW]
[ROW][C]17[/C][C]0.000985[/C][C]0.0076[/C][C]0.49697[/C][/ROW]
[ROW][C]18[/C][C]-0.026717[/C][C]-0.2069[/C][C]0.418376[/C][/ROW]
[ROW][C]19[/C][C]-0.054379[/C][C]-0.4212[/C][C]0.337551[/C][/ROW]
[ROW][C]20[/C][C]0.05218[/C][C]0.4042[/C][C]0.343758[/C][/ROW]
[ROW][C]21[/C][C]0.021608[/C][C]0.1674[/C][C]0.433818[/C][/ROW]
[ROW][C]22[/C][C]-0.022357[/C][C]-0.1732[/C][C]0.431549[/C][/ROW]
[ROW][C]23[/C][C]-0.033915[/C][C]-0.2627[/C][C]0.396838[/C][/ROW]
[ROW][C]24[/C][C]0.086686[/C][C]0.6715[/C][C]0.252251[/C][/ROW]
[ROW][C]25[/C][C]-0.085686[/C][C]-0.6637[/C][C]0.254706[/C][/ROW]
[ROW][C]26[/C][C]-0.029441[/C][C]-0.228[/C][C]0.410193[/C][/ROW]
[ROW][C]27[/C][C]0.021661[/C][C]0.1678[/C][C]0.433658[/C][/ROW]
[ROW][C]28[/C][C]0.038582[/C][C]0.2989[/C][C]0.383043[/C][/ROW]
[ROW][C]29[/C][C]-0.145197[/C][C]-1.1247[/C][C]0.132599[/C][/ROW]
[ROW][C]30[/C][C]0.070103[/C][C]0.543[/C][C]0.294566[/C][/ROW]
[ROW][C]31[/C][C]-0.057902[/C][C]-0.4485[/C][C]0.327702[/C][/ROW]
[ROW][C]32[/C][C]-0.092899[/C][C]-0.7196[/C][C]0.237286[/C][/ROW]
[ROW][C]33[/C][C]-0.114843[/C][C]-0.8896[/C][C]0.188626[/C][/ROW]
[ROW][C]34[/C][C]0.037481[/C][C]0.2903[/C][C]0.386284[/C][/ROW]
[ROW][C]35[/C][C]-0.081096[/C][C]-0.6282[/C][C]0.266138[/C][/ROW]
[ROW][C]36[/C][C]0.037232[/C][C]0.2884[/C][C]0.387017[/C][/ROW]
[/TABLE]
Source: https://freestatistics.org/blog/index.php?pk=59180&T=2

Globally Unique Identifier (entire table): ba.freestatistics.org/blog/index.php?pk=59180&T=2

As an alternative you can also use a QR Code:  

The GUIDs for individual cells are displayed in the table below:

Partial Autocorrelation Function
Time lag kPACF(k)T-STATP-value
10.9226047.14650
2-0.253124-1.96070.027281
30.2181051.68940.048164
40.1704581.32040.095864
50.1572541.21810.11398
6-0.134433-1.04130.150954
7-0.285361-2.21040.015451
80.0112780.08740.465338
90.0790690.61250.271273
100.0560950.43450.332739
110.1322831.02470.154818
12-0.154616-1.19770.117881
13-0.382749-2.96480.002171
140.0471020.36490.358252
150.0482490.37370.354959
16-0.06577-0.50950.306151
170.0009850.00760.49697
18-0.026717-0.20690.418376
19-0.054379-0.42120.337551
200.052180.40420.343758
210.0216080.16740.433818
22-0.022357-0.17320.431549
23-0.033915-0.26270.396838
240.0866860.67150.252251
25-0.085686-0.66370.254706
26-0.029441-0.2280.410193
270.0216610.16780.433658
280.0385820.29890.383043
29-0.145197-1.12470.132599
300.0701030.5430.294566
31-0.057902-0.44850.327702
32-0.092899-0.71960.237286
33-0.114843-0.88960.188626
340.0374810.29030.386284
35-0.081096-0.62820.266138
360.0372320.28840.387017


Parameters (Session):
par1 = 36 ; par2 = 1 ; par3 = 0 ; par4 = 0 ; par5 = 12 ; par6 = White Noise ; par7 = 0.95 ;
Parameters (R input):
par1 = 36 ; par2 = 1 ; par3 = 0 ; par4 = 0 ; par5 = 12 ; par6 = White Noise ; par7 = 0.95 ;
R code (references can be found in the software module):
if (par1 == 'Default') {
par1 = 10*log10(length(x))
} else {
par1 <- as.numeric(par1)
}
par2 <- as.numeric(par2)
par3 <- as.numeric(par3)
par4 <- as.numeric(par4)
par5 <- as.numeric(par5)
if (par6 == 'White Noise') par6 <- 'white' else par6 <- 'ma'
par7 <- as.numeric(par7)
if (par2 == 0) {
x <- log(x)
} else {
x <- (x ^ par2 - 1) / par2
}
if (par3 > 0) x <- diff(x,lag=1,difference=par3)
if (par4 > 0) x <- diff(x,lag=par5,difference=par4)
bitmap(file='pic1.png')
racf <- acf(x, par1, main='Autocorrelation', xlab='time lag', ylab='ACF', ci.type=par6, ci=par7, sub=paste('(lambda=',par2,', d=',par3,', D=',par4,', CI=', par7, ', CI type=',par6,')',sep=''))
dev.off()
bitmap(file='pic2.png')
rpacf <- pacf(x,par1,main='Partial Autocorrelation',xlab='lags',ylab='PACF')
dev.off()
(myacf <- c(racf$acf))
(mypacf <- c(rpacf$acf))
lengthx <- length(x)
sqrtn <- sqrt(lengthx)
load(file='createtable')
a<-table.start()
a<-table.row.start(a)
a<-table.element(a,'Autocorrelation Function',4,TRUE)
a<-table.row.end(a)
a<-table.row.start(a)
a<-table.element(a,'Time lag k',header=TRUE)
a<-table.element(a,hyperlink('basics.htm','ACF(k)','click here for more information about the Autocorrelation Function'),header=TRUE)
a<-table.element(a,'T-STAT',header=TRUE)
a<-table.element(a,'P-value',header=TRUE)
a<-table.row.end(a)
for (i in 2:(par1+1)) {
a<-table.row.start(a)
a<-table.element(a,i-1,header=TRUE)
a<-table.element(a,round(myacf[i],6))
mytstat <- myacf[i]*sqrtn
a<-table.element(a,round(mytstat,4))
a<-table.element(a,round(1-pt(abs(mytstat),lengthx),6))
a<-table.row.end(a)
}
a<-table.end(a)
table.save(a,file='mytable.tab')
a<-table.start()
a<-table.row.start(a)
a<-table.element(a,'Partial Autocorrelation Function',4,TRUE)
a<-table.row.end(a)
a<-table.row.start(a)
a<-table.element(a,'Time lag k',header=TRUE)
a<-table.element(a,hyperlink('basics.htm','PACF(k)','click here for more information about the Partial Autocorrelation Function'),header=TRUE)
a<-table.element(a,'T-STAT',header=TRUE)
a<-table.element(a,'P-value',header=TRUE)
a<-table.row.end(a)
for (i in 1:par1) {
a<-table.row.start(a)
a<-table.element(a,i,header=TRUE)
a<-table.element(a,round(mypacf[i],6))
mytstat <- mypacf[i]*sqrtn
a<-table.element(a,round(mytstat,4))
a<-table.element(a,round(1-pt(abs(mytstat),lengthx),6))
a<-table.row.end(a)
}
a<-table.end(a)
table.save(a,file='mytable1.tab')