Free Statistics
of Irreproducible Research!
Description of Statistical Computation | |||||||||||||||||||||||||||||||||||||||||
|---|---|---|---|---|---|---|---|---|---|---|---|---|---|---|---|---|---|---|---|---|---|---|---|---|---|---|---|---|---|---|---|---|---|---|---|---|---|---|---|---|---|
| Author's title | |||||||||||||||||||||||||||||||||||||||||
| Author | *The author of this computation has been verified* | ||||||||||||||||||||||||||||||||||||||||
| R Software Module | rwasp_univariatedataseries.wasp | ||||||||||||||||||||||||||||||||||||||||
| Title produced by software | Univariate Data Series | ||||||||||||||||||||||||||||||||||||||||
| Date of computation | Tue, 24 Nov 2009 10:23:40 -0700 | ||||||||||||||||||||||||||||||||||||||||
| Cite this page as follows | Statistical Computations at FreeStatistics.org, Office for Research Development and Education, URL https://freestatistics.org/blog/index.php?v=date/2009/Nov/24/t1259083485va6p3p3rsz2f4va.htm/, Retrieved Fri, 19 Apr 2024 10:19:45 +0000 | ||||||||||||||||||||||||||||||||||||||||
| Statistical Computations at FreeStatistics.org, Office for Research Development and Education, URL https://freestatistics.org/blog/index.php?pk=59175, Retrieved Fri, 19 Apr 2024 10:19:45 +0000 | |||||||||||||||||||||||||||||||||||||||||
| QR Codes: | |||||||||||||||||||||||||||||||||||||||||
|
| |||||||||||||||||||||||||||||||||||||||||
| Original text written by user: | |||||||||||||||||||||||||||||||||||||||||
| IsPrivate? | No (this computation is public) | ||||||||||||||||||||||||||||||||||||||||
| User-defined keywords | |||||||||||||||||||||||||||||||||||||||||
| Estimated Impact | 288 | ||||||||||||||||||||||||||||||||||||||||
Tree of Dependent Computations | |||||||||||||||||||||||||||||||||||||||||
| Family? (F = Feedback message, R = changed R code, M = changed R Module, P = changed Parameters, D = changed Data) | |||||||||||||||||||||||||||||||||||||||||
| - [Univariate Explorative Data Analysis] [Run Sequence gebo...] [2008-12-12 13:32:37] [76963dc1903f0f612b6153510a3818cf] - R D [Univariate Explorative Data Analysis] [Run Sequence gebo...] [2008-12-17 12:14:40] [76963dc1903f0f612b6153510a3818cf] - [Univariate Explorative Data Analysis] [Run Sequence Plot...] [2008-12-22 18:19:51] [1ce0d16c8f4225c977b42c8fa93bc163] - RMP [Univariate Data Series] [Identifying Integ...] [2009-11-22 12:08:06] [b98453cac15ba1066b407e146608df68] - PD [Univariate Data Series] [Totaal Werkzoeken...] [2009-11-24 16:54:07] [ee7c2e7343f5b1451e62c5c16ec521f1] - P [Univariate Data Series] [Totaal Werkzoeken...] [2009-11-24 17:23:40] [acc980be4047884b6edd254cd7beb9fa] [Current] - PD [Univariate Data Series] [] [2009-11-26 08:09:58] [5edbdb7a459c4059b6c3b063ba86821c] - RMPD [(Partial) Autocorrelation Function] [] [2009-11-26 08:57:08] [5edbdb7a459c4059b6c3b063ba86821c] - P [(Partial) Autocorrelation Function] [] [2009-11-26 09:27:18] [5edbdb7a459c4059b6c3b063ba86821c] - P [(Partial) Autocorrelation Function] [] [2009-11-26 10:12:32] [5edbdb7a459c4059b6c3b063ba86821c] - D [(Partial) Autocorrelation Function] [] [2009-12-18 11:02:34] [5edbdb7a459c4059b6c3b063ba86821c] - RMP [Spectral Analysis] [] [2009-11-26 10:31:07] [5edbdb7a459c4059b6c3b063ba86821c] - [Spectral Analysis] [] [2009-11-26 10:38:09] [5edbdb7a459c4059b6c3b063ba86821c] - P [Spectral Analysis] [] [2009-12-12 14:04:21] [5edbdb7a459c4059b6c3b063ba86821c] - [Spectral Analysis] [] [2009-12-12 14:08:32] [5edbdb7a459c4059b6c3b063ba86821c] - D [Spectral Analysis] [] [2009-12-12 14:15:09] [5edbdb7a459c4059b6c3b063ba86821c] - PD [Spectral Analysis] [] [2009-12-12 16:40:17] [5edbdb7a459c4059b6c3b063ba86821c] - PD [Spectral Analysis] [] [2009-12-12 16:55:32] [5edbdb7a459c4059b6c3b063ba86821c] - P [Spectral Analysis] [] [2009-12-18 10:36:19] [5edbdb7a459c4059b6c3b063ba86821c] - RMP [ARIMA Forecasting] [] [2009-12-18 11:38:59] [5edbdb7a459c4059b6c3b063ba86821c] - RMPD [ARIMA Forecasting] [] [2009-12-18 13:22:49] [5edbdb7a459c4059b6c3b063ba86821c] - [ARIMA Forecasting] [] [2009-12-18 13:28:02] [5edbdb7a459c4059b6c3b063ba86821c] - RM [Standard Deviation-Mean Plot] [] [2009-11-26 10:49:12] [5edbdb7a459c4059b6c3b063ba86821c] - D [(Partial) Autocorrelation Function] [] [2009-12-12 16:20:04] [5edbdb7a459c4059b6c3b063ba86821c] - PD [Univariate Data Series] [Gebruikte Tijdsreeks] [2009-11-26 18:49:28] [9fd30b3a0bda28c32b5ce5483ba9a3b1] - PD [Univariate Data Series] [Indexcijfers van ...] [2009-11-27 11:43:57] [76ab39dc7a55316678260825bd5ad46c] - D [Univariate Data Series] [tijdreeks] [2009-11-27 20:16:51] [4b453aa14d54730625f8d3de5f1f6d82] - PD [Univariate Data Series] [Univariate data-a...] [2009-12-20 22:08:48] [76ab39dc7a55316678260825bd5ad46c] - PD [Univariate Data Series] [] [2009-12-04 16:45:53] [b7349fb284cae6f1172638396d27b11f] - PD [Univariate Data Series] [] [2009-12-06 12:40:12] [f57b281e621ed7dff28b90886f5aa97c] - RMP [ARIMA Forecasting] [] [2009-12-11 11:25:10] [f57b281e621ed7dff28b90886f5aa97c] - [ARIMA Forecasting] [] [2009-12-11 11:37:19] [1eac2882020791f6c49a90a91c34285a] - PD [Univariate Data Series] [Totale industrië...] [2010-12-18 09:14:16] [0ed8ad64bdfc801eaa95d5097964fc04] - R PD [Univariate Data Series] [Totale industrië...] [2010-12-18 09:20:54] [0ed8ad64bdfc801eaa95d5097964fc04] - RMPD [Standard Deviation-Mean Plot] [] [2009-12-04 16:55:13] [b7349fb284cae6f1172638396d27b11f] - RMPD [(Partial) Autocorrelation Function] [] [2009-12-04 17:17:00] [b7349fb284cae6f1172638396d27b11f] - RMPD [ARIMA Backward Selection] [] [2009-12-06 14:02:41] [f57b281e621ed7dff28b90886f5aa97c] - D [(Partial) Autocorrelation Function] [Paper] [2010-12-26 15:30:57] [24bb5b06bd1854f48aebec8f44957ed0] - RMPD [ARIMA Backward Selection] [] [2009-12-04 17:37:52] [b7349fb284cae6f1172638396d27b11f] - D [ARIMA Backward Selection] [] [2009-12-06 10:06:55] [1eac2882020791f6c49a90a91c34285a] - R P [Univariate Data Series] [] [2009-12-04 21:22:59] [859f65298c93b90426725427c75f8582] - PD [Univariate Data Series] [] [2009-12-20 18:01:51] [a3c75f2af6eea9d676b2dadad1cedbf1] - R PD [Univariate Data Series] [] [2009-12-19 15:20:36] [a3c75f2af6eea9d676b2dadad1cedbf1] | |||||||||||||||||||||||||||||||||||||||||
| Feedback Forum | |||||||||||||||||||||||||||||||||||||||||
Post a new message | |||||||||||||||||||||||||||||||||||||||||
Dataset | |||||||||||||||||||||||||||||||||||||||||
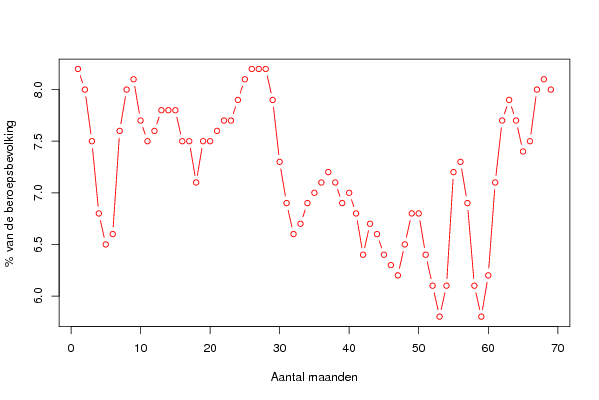
| Dataseries X: | |||||||||||||||||||||||||||||||||||||||||
8.2 8 7.5 6.8 6.5 6.6 7.6 8 8.1 7.7 7.5 7.6 7.8 7.8 7.8 7.5 7.5 7.1 7.5 7.5 7.6 7.7 7.7 7.9 8.1 8.2 8.2 8.2 7.9 7.3 6.9 6.6 6.7 6.9 7 7.1 7.2 7.1 6.9 7 6.8 6.4 6.7 6.6 6.4 6.3 6.2 6.5 6.8 6.8 6.4 6.1 5.8 6.1 7.2 7.3 6.9 6.1 5.8 6.2 7.1 7.7 7.9 7.7 7.4 7.5 8 8.1 8 | |||||||||||||||||||||||||||||||||||||||||
Tables (Output of Computation) | |||||||||||||||||||||||||||||||||||||||||
| |||||||||||||||||||||||||||||||||||||||||
Figures (Output of Computation) | |||||||||||||||||||||||||||||||||||||||||
Input Parameters & R Code | |||||||||||||||||||||||||||||||||||||||||
| Parameters (Session): | |||||||||||||||||||||||||||||||||||||||||
| par1 = TWM ; par2 = Belgostat ; par3 = Totaal Werkzoekende Mannen (uitgedrukt in % van de totale beroepsbevolking) ; | |||||||||||||||||||||||||||||||||||||||||
| Parameters (R input): | |||||||||||||||||||||||||||||||||||||||||
| par1 = TWM ; par2 = Belgostat ; par3 = Totaal Werkzoekende Mannen (uitgedrukt in % van de totale beroepsbevolking) ; | |||||||||||||||||||||||||||||||||||||||||
| R code (references can be found in the software module): | |||||||||||||||||||||||||||||||||||||||||
bitmap(file='test1.png') | |||||||||||||||||||||||||||||||||||||||||