| Multiple Linear Regression - Estimated Regression Equation |
| ipchn[t] = -22.3389173229912 + 0.832240299372395Tip[t] + 0.254189299923941`y(t-1)`[t] + 0.234683807228363`y(t-2)`[t] -0.0702121144545338M1[t] -2.16350805662868M2[t] -2.81444431776765M3[t] -5.41334542375707M4[t] + 14.6770191833725M5[t] + 2.36848127661478M6[t] -5.65462648983423M7[t] -7.37323493898212M8[t] -4.1666523610624M9[t] + 4.95764267217371M10[t] + 3.66500467191191M11[t] -0.151732055011969t + e[t] |
| Multiple Linear Regression - Ordinary Least Squares | |||||
| Variable | Parameter | S.D. | T-STAT H0: parameter = 0 | 2-tail p-value | 1-tail p-value |
| (Intercept) | -22.3389173229912 | 26.834303 | -0.8325 | 0.409849 | 0.204925 |
| Tip | 0.832240299372395 | 0.199177 | 4.1784 | 0.000145 | 7.3e-05 |
| `y(t-1)` | 0.254189299923941 | 0.127779 | 1.9893 | 0.053208 | 0.026604 |
| `y(t-2)` | 0.234683807228363 | 0.128752 | 1.8228 | 0.075464 | 0.037732 |
| M1 | -0.0702121144545338 | 3.98167 | -0.0176 | 0.986014 | 0.493007 |
| M2 | -2.16350805662868 | 3.39199 | -0.6378 | 0.527048 | 0.263524 |
| M3 | -2.81444431776765 | 3.206688 | -0.8777 | 0.385111 | 0.192555 |
| M4 | -5.41334542375707 | 4.006826 | -1.351 | 0.183919 | 0.09196 |
| M5 | 14.6770191833725 | 4.079772 | 3.5975 | 0.00084 | 0.00042 |
| M6 | 2.36848127661478 | 3.106035 | 0.7625 | 0.449998 | 0.224999 |
| M7 | -5.65462648983423 | 4.008324 | -1.4107 | 0.165691 | 0.082846 |
| M8 | -7.37323493898212 | 4.059724 | -1.8162 | 0.076483 | 0.038242 |
| M9 | -4.1666523610624 | 3.382125 | -1.232 | 0.224816 | 0.112408 |
| M10 | 4.95764267217371 | 3.082835 | 1.6081 | 0.115296 | 0.057648 |
| M11 | 3.66500467191191 | 3.28568 | 1.1154 | 0.271 | 0.1355 |
| t | -0.151732055011969 | 0.053097 | -2.8576 | 0.006613 | 0.003307 |
| Multiple Linear Regression - Regression Statistics | |
| Multiple R | 0.7068850117758 |
| R-squared | 0.499686419873272 |
| Adjusted R-squared | 0.32100299839944 |
| F-TEST (value) | 2.79649010384800 |
| F-TEST (DF numerator) | 15 |
| F-TEST (DF denominator) | 42 |
| p-value | 0.00440837369515834 |
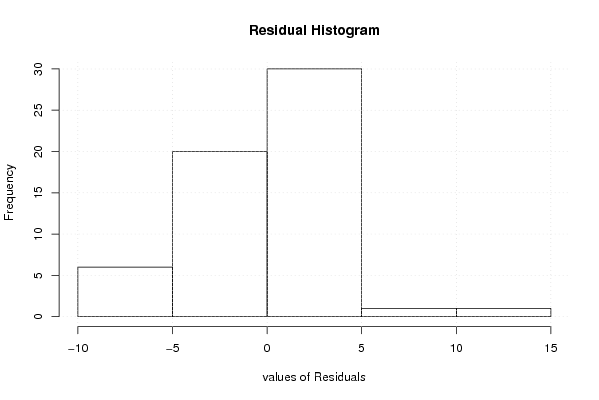
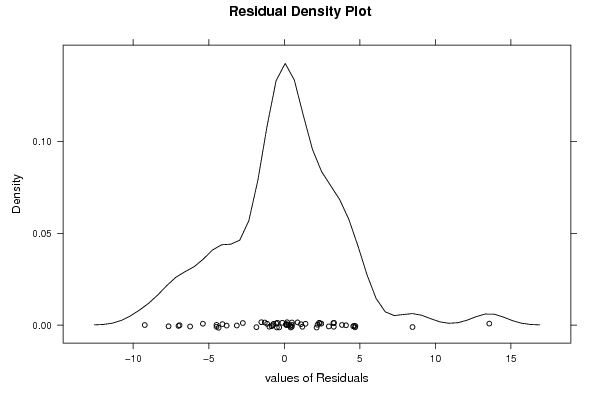
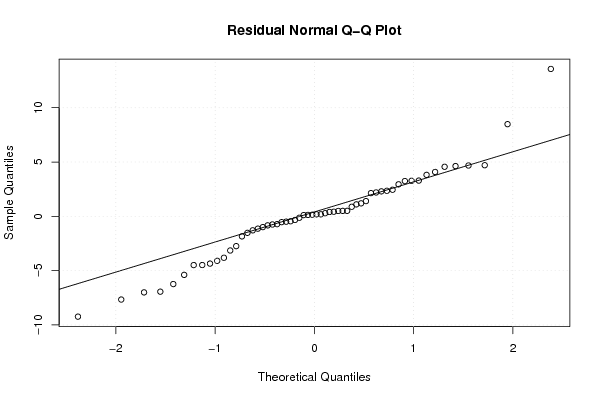
| Multiple Linear Regression - Residual Statistics | |
| Residual Standard Deviation | 4.56808646868449 |
| Sum Squared Residuals | 876.431387385888 |
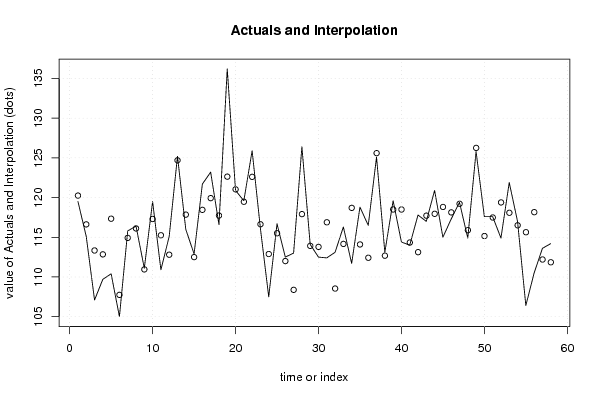
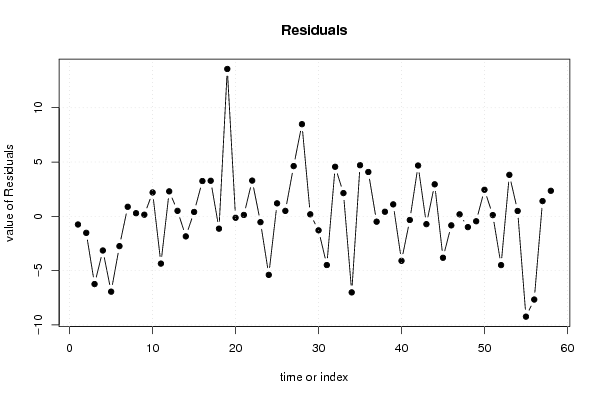
| Multiple Linear Regression - Actuals, Interpolation, and Residuals | |||
| Time or Index | Actuals | Interpolation Forecast | Residuals Prediction Error |
| 1 | 119.5 | 120.251500056653 | -0.751500056652636 |
| 2 | 115.1 | 116.621345584704 | -1.52134558470371 |
| 3 | 107.1 | 113.336118947672 | -6.23611894767218 |
| 4 | 109.7 | 112.845700551458 | -3.14570055145780 |
| 5 | 110.4 | 117.336445706283 | -6.93644570628282 |
| 6 | 105 | 107.744886901685 | -2.74488690168459 |
| 7 | 115.8 | 114.923285483205 | 0.876714516795172 |
| 8 | 116.4 | 116.112153427998 | 0.287846572002082 |
| 9 | 111.1 | 110.951754727148 | 0.148245272852022 |
| 10 | 119.5 | 117.303116191179 | 2.19688380882081 |
| 11 | 110.9 | 115.252079538086 | -4.35207953808588 |
| 12 | 115.1 | 112.801915381342 | 2.29808461865809 |
| 13 | 125.2 | 124.695458229539 | 0.504541770461356 |
| 14 | 116 | 117.847459218094 | -1.84745921809399 |
| 15 | 112.9 | 112.499234149101 | 0.400765850898923 |
| 16 | 121.7 | 118.452887323048 | 3.24711267695193 |
| 17 | 123.2 | 119.927098727151 | 3.27290127284901 |
| 18 | 116.6 | 117.736389032977 | -1.13638903297727 |
| 19 | 136.2 | 122.633682722003 | 13.5663172779967 |
| 20 | 120.9 | 121.034026231030 | -0.134026231030336 |
| 21 | 119.6 | 119.473245170794 | 0.126754829205624 |
| 22 | 125.9 | 122.610547119967 | 3.28945288003306 |
| 23 | 116.1 | 116.636798609210 | -0.536798609210364 |
| 24 | 107.5 | 112.889427117755 | -5.38942711775466 |
| 25 | 116.7 | 115.505268292581 | 1.19473170741862 |
| 26 | 112.5 | 111.999244543724 | 0.500755456275935 |
| 27 | 113 | 108.376542787343 | 4.62345721265675 |
| 28 | 126.4 | 117.916729016029 | 8.48327098397145 |
| 29 | 114.1 | 113.914910211452 | 0.185089788547831 |
| 30 | 112.5 | 113.790031308189 | -1.29003130818944 |
| 31 | 112.4 | 116.886083016958 | -4.48608301695821 |
| 32 | 113.1 | 108.539475305822 | 4.56052469417789 |
| 33 | 116.3 | 114.162286826134 | 2.13771317386629 |
| 34 | 111.7 | 118.702972283254 | -7.00297228325375 |
| 35 | 118.8 | 114.093926643532 | 4.70607335646829 |
| 36 | 116.5 | 112.417196941750 | 4.08280305824957 |
| 37 | 125.1 | 125.594028844492 | -0.494028844491673 |
| 38 | 113.1 | 112.678099639315 | 0.42190036068522 |
| 39 | 119.6 | 118.500051220466 | 1.09994877953351 |
| 40 | 114.4 | 118.496972229281 | -4.09697222928062 |
| 41 | 114 | 114.337848427104 | -0.337848427104201 |
| 42 | 117.8 | 113.122375468301 | 4.67762453169943 |
| 43 | 117 | 117.720617744684 | -0.720617744684468 |
| 44 | 120.9 | 117.953532776986 | 2.94646722301371 |
| 45 | 115 | 118.815909446074 | -3.81590944607412 |
| 46 | 117.3 | 118.132603139779 | -0.832603139778518 |
| 47 | 119.4 | 119.217195209172 | 0.182804790827963 |
| 48 | 114.9 | 115.891460559153 | -0.991460559152996 |
| 49 | 125.8 | 126.253744576736 | -0.453744576735659 |
| 50 | 117.6 | 115.153851014163 | 2.44614898583654 |
| 51 | 117.6 | 117.488052895417 | 0.111947104582988 |
| 52 | 114.9 | 119.387710880185 | -4.48771088018497 |
| 53 | 121.9 | 118.083696928010 | 3.81630307199018 |
| 54 | 117 | 116.506317288848 | 0.493682711151877 |
| 55 | 106.4 | 115.636331033149 | -9.23633103314923 |
| 56 | 110.5 | 118.160812258163 | -7.66081225816334 |
| 57 | 113.6 | 112.196803829850 | 1.40319617015018 |
| 58 | 114.2 | 111.850761265822 | 2.34923873417839 |
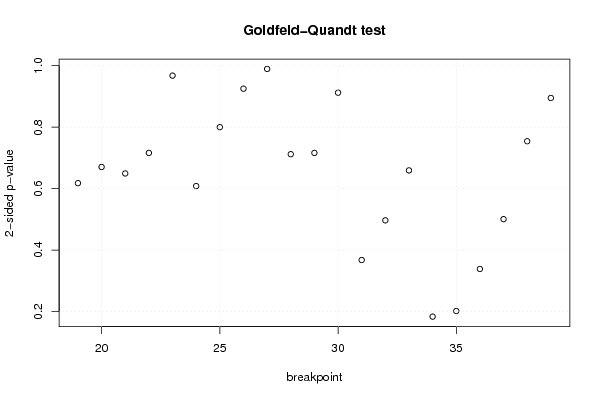
| Goldfeld-Quandt test for Heteroskedasticity | |||
| p-values | Alternative Hypothesis | ||
| breakpoint index | greater | 2-sided | less |
| 19 | 0.691086679733819 | 0.617826640532363 | 0.308913320266181 |
| 20 | 0.664736679999258 | 0.670526640001485 | 0.335263320000742 |
| 21 | 0.675288837996795 | 0.64942232400641 | 0.324711162003205 |
| 22 | 0.641897275547751 | 0.716205448904498 | 0.358102724452249 |
| 23 | 0.51609907315644 | 0.96780185368712 | 0.48390092684356 |
| 24 | 0.695828886027641 | 0.608342227944717 | 0.304171113972359 |
| 25 | 0.599940467140129 | 0.800119065719741 | 0.400059532859871 |
| 26 | 0.537315255538778 | 0.925369488922444 | 0.462684744461222 |
| 27 | 0.494781428862289 | 0.989562857724578 | 0.505218571137711 |
| 28 | 0.643927965987226 | 0.712144068025548 | 0.356072034012774 |
| 29 | 0.641905172318740 | 0.716189655362519 | 0.358094827681260 |
| 30 | 0.543873711613285 | 0.912252576773429 | 0.456126288386714 |
| 31 | 0.81621587276509 | 0.367568254469821 | 0.183784127234910 |
| 32 | 0.751589526125174 | 0.496820947749651 | 0.248410473874825 |
| 33 | 0.670331806649524 | 0.659336386700952 | 0.329668193350476 |
| 34 | 0.908353813768195 | 0.183292372463609 | 0.0916461862318046 |
| 35 | 0.89920171159073 | 0.201596576818539 | 0.100798288409269 |
| 36 | 0.830725089011113 | 0.338549821977775 | 0.169274910988887 |
| 37 | 0.749669861010074 | 0.500660277979851 | 0.250330138989926 |
| 38 | 0.622868709635998 | 0.754262580728004 | 0.377131290364002 |
| 39 | 0.447520000251892 | 0.895040000503784 | 0.552479999748108 |
| Meta Analysis of Goldfeld-Quandt test for Heteroskedasticity | |||
| Description | # significant tests | % significant tests | OK/NOK |
| 1% type I error level | 0 | 0 | OK |
| 5% type I error level | 0 | 0 | OK |
| 10% type I error level | 0 | 0 | OK |