| Multiple Linear Regression - Estimated Regression Equation |
| ipchn[t] = -17.7038315942623 + 0.807696318206962Tip[t] + 0.257003490395125`y(t-1)`[t] + 0.233715361000265`y(t-2)`[t] + 0.0409907915903471`y(t-3)`[t] -0.0785353220079551`y(t-4)`[t] -1.01573368799578M1[t] -4.08515905081215M2[t] + 16.4484736042843M3[t] + 3.8405553438376M4[t] -4.00244274137362M5[t] -5.43260024453716M6[t] -2.30125767465270M7[t] + 6.26520231550746M8[t] + 5.44072834789128M9[t] + 1.70398334438786M10[t] + 1.83762478929282M11[t] -0.147743819428464t + e[t] |
| Multiple Linear Regression - Ordinary Least Squares | |||||
| Variable | Parameter | S.D. | T-STAT H0: parameter = 0 | 2-tail p-value | 1-tail p-value |
| (Intercept) | -17.7038315942623 | 32.818485 | -0.5394 | 0.592726 | 0.296363 |
| Tip | 0.807696318206962 | 0.228547 | 3.5341 | 0.001094 | 0.000547 |
| `y(t-1)` | 0.257003490395125 | 0.138026 | 1.862 | 0.070351 | 0.035176 |
| `y(t-2)` | 0.233715361000265 | 0.140989 | 1.6577 | 0.105616 | 0.052808 |
| `y(t-3)` | 0.0409907915903471 | 0.148253 | 0.2765 | 0.783668 | 0.391834 |
| `y(t-4)` | -0.0785353220079551 | 0.154271 | -0.5091 | 0.613645 | 0.306822 |
| M1 | -1.01573368799578 | 3.790558 | -0.268 | 0.790176 | 0.395088 |
| M2 | -4.08515905081215 | 4.116057 | -0.9925 | 0.327235 | 0.163618 |
| M3 | 16.4484736042843 | 4.791492 | 3.4329 | 0.001456 | 0.000728 |
| M4 | 3.8405553438376 | 3.629213 | 1.0582 | 0.29663 | 0.148315 |
| M5 | -4.00244274137362 | 4.154148 | -0.9635 | 0.341398 | 0.170699 |
| M6 | -5.43260024453716 | 4.013878 | -1.3535 | 0.183907 | 0.091954 |
| M7 | -2.30125767465270 | 3.609708 | -0.6375 | 0.52761 | 0.263805 |
| M8 | 6.26520231550746 | 3.609206 | 1.7359 | 0.090686 | 0.045343 |
| M9 | 5.44072834789128 | 3.585049 | 1.5176 | 0.137388 | 0.068694 |
| M10 | 1.70398334438786 | 3.668012 | 0.4646 | 0.644903 | 0.322451 |
| M11 | 1.83762478929282 | 4.284803 | 0.4289 | 0.670439 | 0.33522 |
| t | -0.147743819428464 | 0.061768 | -2.3919 | 0.021813 | 0.010907 |
| Multiple Linear Regression - Regression Statistics | |
| Multiple R | 0.708863397418525 |
| R-squared | 0.502487316199733 |
| Adjusted R-squared | 0.279915852394351 |
| F-TEST (value) | 2.25764483734137 |
| F-TEST (DF numerator) | 17 |
| F-TEST (DF denominator) | 38 |
| p-value | 0.0184687553657634 |
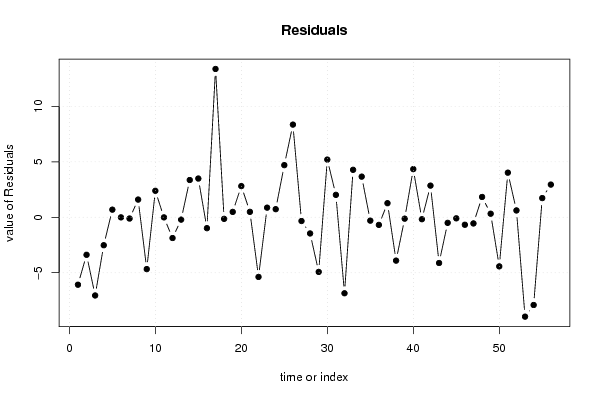
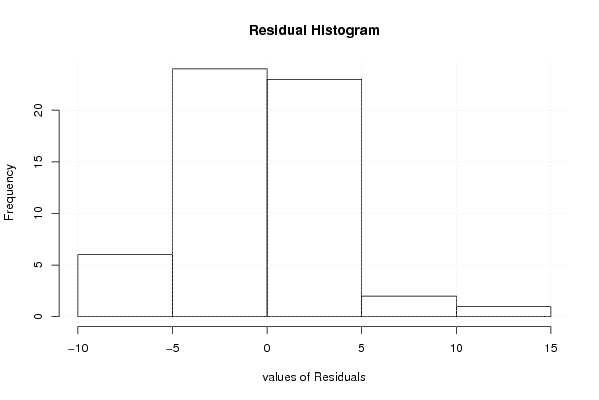
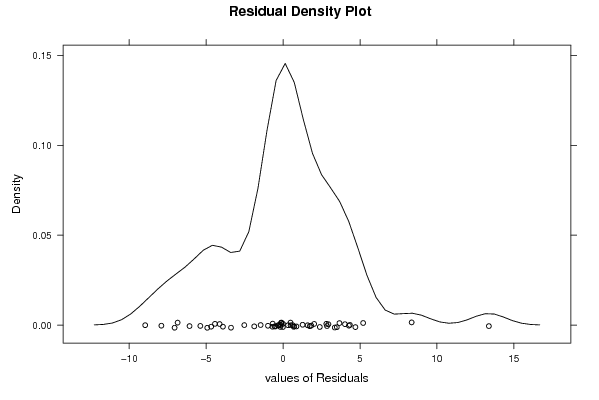
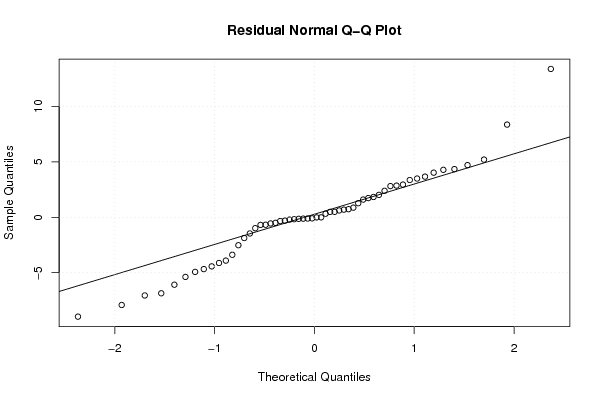
| Multiple Linear Regression - Residual Statistics | |
| Residual Standard Deviation | 4.77332400390678 |
| Sum Squared Residuals | 865.815637758361 |
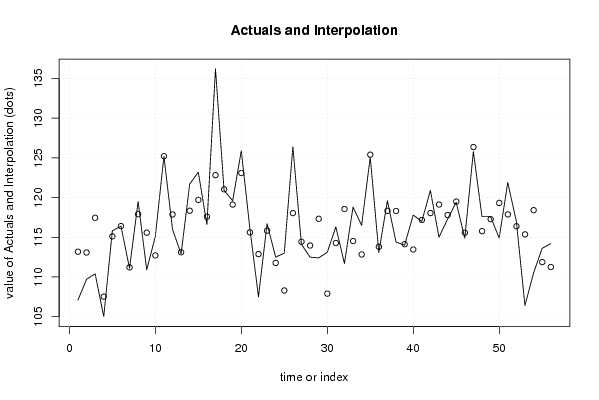
| Multiple Linear Regression - Actuals, Interpolation, and Residuals | |||
| Time or Index | Actuals | Interpolation Forecast | Residuals Prediction Error |
| 1 | 107.1 | 113.180711303446 | -6.08071130344628 |
| 2 | 109.7 | 113.083548337324 | -3.38354833732382 |
| 3 | 110.4 | 117.451335954597 | -7.05133595459691 |
| 4 | 105 | 107.520106136229 | -2.52010613622864 |
| 5 | 115.8 | 115.113161502673 | 0.68683849732744 |
| 6 | 116.4 | 116.407959648432 | -0.0079596484322576 |
| 7 | 111.1 | 111.212739623424 | -0.112739623423538 |
| 8 | 119.5 | 117.903274058728 | 1.59672594127189 |
| 9 | 110.9 | 115.573753802197 | -4.67375380219686 |
| 10 | 115.1 | 112.712494610229 | 2.38750538977123 |
| 11 | 125.2 | 125.209246842613 | -0.009246842612872 |
| 12 | 116 | 117.873576572111 | -1.87357657211143 |
| 13 | 112.9 | 113.111427442964 | -0.211427442964283 |
| 14 | 121.7 | 118.339273216819 | 3.36072678318131 |
| 15 | 123.2 | 119.707241476984 | 3.49275852301567 |
| 16 | 116.6 | 117.581578709193 | -0.981578709192729 |
| 17 | 136.2 | 122.822511578646 | 13.3774884213542 |
| 18 | 120.9 | 121.040486629726 | -0.140486629725526 |
| 19 | 119.6 | 119.115154408709 | 0.484845591291459 |
| 20 | 125.9 | 123.087972127170 | 2.8120278728302 |
| 21 | 116.1 | 115.610720710177 | 0.489279289822862 |
| 22 | 107.5 | 112.878312066998 | -5.37831206699803 |
| 23 | 116.7 | 115.831634643125 | 0.868365356875363 |
| 24 | 112.5 | 111.769640750607 | 0.73035924939252 |
| 25 | 113 | 108.297882557154 | 4.7021174428456 |
| 26 | 126.4 | 118.041731483476 | 8.35826851652438 |
| 27 | 114.1 | 114.439659982956 | -0.339659982956030 |
| 28 | 112.5 | 113.958890066316 | -1.45889006631599 |
| 29 | 112.4 | 117.326938151669 | -4.92693815166937 |
| 30 | 113.1 | 107.896648728059 | 5.20335127194125 |
| 31 | 116.3 | 114.279496902645 | 2.02050309735522 |
| 32 | 111.7 | 118.555756363049 | -6.85575636304949 |
| 33 | 118.8 | 114.520360911619 | 4.27963908838081 |
| 34 | 116.5 | 112.834785758527 | 3.66521424147315 |
| 35 | 125.1 | 125.402989256918 | -0.302989256918422 |
| 36 | 113.1 | 113.788696927360 | -0.688696927359626 |
| 37 | 119.6 | 118.330056160386 | 1.26994383961406 |
| 38 | 114.4 | 118.308150077574 | -3.90815007757421 |
| 39 | 114 | 114.124744849693 | -0.124744849693420 |
| 40 | 117.8 | 113.456039910817 | 4.34396008918333 |
| 41 | 117 | 117.174850766316 | -0.174850766316397 |
| 42 | 120.9 | 118.044536121966 | 2.85546387803364 |
| 43 | 115 | 119.122948587465 | -4.12294858746458 |
| 44 | 117.3 | 117.801717347408 | -0.501717347407672 |
| 45 | 119.4 | 119.495164576007 | -0.0951645760068132 |
| 46 | 114.9 | 115.574407564246 | -0.674407564246354 |
| 47 | 125.8 | 126.356129257344 | -0.556129257344071 |
| 48 | 117.6 | 115.768085749921 | 1.83191425007853 |
| 49 | 117.6 | 117.279922536049 | 0.320077463950901 |
| 50 | 114.9 | 119.327296884808 | -4.42729688480767 |
| 51 | 121.9 | 117.877017735769 | 4.02298226423069 |
| 52 | 117 | 116.383385177446 | 0.616614822554018 |
| 53 | 106.4 | 115.362538000696 | -8.96253800069589 |
| 54 | 110.5 | 118.410368871817 | -7.91036887181711 |
| 55 | 113.6 | 111.869660477759 | 1.73033952224143 |
| 56 | 114.2 | 111.251280103645 | 2.94871989635507 |
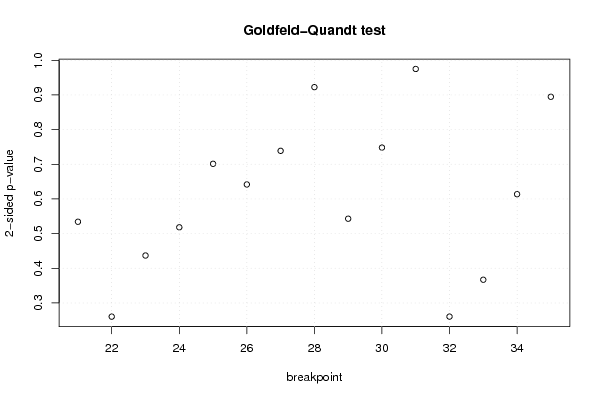
| Goldfeld-Quandt test for Heteroskedasticity | |||
| p-values | Alternative Hypothesis | ||
| breakpoint index | greater | 2-sided | less |
| 21 | 0.732903439329571 | 0.534193121340858 | 0.267096560670429 |
| 22 | 0.869774918441844 | 0.260450163116312 | 0.130225081558156 |
| 23 | 0.781588347549736 | 0.436823304900528 | 0.218411652450264 |
| 24 | 0.740908455908618 | 0.518183088182763 | 0.259091544091382 |
| 25 | 0.649349792229925 | 0.70130041554015 | 0.350650207770075 |
| 26 | 0.679109173952776 | 0.641781652094448 | 0.320890826047224 |
| 27 | 0.630606034904911 | 0.738787930190178 | 0.369393965095089 |
| 28 | 0.538779886474887 | 0.922440227050227 | 0.461220113525113 |
| 29 | 0.728527059394647 | 0.542945881210706 | 0.271472940605353 |
| 30 | 0.625935512189806 | 0.748128975620389 | 0.374064487810194 |
| 31 | 0.512530714686703 | 0.974938570626593 | 0.487469285313297 |
| 32 | 0.869723345059227 | 0.260553309881546 | 0.130276654940773 |
| 33 | 0.816527021023716 | 0.366945957952568 | 0.183472978976284 |
| 34 | 0.693170360466579 | 0.613659279066842 | 0.306829639533421 |
| 35 | 0.55267320132803 | 0.89465359734394 | 0.44732679867197 |
| Meta Analysis of Goldfeld-Quandt test for Heteroskedasticity | |||
| Description | # significant tests | % significant tests | OK/NOK |
| 1% type I error level | 0 | 0 | OK |
| 5% type I error level | 0 | 0 | OK |
| 10% type I error level | 0 | 0 | OK |