Free Statistics

of Irreproducible Research!

Author's title

Author*The author of this computation has been verified*
R Software Modulerwasp_multipleregression.wasp
Title produced by softwareMultiple Regression
Date of computationTue, 24 Nov 2009 05:09:41 -0700
Cite this page as followsStatistical Computations at FreeStatistics.org, Office for Research Development and Education, URL https://freestatistics.org/blog/index.php?v=date/2009/Nov/24/t1259064786frl71b4ckbsfa4h.htm/, Retrieved Fri, 19 Apr 2024 21:08:28 +0000
Statistical Computations at FreeStatistics.org, Office for Research Development and Education, URL https://freestatistics.org/blog/index.php?pk=59021, Retrieved Fri, 19 Apr 2024 21:08:28 +0000
QR Codes:

Original text written by user:
IsPrivate?No (this computation is public)
User-defined keywords
Estimated Impact209
Family? (F = Feedback message, R = changed R code, M = changed R Module, P = changed Parameters, D = changed Data)
-     [Multiple Regression] [] [2009-11-24 11:34:57] [f57b281e621ed7dff28b90886f5aa97c]
-   PD    [Multiple Regression] [] [2009-11-24 12:09:41] [4d89445a8ea4b299af2ee123046cffa6] [Current]
-    D      [Multiple Regression] [] [2009-11-24 12:16:30] [f57b281e621ed7dff28b90886f5aa97c]
- R  D        [Multiple Regression] [Vertragingen] [2010-12-18 11:45:57] [0ed8ad64bdfc801eaa95d5097964fc04]
-    D        [Multiple Regression] [2 vertragingen] [2010-12-18 12:25:58] [0ed8ad64bdfc801eaa95d5097964fc04]
Feedback Forum

Post a new message
Dataseries X:
98.1	107.1	115.1	119.5	109	116.7
104.5	109.7	107.1	115.1	119.5	109
87.4	110.4	109.7	107.1	115.1	119.5
89.9	105	110.4	109.7	107.1	115.1
109.8	115.8	105	110.4	109.7	107.1
111.7	116.4	115.8	105	110.4	109.7
98.6	111.1	116.4	115.8	105	110.4
96.9	119.5	111.1	116.4	115.8	105
95.1	110.9	119.5	111.1	116.4	115.8
97	115.1	110.9	119.5	111.1	116.4
112.7	125.2	115.1	110.9	119.5	111.1
102.9	116	125.2	115.1	110.9	119.5
97.4	112.9	116	125.2	115.1	110.9
111.4	121.7	112.9	116	125.2	115.1
87.4	123.2	121.7	112.9	116	125.2
96.8	116.6	123.2	121.7	112.9	116
114.1	136.2	116.6	123.2	121.7	112.9
110.3	120.9	136.2	116.6	123.2	121.7
103.9	119.6	120.9	136.2	116.6	123.2
101.6	125.9	119.6	120.9	136.2	116.6
94.6	116.1	125.9	119.6	120.9	136.2
95.9	107.5	116.1	125.9	119.6	120.9
104.7	116.7	107.5	116.1	125.9	119.6
102.8	112.5	116.7	107.5	116.1	125.9
98.1	113	112.5	116.7	107.5	116.1
113.9	126.4	113	112.5	116.7	107.5
80.9	114.1	126.4	113	112.5	116.7
95.7	112.5	114.1	126.4	113	112.5
113.2	112.4	112.5	114.1	126.4	113
105.9	113.1	112.4	112.5	114.1	126.4
108.8	116.3	113.1	112.4	112.5	114.1
102.3	111.7	116.3	113.1	112.4	112.5
99	118.8	111.7	116.3	113.1	112.4
100.7	116.5	118.8	111.7	116.3	113.1
115.5	125.1	116.5	118.8	111.7	116.3
100.7	113.1	125.1	116.5	118.8	111.7
109.9	119.6	113.1	125.1	116.5	118.8
114.6	114.4	119.6	113.1	125.1	116.5
85.4	114	114.4	119.6	113.1	125.1
100.5	117.8	114	114.4	119.6	113.1
114.8	117	117.8	114	114.4	119.6
116.5	120.9	117	117.8	114	114.4
112.9	115	120.9	117	117.8	114
102	117.3	115	120.9	117	117.8
106	119.4	117.3	115	120.9	117
105.3	114.9	119.4	117.3	115	120.9
118.8	125.8	114.9	119.4	117.3	115
106.1	117.6	125.8	114.9	119.4	117.3
109.3	117.6	117.6	125.8	114.9	119.4
117.2	114.9	117.6	117.6	125.8	114.9
92.5	121.9	114.9	117.6	117.6	125.8
104.2	117	121.9	114.9	117.6	117.6
112.5	106.4	117	121.9	114.9	117.6
122.4	110.5	106.4	117	121.9	114.9
113.3	113.6	110.5	106.4	117	121.9
100	114.2	113.6	110.5	106.4	117


Summary of computational transaction
Raw Inputview raw input (R code)
Raw Outputview raw output of R engine
Computing time4 seconds
R Server'Gwilym Jenkins' @ 72.249.127.135

\begin{tabular}{lllllllll}
\hline
Summary of computational transaction \tabularnewline
Raw Input & view raw input (R code)  \tabularnewline
Raw Output & view raw output of R engine  \tabularnewline
Computing time & 4 seconds \tabularnewline
R Server & 'Gwilym Jenkins' @ 72.249.127.135 \tabularnewline
\hline
\end{tabular}
%Source: https://freestatistics.org/blog/index.php?pk=59021&T=0

[TABLE]
[ROW][C]Summary of computational transaction[/C][/ROW]
[ROW][C]Raw Input[/C][C]view raw input (R code) [/C][/ROW]
[ROW][C]Raw Output[/C][C]view raw output of R engine [/C][/ROW]
[ROW][C]Computing time[/C][C]4 seconds[/C][/ROW]
[ROW][C]R Server[/C][C]'Gwilym Jenkins' @ 72.249.127.135[/C][/ROW]
[/TABLE]
Source: https://freestatistics.org/blog/index.php?pk=59021&T=0

Globally Unique Identifier (entire table): ba.freestatistics.org/blog/index.php?pk=59021&T=0

As an alternative you can also use a QR Code:  

The GUIDs for individual cells are displayed in the table below:

Summary of computational transaction
Raw Inputview raw input (R code)
Raw Outputview raw output of R engine
Computing time4 seconds
R Server'Gwilym Jenkins' @ 72.249.127.135


Multiple Linear Regression - Estimated Regression Equation
ipchn[t] = -17.7038315942623 + 0.807696318206962Tip[t] + 0.257003490395125`y(t-1)`[t] + 0.233715361000265`y(t-2)`[t] + 0.0409907915903471`y(t-3)`[t] -0.0785353220079551`y(t-4)`[t] -1.01573368799578M1[t] -4.08515905081215M2[t] + 16.4484736042843M3[t] + 3.8405553438376M4[t] -4.00244274137362M5[t] -5.43260024453716M6[t] -2.30125767465270M7[t] + 6.26520231550746M8[t] + 5.44072834789128M9[t] + 1.70398334438786M10[t] + 1.83762478929282M11[t] -0.147743819428464t + e[t]

\begin{tabular}{lllllllll}
\hline
Multiple Linear Regression - Estimated Regression Equation \tabularnewline
ipchn[t] =  -17.7038315942623 +  0.807696318206962Tip[t] +  0.257003490395125`y(t-1)`[t] +  0.233715361000265`y(t-2)`[t] +  0.0409907915903471`y(t-3)`[t] -0.0785353220079551`y(t-4)`[t] -1.01573368799578M1[t] -4.08515905081215M2[t] +  16.4484736042843M3[t] +  3.8405553438376M4[t] -4.00244274137362M5[t] -5.43260024453716M6[t] -2.30125767465270M7[t] +  6.26520231550746M8[t] +  5.44072834789128M9[t] +  1.70398334438786M10[t] +  1.83762478929282M11[t] -0.147743819428464t  + e[t] \tabularnewline
\hline
\end{tabular}
%Source: https://freestatistics.org/blog/index.php?pk=59021&T=1

[TABLE]
[ROW][C]Multiple Linear Regression - Estimated Regression Equation[/C][/ROW]
[ROW][C]ipchn[t] =  -17.7038315942623 +  0.807696318206962Tip[t] +  0.257003490395125`y(t-1)`[t] +  0.233715361000265`y(t-2)`[t] +  0.0409907915903471`y(t-3)`[t] -0.0785353220079551`y(t-4)`[t] -1.01573368799578M1[t] -4.08515905081215M2[t] +  16.4484736042843M3[t] +  3.8405553438376M4[t] -4.00244274137362M5[t] -5.43260024453716M6[t] -2.30125767465270M7[t] +  6.26520231550746M8[t] +  5.44072834789128M9[t] +  1.70398334438786M10[t] +  1.83762478929282M11[t] -0.147743819428464t  + e[t][/C][/ROW]
[/TABLE]
Source: https://freestatistics.org/blog/index.php?pk=59021&T=1

Globally Unique Identifier (entire table): ba.freestatistics.org/blog/index.php?pk=59021&T=1

As an alternative you can also use a QR Code:  

The GUIDs for individual cells are displayed in the table below:

Multiple Linear Regression - Estimated Regression Equation
ipchn[t] = -17.7038315942623 + 0.807696318206962Tip[t] + 0.257003490395125`y(t-1)`[t] + 0.233715361000265`y(t-2)`[t] + 0.0409907915903471`y(t-3)`[t] -0.0785353220079551`y(t-4)`[t] -1.01573368799578M1[t] -4.08515905081215M2[t] + 16.4484736042843M3[t] + 3.8405553438376M4[t] -4.00244274137362M5[t] -5.43260024453716M6[t] -2.30125767465270M7[t] + 6.26520231550746M8[t] + 5.44072834789128M9[t] + 1.70398334438786M10[t] + 1.83762478929282M11[t] -0.147743819428464t + e[t]


Multiple Linear Regression - Ordinary Least Squares
VariableParameterS.D.T-STATH0: parameter = 02-tail p-value1-tail p-value
(Intercept)-17.703831594262332.818485-0.53940.5927260.296363
Tip0.8076963182069620.2285473.53410.0010940.000547
`y(t-1)`0.2570034903951250.1380261.8620.0703510.035176
`y(t-2)`0.2337153610002650.1409891.65770.1056160.052808
`y(t-3)`0.04099079159034710.1482530.27650.7836680.391834
`y(t-4)`-0.07853532200795510.154271-0.50910.6136450.306822
M1-1.015733687995783.790558-0.2680.7901760.395088
M2-4.085159050812154.116057-0.99250.3272350.163618
M316.44847360428434.7914923.43290.0014560.000728
M43.84055534383763.6292131.05820.296630.148315
M5-4.002442741373624.154148-0.96350.3413980.170699
M6-5.432600244537164.013878-1.35350.1839070.091954
M7-2.301257674652703.609708-0.63750.527610.263805
M86.265202315507463.6092061.73590.0906860.045343
M95.440728347891283.5850491.51760.1373880.068694
M101.703983344387863.6680120.46460.6449030.322451
M111.837624789292824.2848030.42890.6704390.33522
t-0.1477438194284640.061768-2.39190.0218130.010907

\begin{tabular}{lllllllll}
\hline
Multiple Linear Regression - Ordinary Least Squares \tabularnewline
Variable & Parameter & S.D. & T-STATH0: parameter = 0 & 2-tail p-value & 1-tail p-value \tabularnewline
(Intercept) & -17.7038315942623 & 32.818485 & -0.5394 & 0.592726 & 0.296363 \tabularnewline
Tip & 0.807696318206962 & 0.228547 & 3.5341 & 0.001094 & 0.000547 \tabularnewline
`y(t-1)` & 0.257003490395125 & 0.138026 & 1.862 & 0.070351 & 0.035176 \tabularnewline
`y(t-2)` & 0.233715361000265 & 0.140989 & 1.6577 & 0.105616 & 0.052808 \tabularnewline
`y(t-3)` & 0.0409907915903471 & 0.148253 & 0.2765 & 0.783668 & 0.391834 \tabularnewline
`y(t-4)` & -0.0785353220079551 & 0.154271 & -0.5091 & 0.613645 & 0.306822 \tabularnewline
M1 & -1.01573368799578 & 3.790558 & -0.268 & 0.790176 & 0.395088 \tabularnewline
M2 & -4.08515905081215 & 4.116057 & -0.9925 & 0.327235 & 0.163618 \tabularnewline
M3 & 16.4484736042843 & 4.791492 & 3.4329 & 0.001456 & 0.000728 \tabularnewline
M4 & 3.8405553438376 & 3.629213 & 1.0582 & 0.29663 & 0.148315 \tabularnewline
M5 & -4.00244274137362 & 4.154148 & -0.9635 & 0.341398 & 0.170699 \tabularnewline
M6 & -5.43260024453716 & 4.013878 & -1.3535 & 0.183907 & 0.091954 \tabularnewline
M7 & -2.30125767465270 & 3.609708 & -0.6375 & 0.52761 & 0.263805 \tabularnewline
M8 & 6.26520231550746 & 3.609206 & 1.7359 & 0.090686 & 0.045343 \tabularnewline
M9 & 5.44072834789128 & 3.585049 & 1.5176 & 0.137388 & 0.068694 \tabularnewline
M10 & 1.70398334438786 & 3.668012 & 0.4646 & 0.644903 & 0.322451 \tabularnewline
M11 & 1.83762478929282 & 4.284803 & 0.4289 & 0.670439 & 0.33522 \tabularnewline
t & -0.147743819428464 & 0.061768 & -2.3919 & 0.021813 & 0.010907 \tabularnewline
\hline
\end{tabular}
%Source: https://freestatistics.org/blog/index.php?pk=59021&T=2

[TABLE]
[ROW][C]Multiple Linear Regression - Ordinary Least Squares[/C][/ROW]
[ROW][C]Variable[/C][C]Parameter[/C][C]S.D.[/C][C]T-STATH0: parameter = 0[/C][C]2-tail p-value[/C][C]1-tail p-value[/C][/ROW]
[ROW][C](Intercept)[/C][C]-17.7038315942623[/C][C]32.818485[/C][C]-0.5394[/C][C]0.592726[/C][C]0.296363[/C][/ROW]
[ROW][C]Tip[/C][C]0.807696318206962[/C][C]0.228547[/C][C]3.5341[/C][C]0.001094[/C][C]0.000547[/C][/ROW]
[ROW][C]`y(t-1)`[/C][C]0.257003490395125[/C][C]0.138026[/C][C]1.862[/C][C]0.070351[/C][C]0.035176[/C][/ROW]
[ROW][C]`y(t-2)`[/C][C]0.233715361000265[/C][C]0.140989[/C][C]1.6577[/C][C]0.105616[/C][C]0.052808[/C][/ROW]
[ROW][C]`y(t-3)`[/C][C]0.0409907915903471[/C][C]0.148253[/C][C]0.2765[/C][C]0.783668[/C][C]0.391834[/C][/ROW]
[ROW][C]`y(t-4)`[/C][C]-0.0785353220079551[/C][C]0.154271[/C][C]-0.5091[/C][C]0.613645[/C][C]0.306822[/C][/ROW]
[ROW][C]M1[/C][C]-1.01573368799578[/C][C]3.790558[/C][C]-0.268[/C][C]0.790176[/C][C]0.395088[/C][/ROW]
[ROW][C]M2[/C][C]-4.08515905081215[/C][C]4.116057[/C][C]-0.9925[/C][C]0.327235[/C][C]0.163618[/C][/ROW]
[ROW][C]M3[/C][C]16.4484736042843[/C][C]4.791492[/C][C]3.4329[/C][C]0.001456[/C][C]0.000728[/C][/ROW]
[ROW][C]M4[/C][C]3.8405553438376[/C][C]3.629213[/C][C]1.0582[/C][C]0.29663[/C][C]0.148315[/C][/ROW]
[ROW][C]M5[/C][C]-4.00244274137362[/C][C]4.154148[/C][C]-0.9635[/C][C]0.341398[/C][C]0.170699[/C][/ROW]
[ROW][C]M6[/C][C]-5.43260024453716[/C][C]4.013878[/C][C]-1.3535[/C][C]0.183907[/C][C]0.091954[/C][/ROW]
[ROW][C]M7[/C][C]-2.30125767465270[/C][C]3.609708[/C][C]-0.6375[/C][C]0.52761[/C][C]0.263805[/C][/ROW]
[ROW][C]M8[/C][C]6.26520231550746[/C][C]3.609206[/C][C]1.7359[/C][C]0.090686[/C][C]0.045343[/C][/ROW]
[ROW][C]M9[/C][C]5.44072834789128[/C][C]3.585049[/C][C]1.5176[/C][C]0.137388[/C][C]0.068694[/C][/ROW]
[ROW][C]M10[/C][C]1.70398334438786[/C][C]3.668012[/C][C]0.4646[/C][C]0.644903[/C][C]0.322451[/C][/ROW]
[ROW][C]M11[/C][C]1.83762478929282[/C][C]4.284803[/C][C]0.4289[/C][C]0.670439[/C][C]0.33522[/C][/ROW]
[ROW][C]t[/C][C]-0.147743819428464[/C][C]0.061768[/C][C]-2.3919[/C][C]0.021813[/C][C]0.010907[/C][/ROW]
[/TABLE]
Source: https://freestatistics.org/blog/index.php?pk=59021&T=2

Globally Unique Identifier (entire table): ba.freestatistics.org/blog/index.php?pk=59021&T=2

As an alternative you can also use a QR Code:  

The GUIDs for individual cells are displayed in the table below:

Multiple Linear Regression - Ordinary Least Squares
VariableParameterS.D.T-STATH0: parameter = 02-tail p-value1-tail p-value
(Intercept)-17.703831594262332.818485-0.53940.5927260.296363
Tip0.8076963182069620.2285473.53410.0010940.000547
`y(t-1)`0.2570034903951250.1380261.8620.0703510.035176
`y(t-2)`0.2337153610002650.1409891.65770.1056160.052808
`y(t-3)`0.04099079159034710.1482530.27650.7836680.391834
`y(t-4)`-0.07853532200795510.154271-0.50910.6136450.306822
M1-1.015733687995783.790558-0.2680.7901760.395088
M2-4.085159050812154.116057-0.99250.3272350.163618
M316.44847360428434.7914923.43290.0014560.000728
M43.84055534383763.6292131.05820.296630.148315
M5-4.002442741373624.154148-0.96350.3413980.170699
M6-5.432600244537164.013878-1.35350.1839070.091954
M7-2.301257674652703.609708-0.63750.527610.263805
M86.265202315507463.6092061.73590.0906860.045343
M95.440728347891283.5850491.51760.1373880.068694
M101.703983344387863.6680120.46460.6449030.322451
M111.837624789292824.2848030.42890.6704390.33522
t-0.1477438194284640.061768-2.39190.0218130.010907


Multiple Linear Regression - Regression Statistics
Multiple R0.708863397418525
R-squared0.502487316199733
Adjusted R-squared0.279915852394351
F-TEST (value)2.25764483734137
F-TEST (DF numerator)17
F-TEST (DF denominator)38
p-value0.0184687553657634
Multiple Linear Regression - Residual Statistics
Residual Standard Deviation4.77332400390678
Sum Squared Residuals865.815637758361

\begin{tabular}{lllllllll}
\hline
Multiple Linear Regression - Regression Statistics \tabularnewline
Multiple R & 0.708863397418525 \tabularnewline
R-squared & 0.502487316199733 \tabularnewline
Adjusted R-squared & 0.279915852394351 \tabularnewline
F-TEST (value) & 2.25764483734137 \tabularnewline
F-TEST (DF numerator) & 17 \tabularnewline
F-TEST (DF denominator) & 38 \tabularnewline
p-value & 0.0184687553657634 \tabularnewline
Multiple Linear Regression - Residual Statistics \tabularnewline
Residual Standard Deviation & 4.77332400390678 \tabularnewline
Sum Squared Residuals & 865.815637758361 \tabularnewline
\hline
\end{tabular}
%Source: https://freestatistics.org/blog/index.php?pk=59021&T=3

[TABLE]
[ROW][C]Multiple Linear Regression - Regression Statistics[/C][/ROW]
[ROW][C]Multiple R[/C][C]0.708863397418525[/C][/ROW]
[ROW][C]R-squared[/C][C]0.502487316199733[/C][/ROW]
[ROW][C]Adjusted R-squared[/C][C]0.279915852394351[/C][/ROW]
[ROW][C]F-TEST (value)[/C][C]2.25764483734137[/C][/ROW]
[ROW][C]F-TEST (DF numerator)[/C][C]17[/C][/ROW]
[ROW][C]F-TEST (DF denominator)[/C][C]38[/C][/ROW]
[ROW][C]p-value[/C][C]0.0184687553657634[/C][/ROW]
[ROW][C]Multiple Linear Regression - Residual Statistics[/C][/ROW]
[ROW][C]Residual Standard Deviation[/C][C]4.77332400390678[/C][/ROW]
[ROW][C]Sum Squared Residuals[/C][C]865.815637758361[/C][/ROW]
[/TABLE]
Source: https://freestatistics.org/blog/index.php?pk=59021&T=3

Globally Unique Identifier (entire table): ba.freestatistics.org/blog/index.php?pk=59021&T=3

As an alternative you can also use a QR Code:  

The GUIDs for individual cells are displayed in the table below:

Multiple Linear Regression - Regression Statistics
Multiple R0.708863397418525
R-squared0.502487316199733
Adjusted R-squared0.279915852394351
F-TEST (value)2.25764483734137
F-TEST (DF numerator)17
F-TEST (DF denominator)38
p-value0.0184687553657634
Multiple Linear Regression - Residual Statistics
Residual Standard Deviation4.77332400390678
Sum Squared Residuals865.815637758361


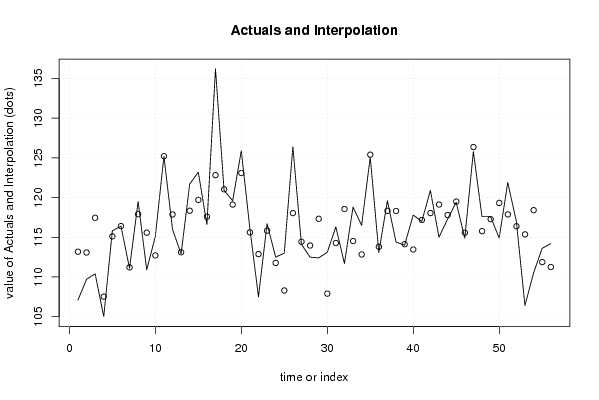
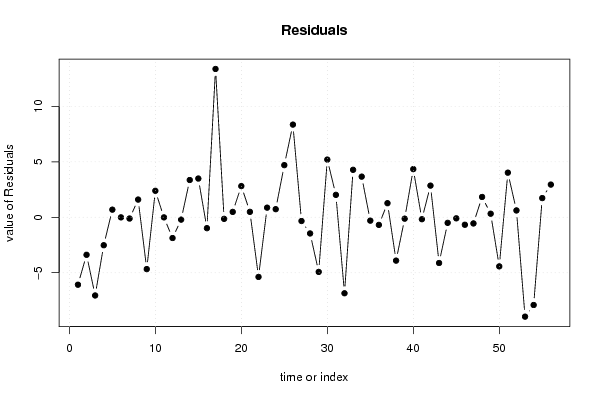
Multiple Linear Regression - Actuals, Interpolation, and Residuals
Time or IndexActualsInterpolationForecastResidualsPrediction Error
1107.1113.180711303446-6.08071130344628
2109.7113.083548337324-3.38354833732382
3110.4117.451335954597-7.05133595459691
4105107.520106136229-2.52010613622864
5115.8115.1131615026730.68683849732744
6116.4116.407959648432-0.0079596484322576
7111.1111.212739623424-0.112739623423538
8119.5117.9032740587281.59672594127189
9110.9115.573753802197-4.67375380219686
10115.1112.7124946102292.38750538977123
11125.2125.209246842613-0.009246842612872
12116117.873576572111-1.87357657211143
13112.9113.111427442964-0.211427442964283
14121.7118.3392732168193.36072678318131
15123.2119.7072414769843.49275852301567
16116.6117.581578709193-0.981578709192729
17136.2122.82251157864613.3774884213542
18120.9121.040486629726-0.140486629725526
19119.6119.1151544087090.484845591291459
20125.9123.0879721271702.8120278728302
21116.1115.6107207101770.489279289822862
22107.5112.878312066998-5.37831206699803
23116.7115.8316346431250.868365356875363
24112.5111.7696407506070.73035924939252
25113108.2978825571544.7021174428456
26126.4118.0417314834768.35826851652438
27114.1114.439659982956-0.339659982956030
28112.5113.958890066316-1.45889006631599
29112.4117.326938151669-4.92693815166937
30113.1107.8966487280595.20335127194125
31116.3114.2794969026452.02050309735522
32111.7118.555756363049-6.85575636304949
33118.8114.5203609116194.27963908838081
34116.5112.8347857585273.66521424147315
35125.1125.402989256918-0.302989256918422
36113.1113.788696927360-0.688696927359626
37119.6118.3300561603861.26994383961406
38114.4118.308150077574-3.90815007757421
39114114.124744849693-0.124744849693420
40117.8113.4560399108174.34396008918333
41117117.174850766316-0.174850766316397
42120.9118.0445361219662.85546387803364
43115119.122948587465-4.12294858746458
44117.3117.801717347408-0.501717347407672
45119.4119.495164576007-0.0951645760068132
46114.9115.574407564246-0.674407564246354
47125.8126.356129257344-0.556129257344071
48117.6115.7680857499211.83191425007853
49117.6117.2799225360490.320077463950901
50114.9119.327296884808-4.42729688480767
51121.9117.8770177357694.02298226423069
52117116.3833851774460.616614822554018
53106.4115.362538000696-8.96253800069589
54110.5118.410368871817-7.91036887181711
55113.6111.8696604777591.73033952224143
56114.2111.2512801036452.94871989635507

\begin{tabular}{lllllllll}
\hline
Multiple Linear Regression - Actuals, Interpolation, and Residuals \tabularnewline
Time or Index & Actuals & InterpolationForecast & ResidualsPrediction Error \tabularnewline
1 & 107.1 & 113.180711303446 & -6.08071130344628 \tabularnewline
2 & 109.7 & 113.083548337324 & -3.38354833732382 \tabularnewline
3 & 110.4 & 117.451335954597 & -7.05133595459691 \tabularnewline
4 & 105 & 107.520106136229 & -2.52010613622864 \tabularnewline
5 & 115.8 & 115.113161502673 & 0.68683849732744 \tabularnewline
6 & 116.4 & 116.407959648432 & -0.0079596484322576 \tabularnewline
7 & 111.1 & 111.212739623424 & -0.112739623423538 \tabularnewline
8 & 119.5 & 117.903274058728 & 1.59672594127189 \tabularnewline
9 & 110.9 & 115.573753802197 & -4.67375380219686 \tabularnewline
10 & 115.1 & 112.712494610229 & 2.38750538977123 \tabularnewline
11 & 125.2 & 125.209246842613 & -0.009246842612872 \tabularnewline
12 & 116 & 117.873576572111 & -1.87357657211143 \tabularnewline
13 & 112.9 & 113.111427442964 & -0.211427442964283 \tabularnewline
14 & 121.7 & 118.339273216819 & 3.36072678318131 \tabularnewline
15 & 123.2 & 119.707241476984 & 3.49275852301567 \tabularnewline
16 & 116.6 & 117.581578709193 & -0.981578709192729 \tabularnewline
17 & 136.2 & 122.822511578646 & 13.3774884213542 \tabularnewline
18 & 120.9 & 121.040486629726 & -0.140486629725526 \tabularnewline
19 & 119.6 & 119.115154408709 & 0.484845591291459 \tabularnewline
20 & 125.9 & 123.087972127170 & 2.8120278728302 \tabularnewline
21 & 116.1 & 115.610720710177 & 0.489279289822862 \tabularnewline
22 & 107.5 & 112.878312066998 & -5.37831206699803 \tabularnewline
23 & 116.7 & 115.831634643125 & 0.868365356875363 \tabularnewline
24 & 112.5 & 111.769640750607 & 0.73035924939252 \tabularnewline
25 & 113 & 108.297882557154 & 4.7021174428456 \tabularnewline
26 & 126.4 & 118.041731483476 & 8.35826851652438 \tabularnewline
27 & 114.1 & 114.439659982956 & -0.339659982956030 \tabularnewline
28 & 112.5 & 113.958890066316 & -1.45889006631599 \tabularnewline
29 & 112.4 & 117.326938151669 & -4.92693815166937 \tabularnewline
30 & 113.1 & 107.896648728059 & 5.20335127194125 \tabularnewline
31 & 116.3 & 114.279496902645 & 2.02050309735522 \tabularnewline
32 & 111.7 & 118.555756363049 & -6.85575636304949 \tabularnewline
33 & 118.8 & 114.520360911619 & 4.27963908838081 \tabularnewline
34 & 116.5 & 112.834785758527 & 3.66521424147315 \tabularnewline
35 & 125.1 & 125.402989256918 & -0.302989256918422 \tabularnewline
36 & 113.1 & 113.788696927360 & -0.688696927359626 \tabularnewline
37 & 119.6 & 118.330056160386 & 1.26994383961406 \tabularnewline
38 & 114.4 & 118.308150077574 & -3.90815007757421 \tabularnewline
39 & 114 & 114.124744849693 & -0.124744849693420 \tabularnewline
40 & 117.8 & 113.456039910817 & 4.34396008918333 \tabularnewline
41 & 117 & 117.174850766316 & -0.174850766316397 \tabularnewline
42 & 120.9 & 118.044536121966 & 2.85546387803364 \tabularnewline
43 & 115 & 119.122948587465 & -4.12294858746458 \tabularnewline
44 & 117.3 & 117.801717347408 & -0.501717347407672 \tabularnewline
45 & 119.4 & 119.495164576007 & -0.0951645760068132 \tabularnewline
46 & 114.9 & 115.574407564246 & -0.674407564246354 \tabularnewline
47 & 125.8 & 126.356129257344 & -0.556129257344071 \tabularnewline
48 & 117.6 & 115.768085749921 & 1.83191425007853 \tabularnewline
49 & 117.6 & 117.279922536049 & 0.320077463950901 \tabularnewline
50 & 114.9 & 119.327296884808 & -4.42729688480767 \tabularnewline
51 & 121.9 & 117.877017735769 & 4.02298226423069 \tabularnewline
52 & 117 & 116.383385177446 & 0.616614822554018 \tabularnewline
53 & 106.4 & 115.362538000696 & -8.96253800069589 \tabularnewline
54 & 110.5 & 118.410368871817 & -7.91036887181711 \tabularnewline
55 & 113.6 & 111.869660477759 & 1.73033952224143 \tabularnewline
56 & 114.2 & 111.251280103645 & 2.94871989635507 \tabularnewline
\hline
\end{tabular}
%Source: https://freestatistics.org/blog/index.php?pk=59021&T=4

[TABLE]
[ROW][C]Multiple Linear Regression - Actuals, Interpolation, and Residuals[/C][/ROW]
[ROW][C]Time or Index[/C][C]Actuals[/C][C]InterpolationForecast[/C][C]ResidualsPrediction Error[/C][/ROW]
[ROW][C]1[/C][C]107.1[/C][C]113.180711303446[/C][C]-6.08071130344628[/C][/ROW]
[ROW][C]2[/C][C]109.7[/C][C]113.083548337324[/C][C]-3.38354833732382[/C][/ROW]
[ROW][C]3[/C][C]110.4[/C][C]117.451335954597[/C][C]-7.05133595459691[/C][/ROW]
[ROW][C]4[/C][C]105[/C][C]107.520106136229[/C][C]-2.52010613622864[/C][/ROW]
[ROW][C]5[/C][C]115.8[/C][C]115.113161502673[/C][C]0.68683849732744[/C][/ROW]
[ROW][C]6[/C][C]116.4[/C][C]116.407959648432[/C][C]-0.0079596484322576[/C][/ROW]
[ROW][C]7[/C][C]111.1[/C][C]111.212739623424[/C][C]-0.112739623423538[/C][/ROW]
[ROW][C]8[/C][C]119.5[/C][C]117.903274058728[/C][C]1.59672594127189[/C][/ROW]
[ROW][C]9[/C][C]110.9[/C][C]115.573753802197[/C][C]-4.67375380219686[/C][/ROW]
[ROW][C]10[/C][C]115.1[/C][C]112.712494610229[/C][C]2.38750538977123[/C][/ROW]
[ROW][C]11[/C][C]125.2[/C][C]125.209246842613[/C][C]-0.009246842612872[/C][/ROW]
[ROW][C]12[/C][C]116[/C][C]117.873576572111[/C][C]-1.87357657211143[/C][/ROW]
[ROW][C]13[/C][C]112.9[/C][C]113.111427442964[/C][C]-0.211427442964283[/C][/ROW]
[ROW][C]14[/C][C]121.7[/C][C]118.339273216819[/C][C]3.36072678318131[/C][/ROW]
[ROW][C]15[/C][C]123.2[/C][C]119.707241476984[/C][C]3.49275852301567[/C][/ROW]
[ROW][C]16[/C][C]116.6[/C][C]117.581578709193[/C][C]-0.981578709192729[/C][/ROW]
[ROW][C]17[/C][C]136.2[/C][C]122.822511578646[/C][C]13.3774884213542[/C][/ROW]
[ROW][C]18[/C][C]120.9[/C][C]121.040486629726[/C][C]-0.140486629725526[/C][/ROW]
[ROW][C]19[/C][C]119.6[/C][C]119.115154408709[/C][C]0.484845591291459[/C][/ROW]
[ROW][C]20[/C][C]125.9[/C][C]123.087972127170[/C][C]2.8120278728302[/C][/ROW]
[ROW][C]21[/C][C]116.1[/C][C]115.610720710177[/C][C]0.489279289822862[/C][/ROW]
[ROW][C]22[/C][C]107.5[/C][C]112.878312066998[/C][C]-5.37831206699803[/C][/ROW]
[ROW][C]23[/C][C]116.7[/C][C]115.831634643125[/C][C]0.868365356875363[/C][/ROW]
[ROW][C]24[/C][C]112.5[/C][C]111.769640750607[/C][C]0.73035924939252[/C][/ROW]
[ROW][C]25[/C][C]113[/C][C]108.297882557154[/C][C]4.7021174428456[/C][/ROW]
[ROW][C]26[/C][C]126.4[/C][C]118.041731483476[/C][C]8.35826851652438[/C][/ROW]
[ROW][C]27[/C][C]114.1[/C][C]114.439659982956[/C][C]-0.339659982956030[/C][/ROW]
[ROW][C]28[/C][C]112.5[/C][C]113.958890066316[/C][C]-1.45889006631599[/C][/ROW]
[ROW][C]29[/C][C]112.4[/C][C]117.326938151669[/C][C]-4.92693815166937[/C][/ROW]
[ROW][C]30[/C][C]113.1[/C][C]107.896648728059[/C][C]5.20335127194125[/C][/ROW]
[ROW][C]31[/C][C]116.3[/C][C]114.279496902645[/C][C]2.02050309735522[/C][/ROW]
[ROW][C]32[/C][C]111.7[/C][C]118.555756363049[/C][C]-6.85575636304949[/C][/ROW]
[ROW][C]33[/C][C]118.8[/C][C]114.520360911619[/C][C]4.27963908838081[/C][/ROW]
[ROW][C]34[/C][C]116.5[/C][C]112.834785758527[/C][C]3.66521424147315[/C][/ROW]
[ROW][C]35[/C][C]125.1[/C][C]125.402989256918[/C][C]-0.302989256918422[/C][/ROW]
[ROW][C]36[/C][C]113.1[/C][C]113.788696927360[/C][C]-0.688696927359626[/C][/ROW]
[ROW][C]37[/C][C]119.6[/C][C]118.330056160386[/C][C]1.26994383961406[/C][/ROW]
[ROW][C]38[/C][C]114.4[/C][C]118.308150077574[/C][C]-3.90815007757421[/C][/ROW]
[ROW][C]39[/C][C]114[/C][C]114.124744849693[/C][C]-0.124744849693420[/C][/ROW]
[ROW][C]40[/C][C]117.8[/C][C]113.456039910817[/C][C]4.34396008918333[/C][/ROW]
[ROW][C]41[/C][C]117[/C][C]117.174850766316[/C][C]-0.174850766316397[/C][/ROW]
[ROW][C]42[/C][C]120.9[/C][C]118.044536121966[/C][C]2.85546387803364[/C][/ROW]
[ROW][C]43[/C][C]115[/C][C]119.122948587465[/C][C]-4.12294858746458[/C][/ROW]
[ROW][C]44[/C][C]117.3[/C][C]117.801717347408[/C][C]-0.501717347407672[/C][/ROW]
[ROW][C]45[/C][C]119.4[/C][C]119.495164576007[/C][C]-0.0951645760068132[/C][/ROW]
[ROW][C]46[/C][C]114.9[/C][C]115.574407564246[/C][C]-0.674407564246354[/C][/ROW]
[ROW][C]47[/C][C]125.8[/C][C]126.356129257344[/C][C]-0.556129257344071[/C][/ROW]
[ROW][C]48[/C][C]117.6[/C][C]115.768085749921[/C][C]1.83191425007853[/C][/ROW]
[ROW][C]49[/C][C]117.6[/C][C]117.279922536049[/C][C]0.320077463950901[/C][/ROW]
[ROW][C]50[/C][C]114.9[/C][C]119.327296884808[/C][C]-4.42729688480767[/C][/ROW]
[ROW][C]51[/C][C]121.9[/C][C]117.877017735769[/C][C]4.02298226423069[/C][/ROW]
[ROW][C]52[/C][C]117[/C][C]116.383385177446[/C][C]0.616614822554018[/C][/ROW]
[ROW][C]53[/C][C]106.4[/C][C]115.362538000696[/C][C]-8.96253800069589[/C][/ROW]
[ROW][C]54[/C][C]110.5[/C][C]118.410368871817[/C][C]-7.91036887181711[/C][/ROW]
[ROW][C]55[/C][C]113.6[/C][C]111.869660477759[/C][C]1.73033952224143[/C][/ROW]
[ROW][C]56[/C][C]114.2[/C][C]111.251280103645[/C][C]2.94871989635507[/C][/ROW]
[/TABLE]
Source: https://freestatistics.org/blog/index.php?pk=59021&T=4

Globally Unique Identifier (entire table): ba.freestatistics.org/blog/index.php?pk=59021&T=4

As an alternative you can also use a QR Code:  

The GUIDs for individual cells are displayed in the table below:

Multiple Linear Regression - Actuals, Interpolation, and Residuals
Time or IndexActualsInterpolationForecastResidualsPrediction Error
1107.1113.180711303446-6.08071130344628
2109.7113.083548337324-3.38354833732382
3110.4117.451335954597-7.05133595459691
4105107.520106136229-2.52010613622864
5115.8115.1131615026730.68683849732744
6116.4116.407959648432-0.0079596484322576
7111.1111.212739623424-0.112739623423538
8119.5117.9032740587281.59672594127189
9110.9115.573753802197-4.67375380219686
10115.1112.7124946102292.38750538977123
11125.2125.209246842613-0.009246842612872
12116117.873576572111-1.87357657211143
13112.9113.111427442964-0.211427442964283
14121.7118.3392732168193.36072678318131
15123.2119.7072414769843.49275852301567
16116.6117.581578709193-0.981578709192729
17136.2122.82251157864613.3774884213542
18120.9121.040486629726-0.140486629725526
19119.6119.1151544087090.484845591291459
20125.9123.0879721271702.8120278728302
21116.1115.6107207101770.489279289822862
22107.5112.878312066998-5.37831206699803
23116.7115.8316346431250.868365356875363
24112.5111.7696407506070.73035924939252
25113108.2978825571544.7021174428456
26126.4118.0417314834768.35826851652438
27114.1114.439659982956-0.339659982956030
28112.5113.958890066316-1.45889006631599
29112.4117.326938151669-4.92693815166937
30113.1107.8966487280595.20335127194125
31116.3114.2794969026452.02050309735522
32111.7118.555756363049-6.85575636304949
33118.8114.5203609116194.27963908838081
34116.5112.8347857585273.66521424147315
35125.1125.402989256918-0.302989256918422
36113.1113.788696927360-0.688696927359626
37119.6118.3300561603861.26994383961406
38114.4118.308150077574-3.90815007757421
39114114.124744849693-0.124744849693420
40117.8113.4560399108174.34396008918333
41117117.174850766316-0.174850766316397
42120.9118.0445361219662.85546387803364
43115119.122948587465-4.12294858746458
44117.3117.801717347408-0.501717347407672
45119.4119.495164576007-0.0951645760068132
46114.9115.574407564246-0.674407564246354
47125.8126.356129257344-0.556129257344071
48117.6115.7680857499211.83191425007853
49117.6117.2799225360490.320077463950901
50114.9119.327296884808-4.42729688480767
51121.9117.8770177357694.02298226423069
52117116.3833851774460.616614822554018
53106.4115.362538000696-8.96253800069589
54110.5118.410368871817-7.91036887181711
55113.6111.8696604777591.73033952224143
56114.2111.2512801036452.94871989635507


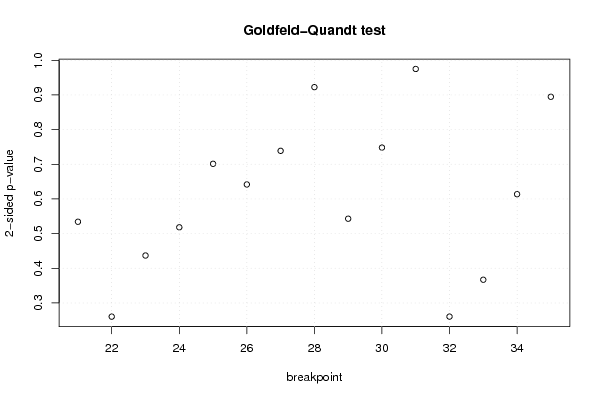
Goldfeld-Quandt test for Heteroskedasticity
p-valuesAlternative Hypothesis
breakpoint indexgreater2-sidedless
210.7329034393295710.5341931213408580.267096560670429
220.8697749184418440.2604501631163120.130225081558156
230.7815883475497360.4368233049005280.218411652450264
240.7409084559086180.5181830881827630.259091544091382
250.6493497922299250.701300415540150.350650207770075
260.6791091739527760.6417816520944480.320890826047224
270.6306060349049110.7387879301901780.369393965095089
280.5387798864748870.9224402270502270.461220113525113
290.7285270593946470.5429458812107060.271472940605353
300.6259355121898060.7481289756203890.374064487810194
310.5125307146867030.9749385706265930.487469285313297
320.8697233450592270.2605533098815460.130276654940773
330.8165270210237160.3669459579525680.183472978976284
340.6931703604665790.6136592790668420.306829639533421
350.552673201328030.894653597343940.44732679867197

\begin{tabular}{lllllllll}
\hline
Goldfeld-Quandt test for Heteroskedasticity \tabularnewline
p-values & Alternative Hypothesis \tabularnewline
breakpoint index & greater & 2-sided & less \tabularnewline
21 & 0.732903439329571 & 0.534193121340858 & 0.267096560670429 \tabularnewline
22 & 0.869774918441844 & 0.260450163116312 & 0.130225081558156 \tabularnewline
23 & 0.781588347549736 & 0.436823304900528 & 0.218411652450264 \tabularnewline
24 & 0.740908455908618 & 0.518183088182763 & 0.259091544091382 \tabularnewline
25 & 0.649349792229925 & 0.70130041554015 & 0.350650207770075 \tabularnewline
26 & 0.679109173952776 & 0.641781652094448 & 0.320890826047224 \tabularnewline
27 & 0.630606034904911 & 0.738787930190178 & 0.369393965095089 \tabularnewline
28 & 0.538779886474887 & 0.922440227050227 & 0.461220113525113 \tabularnewline
29 & 0.728527059394647 & 0.542945881210706 & 0.271472940605353 \tabularnewline
30 & 0.625935512189806 & 0.748128975620389 & 0.374064487810194 \tabularnewline
31 & 0.512530714686703 & 0.974938570626593 & 0.487469285313297 \tabularnewline
32 & 0.869723345059227 & 0.260553309881546 & 0.130276654940773 \tabularnewline
33 & 0.816527021023716 & 0.366945957952568 & 0.183472978976284 \tabularnewline
34 & 0.693170360466579 & 0.613659279066842 & 0.306829639533421 \tabularnewline
35 & 0.55267320132803 & 0.89465359734394 & 0.44732679867197 \tabularnewline
\hline
\end{tabular}
%Source: https://freestatistics.org/blog/index.php?pk=59021&T=5

[TABLE]
[ROW][C]Goldfeld-Quandt test for Heteroskedasticity[/C][/ROW]
[ROW][C]p-values[/C][C]Alternative Hypothesis[/C][/ROW]
[ROW][C]breakpoint index[/C][C]greater[/C][C]2-sided[/C][C]less[/C][/ROW]
[ROW][C]21[/C][C]0.732903439329571[/C][C]0.534193121340858[/C][C]0.267096560670429[/C][/ROW]
[ROW][C]22[/C][C]0.869774918441844[/C][C]0.260450163116312[/C][C]0.130225081558156[/C][/ROW]
[ROW][C]23[/C][C]0.781588347549736[/C][C]0.436823304900528[/C][C]0.218411652450264[/C][/ROW]
[ROW][C]24[/C][C]0.740908455908618[/C][C]0.518183088182763[/C][C]0.259091544091382[/C][/ROW]
[ROW][C]25[/C][C]0.649349792229925[/C][C]0.70130041554015[/C][C]0.350650207770075[/C][/ROW]
[ROW][C]26[/C][C]0.679109173952776[/C][C]0.641781652094448[/C][C]0.320890826047224[/C][/ROW]
[ROW][C]27[/C][C]0.630606034904911[/C][C]0.738787930190178[/C][C]0.369393965095089[/C][/ROW]
[ROW][C]28[/C][C]0.538779886474887[/C][C]0.922440227050227[/C][C]0.461220113525113[/C][/ROW]
[ROW][C]29[/C][C]0.728527059394647[/C][C]0.542945881210706[/C][C]0.271472940605353[/C][/ROW]
[ROW][C]30[/C][C]0.625935512189806[/C][C]0.748128975620389[/C][C]0.374064487810194[/C][/ROW]
[ROW][C]31[/C][C]0.512530714686703[/C][C]0.974938570626593[/C][C]0.487469285313297[/C][/ROW]
[ROW][C]32[/C][C]0.869723345059227[/C][C]0.260553309881546[/C][C]0.130276654940773[/C][/ROW]
[ROW][C]33[/C][C]0.816527021023716[/C][C]0.366945957952568[/C][C]0.183472978976284[/C][/ROW]
[ROW][C]34[/C][C]0.693170360466579[/C][C]0.613659279066842[/C][C]0.306829639533421[/C][/ROW]
[ROW][C]35[/C][C]0.55267320132803[/C][C]0.89465359734394[/C][C]0.44732679867197[/C][/ROW]
[/TABLE]
Source: https://freestatistics.org/blog/index.php?pk=59021&T=5

Globally Unique Identifier (entire table): ba.freestatistics.org/blog/index.php?pk=59021&T=5

As an alternative you can also use a QR Code:  

The GUIDs for individual cells are displayed in the table below:

Goldfeld-Quandt test for Heteroskedasticity
p-valuesAlternative Hypothesis
breakpoint indexgreater2-sidedless
210.7329034393295710.5341931213408580.267096560670429
220.8697749184418440.2604501631163120.130225081558156
230.7815883475497360.4368233049005280.218411652450264
240.7409084559086180.5181830881827630.259091544091382
250.6493497922299250.701300415540150.350650207770075
260.6791091739527760.6417816520944480.320890826047224
270.6306060349049110.7387879301901780.369393965095089
280.5387798864748870.9224402270502270.461220113525113
290.7285270593946470.5429458812107060.271472940605353
300.6259355121898060.7481289756203890.374064487810194
310.5125307146867030.9749385706265930.487469285313297
320.8697233450592270.2605533098815460.130276654940773
330.8165270210237160.3669459579525680.183472978976284
340.6931703604665790.6136592790668420.306829639533421
350.552673201328030.894653597343940.44732679867197


Meta Analysis of Goldfeld-Quandt test for Heteroskedasticity
Description# significant tests% significant testsOK/NOK
1% type I error level00OK
5% type I error level00OK
10% type I error level00OK

\begin{tabular}{lllllllll}
\hline
Meta Analysis of Goldfeld-Quandt test for Heteroskedasticity \tabularnewline
Description & # significant tests & % significant tests & OK/NOK \tabularnewline
1% type I error level & 0 & 0 & OK \tabularnewline
5% type I error level & 0 & 0 & OK \tabularnewline
10% type I error level & 0 & 0 & OK \tabularnewline
\hline
\end{tabular}
%Source: https://freestatistics.org/blog/index.php?pk=59021&T=6

[TABLE]
[ROW][C]Meta Analysis of Goldfeld-Quandt test for Heteroskedasticity[/C][/ROW]
[ROW][C]Description[/C][C]# significant tests[/C][C]% significant tests[/C][C]OK/NOK[/C][/ROW]
[ROW][C]1% type I error level[/C][C]0[/C][C]0[/C][C]OK[/C][/ROW]
[ROW][C]5% type I error level[/C][C]0[/C][C]0[/C][C]OK[/C][/ROW]
[ROW][C]10% type I error level[/C][C]0[/C][C]0[/C][C]OK[/C][/ROW]
[/TABLE]
Source: https://freestatistics.org/blog/index.php?pk=59021&T=6

Globally Unique Identifier (entire table): ba.freestatistics.org/blog/index.php?pk=59021&T=6

As an alternative you can also use a QR Code:  

The GUIDs for individual cells are displayed in the table below:

Meta Analysis of Goldfeld-Quandt test for Heteroskedasticity
Description# significant tests% significant testsOK/NOK
1% type I error level00OK
5% type I error level00OK
10% type I error level00OK


Parameters (Session):
par1 = 2 ; par2 = Include Monthly Dummies ; par3 = Linear Trend ;
Parameters (R input):
par1 = 2 ; par2 = Include Monthly Dummies ; par3 = Linear Trend ;
R code (references can be found in the software module):
library(lattice)
library(lmtest)
n25 <- 25 #minimum number of obs. for Goldfeld-Quandt test
par1 <- as.numeric(par1)
x <- t(y)
k <- length(x[1,])
n <- length(x[,1])
x1 <- cbind(x[,par1], x[,1:k!=par1])
mycolnames <- c(colnames(x)[par1], colnames(x)[1:k!=par1])
colnames(x1) <- mycolnames #colnames(x)[par1]
x <- x1
if (par3 == 'First Differences'){
x2 <- array(0, dim=c(n-1,k), dimnames=list(1:(n-1), paste('(1-B)',colnames(x),sep='')))
for (i in 1:n-1) {
for (j in 1:k) {
x2[i,j] <- x[i+1,j] - x[i,j]
}
}
x <- x2
}
if (par2 == 'Include Monthly Dummies'){
x2 <- array(0, dim=c(n,11), dimnames=list(1:n, paste('M', seq(1:11), sep ='')))
for (i in 1:11){
x2[seq(i,n,12),i] <- 1
}
x <- cbind(x, x2)
}
if (par2 == 'Include Quarterly Dummies'){
x2 <- array(0, dim=c(n,3), dimnames=list(1:n, paste('Q', seq(1:3), sep ='')))
for (i in 1:3){
x2[seq(i,n,4),i] <- 1
}
x <- cbind(x, x2)
}
k <- length(x[1,])
if (par3 == 'Linear Trend'){
x <- cbind(x, c(1:n))
colnames(x)[k+1] <- 't'
}
x
k <- length(x[1,])
df <- as.data.frame(x)
(mylm <- lm(df))
(mysum <- summary(mylm))
if (n > n25) {
kp3 <- k + 3
nmkm3 <- n - k - 3
gqarr <- array(NA, dim=c(nmkm3-kp3+1,3))
numgqtests <- 0
numsignificant1 <- 0
numsignificant5 <- 0
numsignificant10 <- 0
for (mypoint in kp3:nmkm3) {
j <- 0
numgqtests <- numgqtests + 1
for (myalt in c('greater', 'two.sided', 'less')) {
j <- j + 1
gqarr[mypoint-kp3+1,j] <- gqtest(mylm, point=mypoint, alternative=myalt)$p.value
}
if (gqarr[mypoint-kp3+1,2] < 0.01) numsignificant1 <- numsignificant1 + 1
if (gqarr[mypoint-kp3+1,2] < 0.05) numsignificant5 <- numsignificant5 + 1
if (gqarr[mypoint-kp3+1,2] < 0.10) numsignificant10 <- numsignificant10 + 1
}
gqarr
}
bitmap(file='test0.png')
plot(x[,1], type='l', main='Actuals and Interpolation', ylab='value of Actuals and Interpolation (dots)', xlab='time or index')
points(x[,1]-mysum$resid)
grid()
dev.off()
bitmap(file='test1.png')
plot(mysum$resid, type='b', pch=19, main='Residuals', ylab='value of Residuals', xlab='time or index')
grid()
dev.off()
bitmap(file='test2.png')
hist(mysum$resid, main='Residual Histogram', xlab='values of Residuals')
grid()
dev.off()
bitmap(file='test3.png')
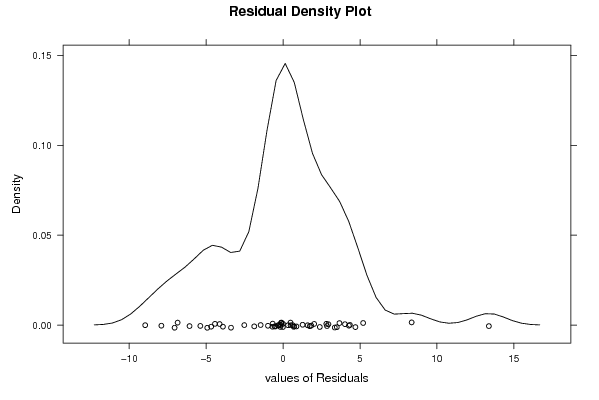
densityplot(~mysum$resid,col='black',main='Residual Density Plot', xlab='values of Residuals')
dev.off()
bitmap(file='test4.png')
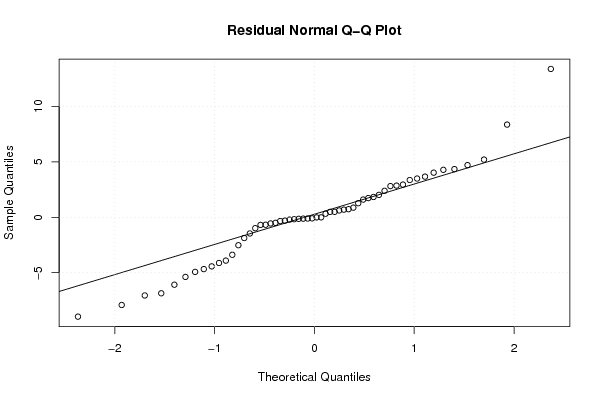
qqnorm(mysum$resid, main='Residual Normal Q-Q Plot')
qqline(mysum$resid)
grid()
dev.off()
(myerror <- as.ts(mysum$resid))
bitmap(file='test5.png')
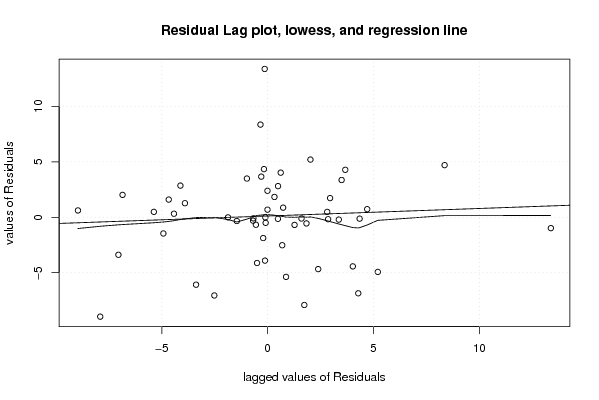
dum <- cbind(lag(myerror,k=1),myerror)
dum
dum1 <- dum[2:length(myerror),]
dum1
z <- as.data.frame(dum1)
z
plot(z,main=paste('Residual Lag plot, lowess, and regression line'), ylab='values of Residuals', xlab='lagged values of Residuals')
lines(lowess(z))
abline(lm(z))
grid()
dev.off()
bitmap(file='test6.png')
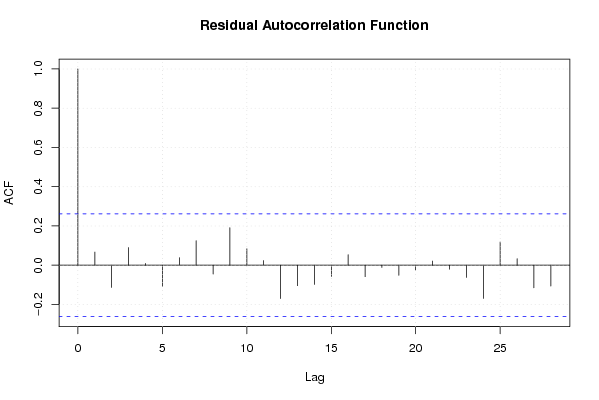
acf(mysum$resid, lag.max=length(mysum$resid)/2, main='Residual Autocorrelation Function')
grid()
dev.off()
bitmap(file='test7.png')
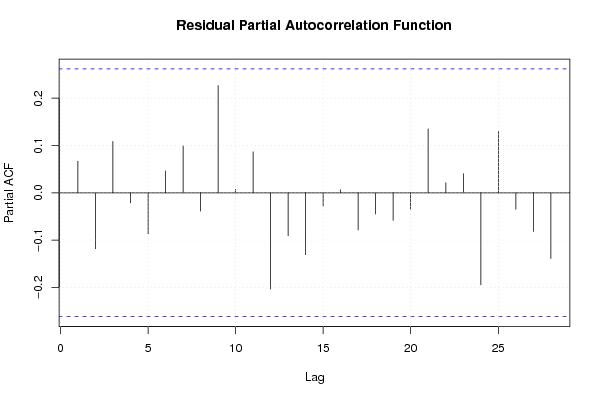
pacf(mysum$resid, lag.max=length(mysum$resid)/2, main='Residual Partial Autocorrelation Function')
grid()
dev.off()
bitmap(file='test8.png')
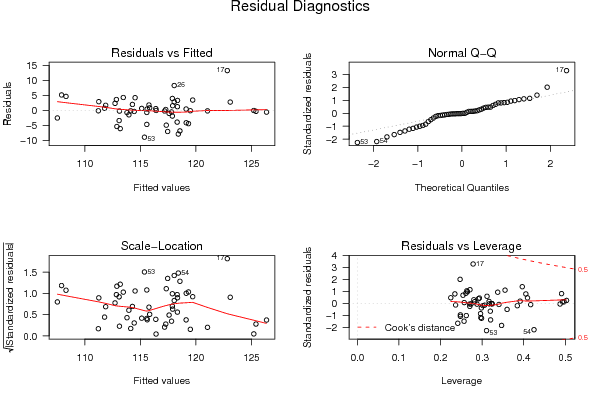
opar <- par(mfrow = c(2,2), oma = c(0, 0, 1.1, 0))
plot(mylm, las = 1, sub='Residual Diagnostics')
par(opar)
dev.off()
if (n > n25) {
bitmap(file='test9.png')
plot(kp3:nmkm3,gqarr[,2], main='Goldfeld-Quandt test',ylab='2-sided p-value',xlab='breakpoint')
grid()
dev.off()
}
load(file='createtable')
a<-table.start()
a<-table.row.start(a)
a<-table.element(a, 'Multiple Linear Regression - Estimated Regression Equation', 1, TRUE)
a<-table.row.end(a)
myeq <- colnames(x)[1]
myeq <- paste(myeq, '[t] = ', sep='')
for (i in 1:k){
if (mysum$coefficients[i,1] > 0) myeq <- paste(myeq, '+', '')
myeq <- paste(myeq, mysum$coefficients[i,1], sep=' ')
if (rownames(mysum$coefficients)[i] != '(Intercept)') {
myeq <- paste(myeq, rownames(mysum$coefficients)[i], sep='')
if (rownames(mysum$coefficients)[i] != 't') myeq <- paste(myeq, '[t]', sep='')
}
}
myeq <- paste(myeq, ' + e[t]')
a<-table.row.start(a)
a<-table.element(a, myeq)
a<-table.row.end(a)
a<-table.end(a)
table.save(a,file='mytable1.tab')
a<-table.start()
a<-table.row.start(a)
a<-table.element(a,hyperlink('ols1.htm','Multiple Linear Regression - Ordinary Least Squares',''), 6, TRUE)
a<-table.row.end(a)
a<-table.row.start(a)
a<-table.element(a,'Variable',header=TRUE)
a<-table.element(a,'Parameter',header=TRUE)
a<-table.element(a,'S.D.',header=TRUE)
a<-table.element(a,'T-STAT
H0: parameter = 0',header=TRUE)
a<-table.element(a,'2-tail p-value',header=TRUE)
a<-table.element(a,'1-tail p-value',header=TRUE)
a<-table.row.end(a)
for (i in 1:k){
a<-table.row.start(a)
a<-table.element(a,rownames(mysum$coefficients)[i],header=TRUE)
a<-table.element(a,mysum$coefficients[i,1])
a<-table.element(a, round(mysum$coefficients[i,2],6))
a<-table.element(a, round(mysum$coefficients[i,3],4))
a<-table.element(a, round(mysum$coefficients[i,4],6))
a<-table.element(a, round(mysum$coefficients[i,4]/2,6))
a<-table.row.end(a)
}
a<-table.end(a)
table.save(a,file='mytable2.tab')
a<-table.start()
a<-table.row.start(a)
a<-table.element(a, 'Multiple Linear Regression - Regression Statistics', 2, TRUE)
a<-table.row.end(a)
a<-table.row.start(a)
a<-table.element(a, 'Multiple R',1,TRUE)
a<-table.element(a, sqrt(mysum$r.squared))
a<-table.row.end(a)
a<-table.row.start(a)
a<-table.element(a, 'R-squared',1,TRUE)
a<-table.element(a, mysum$r.squared)
a<-table.row.end(a)
a<-table.row.start(a)
a<-table.element(a, 'Adjusted R-squared',1,TRUE)
a<-table.element(a, mysum$adj.r.squared)
a<-table.row.end(a)
a<-table.row.start(a)
a<-table.element(a, 'F-TEST (value)',1,TRUE)
a<-table.element(a, mysum$fstatistic[1])
a<-table.row.end(a)
a<-table.row.start(a)
a<-table.element(a, 'F-TEST (DF numerator)',1,TRUE)
a<-table.element(a, mysum$fstatistic[2])
a<-table.row.end(a)
a<-table.row.start(a)
a<-table.element(a, 'F-TEST (DF denominator)',1,TRUE)
a<-table.element(a, mysum$fstatistic[3])
a<-table.row.end(a)
a<-table.row.start(a)
a<-table.element(a, 'p-value',1,TRUE)
a<-table.element(a, 1-pf(mysum$fstatistic[1],mysum$fstatistic[2],mysum$fstatistic[3]))
a<-table.row.end(a)
a<-table.row.start(a)
a<-table.element(a, 'Multiple Linear Regression - Residual Statistics', 2, TRUE)
a<-table.row.end(a)
a<-table.row.start(a)
a<-table.element(a, 'Residual Standard Deviation',1,TRUE)
a<-table.element(a, mysum$sigma)
a<-table.row.end(a)
a<-table.row.start(a)
a<-table.element(a, 'Sum Squared Residuals',1,TRUE)
a<-table.element(a, sum(myerror*myerror))
a<-table.row.end(a)
a<-table.end(a)
table.save(a,file='mytable3.tab')
a<-table.start()
a<-table.row.start(a)
a<-table.element(a, 'Multiple Linear Regression - Actuals, Interpolation, and Residuals', 4, TRUE)
a<-table.row.end(a)
a<-table.row.start(a)
a<-table.element(a, 'Time or Index', 1, TRUE)
a<-table.element(a, 'Actuals', 1, TRUE)
a<-table.element(a, 'Interpolation
Forecast', 1, TRUE)
a<-table.element(a, 'Residuals
Prediction Error', 1, TRUE)
a<-table.row.end(a)
for (i in 1:n) {
a<-table.row.start(a)
a<-table.element(a,i, 1, TRUE)
a<-table.element(a,x[i])
a<-table.element(a,x[i]-mysum$resid[i])
a<-table.element(a,mysum$resid[i])
a<-table.row.end(a)
}
a<-table.end(a)
table.save(a,file='mytable4.tab')
if (n > n25) {
a<-table.start()
a<-table.row.start(a)
a<-table.element(a,'Goldfeld-Quandt test for Heteroskedasticity',4,TRUE)
a<-table.row.end(a)
a<-table.row.start(a)
a<-table.element(a,'p-values',header=TRUE)
a<-table.element(a,'Alternative Hypothesis',3,header=TRUE)
a<-table.row.end(a)
a<-table.row.start(a)
a<-table.element(a,'breakpoint index',header=TRUE)
a<-table.element(a,'greater',header=TRUE)
a<-table.element(a,'2-sided',header=TRUE)
a<-table.element(a,'less',header=TRUE)
a<-table.row.end(a)
for (mypoint in kp3:nmkm3) {
a<-table.row.start(a)
a<-table.element(a,mypoint,header=TRUE)
a<-table.element(a,gqarr[mypoint-kp3+1,1])
a<-table.element(a,gqarr[mypoint-kp3+1,2])
a<-table.element(a,gqarr[mypoint-kp3+1,3])
a<-table.row.end(a)
}
a<-table.end(a)
table.save(a,file='mytable5.tab')
a<-table.start()
a<-table.row.start(a)
a<-table.element(a,'Meta Analysis of Goldfeld-Quandt test for Heteroskedasticity',4,TRUE)
a<-table.row.end(a)
a<-table.row.start(a)
a<-table.element(a,'Description',header=TRUE)
a<-table.element(a,'# significant tests',header=TRUE)
a<-table.element(a,'% significant tests',header=TRUE)
a<-table.element(a,'OK/NOK',header=TRUE)
a<-table.row.end(a)
a<-table.row.start(a)
a<-table.element(a,'1% type I error level',header=TRUE)
a<-table.element(a,numsignificant1)
a<-table.element(a,numsignificant1/numgqtests)
if (numsignificant1/numgqtests < 0.01) dum <- 'OK' else dum <- 'NOK'
a<-table.element(a,dum)
a<-table.row.end(a)
a<-table.row.start(a)
a<-table.element(a,'5% type I error level',header=TRUE)
a<-table.element(a,numsignificant5)
a<-table.element(a,numsignificant5/numgqtests)
if (numsignificant5/numgqtests < 0.05) dum <- 'OK' else dum <- 'NOK'
a<-table.element(a,dum)
a<-table.row.end(a)
a<-table.row.start(a)
a<-table.element(a,'10% type I error level',header=TRUE)
a<-table.element(a,numsignificant10)
a<-table.element(a,numsignificant10/numgqtests)
if (numsignificant10/numgqtests < 0.1) dum <- 'OK' else dum <- 'NOK'
a<-table.element(a,dum)
a<-table.row.end(a)
a<-table.end(a)
table.save(a,file='mytable6.tab')
}