| Multiple Linear Regression - Estimated Regression Equation |
| ipchn[t] = + 46.4146793383104 + 0.746503234894817Tip[t] -0.892302272677017M1[t] -5.13511571343774M2[t] -4.30778629079102M3[t] -5.54756016461321M4[t] -5.90470959410443M5[t] -9.70605214891858M6[t] + 8.80895968214796M7[t] -2.01409591346731M8[t] -9.6705069071819M9[t] -11.1242994421722M10[t] -7.88526146792929M11[t] -0.104529017759257t + e[t] |
| Multiple Linear Regression - Ordinary Least Squares | |||||
| Variable | Parameter | S.D. | T-STAT H0: parameter = 0 | 2-tail p-value | 1-tail p-value |
| (Intercept) | 46.4146793383104 | 19.953483 | 2.3261 | 0.024472 | 0.012236 |
| Tip | 0.746503234894817 | 0.210242 | 3.5507 | 0.000899 | 0.00045 |
| M1 | -0.892302272677017 | 3.154317 | -0.2829 | 0.778536 | 0.389268 |
| M2 | -5.13511571343774 | 3.15061 | -1.6299 | 0.109957 | 0.054978 |
| M3 | -4.30778629079102 | 4.095137 | -1.0519 | 0.298328 | 0.149164 |
| M4 | -5.54756016461321 | 3.24736 | -1.7083 | 0.094316 | 0.047158 |
| M5 | -5.90470959410443 | 3.211719 | -1.8385 | 0.072452 | 0.036226 |
| M6 | -9.70605214891858 | 4.136587 | -2.3464 | 0.02332 | 0.01166 |
| M7 | 8.80895968214796 | 4.149407 | 2.1229 | 0.039171 | 0.019586 |
| M8 | -2.01409591346731 | 3.171649 | -0.635 | 0.528554 | 0.264277 |
| M9 | -9.6705069071819 | 4.134973 | -2.3387 | 0.023751 | 0.011875 |
| M10 | -11.1242994421722 | 4.175721 | -2.664 | 0.010609 | 0.005305 |
| M11 | -7.88526146792929 | 3.466862 | -2.2745 | 0.027648 | 0.013824 |
| t | -0.104529017759257 | 0.053261 | -1.9626 | 0.055761 | 0.02788 |
| Multiple Linear Regression - Regression Statistics | |
| Multiple R | 0.61415688381946 |
| R-squared | 0.377188677942829 |
| Adjusted R-squared | 0.201176782578846 |
| F-TEST (value) | 2.14297265058605 |
| F-TEST (DF numerator) | 13 |
| F-TEST (DF denominator) | 46 |
| p-value | 0.0291661287439557 |
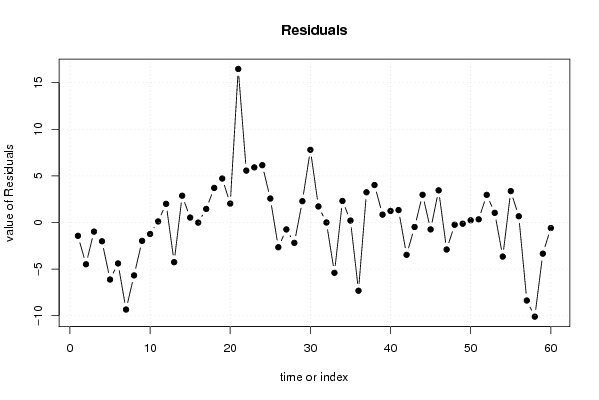
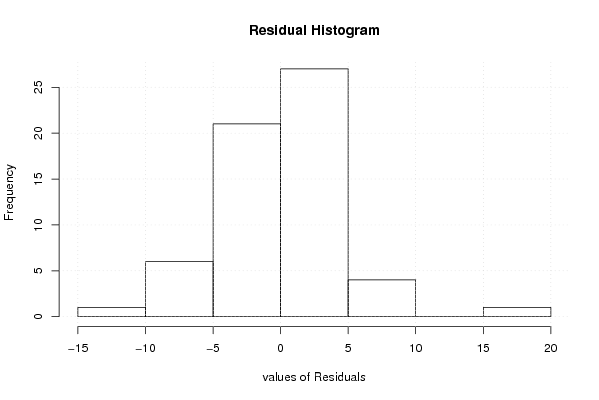
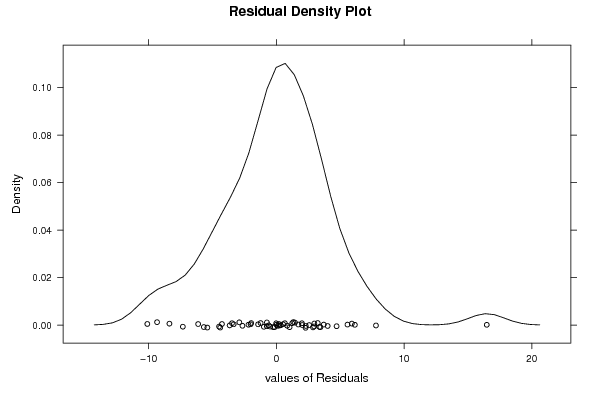
| Multiple Linear Regression - Residual Statistics | |
| Residual Standard Deviation | 4.94401772121584 |
| Sum Squared Residuals | 1124.39231647403 |
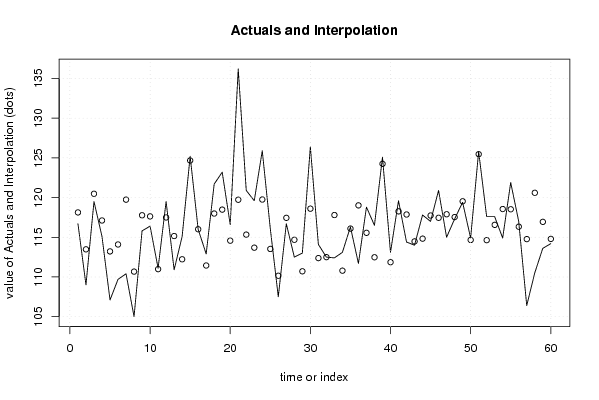
| Multiple Linear Regression - Actuals, Interpolation, and Residuals | |||
| Time or Index | Actuals | Interpolation Forecast | Residuals Prediction Error |
| 1 | 116.7 | 118.127263126630 | -1.42726312662984 |
| 2 | 109 | 113.481319374152 | -4.48131937415151 |
| 3 | 119.5 | 120.474746952155 | -0.974746952155375 |
| 4 | 115.1 | 117.114885326358 | -2.01488532635793 |
| 5 | 107.1 | 113.219291998591 | -6.11929199859128 |
| 6 | 109.7 | 114.091041129345 | -4.3910411293447 |
| 7 | 110.4 | 119.736318625951 | -9.33631862595064 |
| 8 | 105 | 110.674992099813 | -5.67499209981315 |
| 9 | 115.8 | 117.769466462746 | -1.96946646274613 |
| 10 | 116.4 | 117.629501056297 | -1.22950105629677 |
| 11 | 111.1 | 110.984817635658 | 0.115182364341702 |
| 12 | 119.5 | 117.496494586507 | 2.00350541349286 |
| 13 | 110.9 | 115.155957473260 | -4.25595747326019 |
| 14 | 115.1 | 112.226971161040 | 2.87302883895962 |
| 15 | 125.2 | 124.669872353776 | 0.530127646223556 |
| 16 | 116 | 116.009837760226 | -0.00983776022580646 |
| 17 | 112.9 | 111.442391521054 | 1.45760847894617 |
| 18 | 121.7 | 117.987565237008 | 3.71243476299214 |
| 19 | 123.2 | 118.481970412840 | 4.71802958716045 |
| 20 | 116.6 | 114.571516207476 | 2.02848379252370 |
| 21 | 136.2 | 119.725082159683 | 16.4749178403172 |
| 22 | 120.9 | 115.330048314333 | 5.56995168566706 |
| 23 | 119.6 | 113.686936567490 | 5.91306343251025 |
| 24 | 125.9 | 119.750711577402 | 6.14928842259831 |
| 25 | 116.1 | 113.528357642702 | 2.57164235729829 |
| 26 | 107.5 | 110.151469389545 | -2.65146938954499 |
| 27 | 116.7 | 117.443498261507 | -0.743498261506833 |
| 28 | 112.5 | 114.680839223625 | -2.18083922362524 |
| 29 | 113 | 110.710595572369 | 2.28940442763088 |
| 30 | 126.4 | 118.599475111134 | 7.80052488886619 |
| 31 | 114.1 | 112.375351172912 | 1.72464882708782 |
| 32 | 112.5 | 112.496014435981 | 0.00398556401908479 |
| 33 | 112.4 | 117.798881035166 | -5.39888103516634 |
| 34 | 113.1 | 110.791085867685 | 2.30891413231532 |
| 35 | 116.3 | 116.090454205363 | 0.209545794636744 |
| 36 | 111.7 | 119.018915628717 | -7.31891562871698 |
| 37 | 118.8 | 115.558623663128 | 3.24137633687218 |
| 38 | 116.5 | 112.480336703929 | 4.01966329607097 |
| 39 | 125.1 | 124.251384985260 | 0.848615014740228 |
| 40 | 113.1 | 111.858834217235 | 1.24116578276495 |
| 41 | 119.6 | 118.264985531017 | 1.33501446898312 |
| 42 | 114.4 | 117.867679162449 | -3.46767916244909 |
| 43 | 114 | 114.480267516828 | -0.480267516827762 |
| 44 | 117.8 | 114.824881750365 | 2.97511824963505 |
| 45 | 117 | 117.738937997887 | -0.738937997886962 |
| 46 | 120.9 | 117.449671944459 | 3.45032805554136 |
| 47 | 115 | 117.896769255321 | -2.89676925532093 |
| 48 | 117.3 | 117.540616445137 | -0.24061644513746 |
| 49 | 119.4 | 119.529798094280 | -0.129798094280441 |
| 50 | 114.9 | 114.659903371334 | 0.240096628665911 |
| 51 | 125.8 | 125.460497447302 | 0.339502552698423 |
| 52 | 117.6 | 114.635603472556 | 2.96439652744403 |
| 53 | 117.6 | 116.562735376969 | 1.03726462303110 |
| 54 | 114.9 | 118.554239360065 | -3.65423936006454 |
| 55 | 121.9 | 118.52609227147 | 3.37390772853014 |
| 56 | 117 | 116.332595506365 | 0.66740449363531 |
| 57 | 106.4 | 114.767632344518 | -8.3676323445178 |
| 58 | 110.5 | 120.599692817227 | -10.0996928172270 |
| 59 | 113.6 | 116.941022336168 | -3.34102233616777 |
| 60 | 114.2 | 114.793261762237 | -0.59326176223674 |
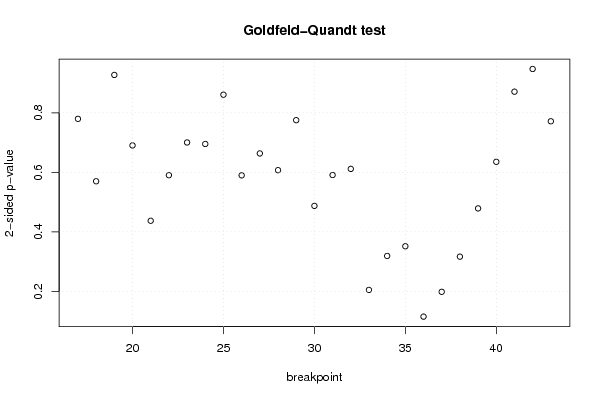
| Goldfeld-Quandt test for Heteroskedasticity | |||
| p-values | Alternative Hypothesis | ||
| breakpoint index | greater | 2-sided | less |
| 17 | 0.389795845757798 | 0.779591691515597 | 0.610204154242202 |
| 18 | 0.284967720196960 | 0.569935440393921 | 0.71503227980304 |
| 19 | 0.463585088333979 | 0.927170176667957 | 0.536414911666021 |
| 20 | 0.345186358345715 | 0.69037271669143 | 0.654813641654285 |
| 21 | 0.781373830157016 | 0.437252339685968 | 0.218626169842984 |
| 22 | 0.704886627253679 | 0.590226745492642 | 0.295113372746321 |
| 23 | 0.649876198640993 | 0.700247602718013 | 0.350123801359007 |
| 24 | 0.652358730631309 | 0.695282538737383 | 0.347641269368691 |
| 25 | 0.56962651514332 | 0.86074696971336 | 0.43037348485668 |
| 26 | 0.705078012925797 | 0.589843974148406 | 0.294921987074203 |
| 27 | 0.668281441578158 | 0.663437116843685 | 0.331718558421842 |
| 28 | 0.696391261764448 | 0.607217476471104 | 0.303608738235552 |
| 29 | 0.612418219039953 | 0.775163561920095 | 0.387581780960047 |
| 30 | 0.756392854043642 | 0.487214291912717 | 0.243607145956358 |
| 31 | 0.704575685542324 | 0.590848628915351 | 0.295424314457676 |
| 32 | 0.694255067648684 | 0.611489864702633 | 0.305744932351316 |
| 33 | 0.897561076075207 | 0.204877847849586 | 0.102438923924793 |
| 34 | 0.840486365284154 | 0.319027269431692 | 0.159513634715846 |
| 35 | 0.824233129634122 | 0.351533740731755 | 0.175766870365878 |
| 36 | 0.942451523328138 | 0.115096953343723 | 0.0575484766718617 |
| 37 | 0.900720116254906 | 0.198559767490188 | 0.0992798837450942 |
| 38 | 0.84164291648119 | 0.316714167037621 | 0.158357083518810 |
| 39 | 0.760610798707863 | 0.478778402584273 | 0.239389201292137 |
| 40 | 0.682366302026535 | 0.63526739594693 | 0.317633697973465 |
| 41 | 0.564571212117743 | 0.870857575764514 | 0.435428787882257 |
| 42 | 0.473624382985058 | 0.947248765970117 | 0.526375617014942 |
| 43 | 0.614279227124504 | 0.771441545750993 | 0.385720772875496 |
| Meta Analysis of Goldfeld-Quandt test for Heteroskedasticity | |||
| Description | # significant tests | % significant tests | OK/NOK |
| 1% type I error level | 0 | 0 | OK |
| 5% type I error level | 0 | 0 | OK |
| 10% type I error level | 0 | 0 | OK |