Free Statistics

of Irreproducible Research!

Author's title

Author*The author of this computation has been verified*
R Software Modulerwasp_multipleregression.wasp
Title produced by softwareMultiple Regression
Date of computationTue, 24 Nov 2009 04:57:53 -0700
Cite this page as followsStatistical Computations at FreeStatistics.org, Office for Research Development and Education, URL https://freestatistics.org/blog/index.php?v=date/2009/Nov/24/t1259064129e5isj8s7anepl3u.htm/, Retrieved Wed, 24 Apr 2024 22:35:25 +0000
Statistical Computations at FreeStatistics.org, Office for Research Development and Education, URL https://freestatistics.org/blog/index.php?pk=59015, Retrieved Wed, 24 Apr 2024 22:35:25 +0000
QR Codes:

Original text written by user:
IsPrivate?No (this computation is public)
User-defined keywords
Estimated Impact144
Family? (F = Feedback message, R = changed R code, M = changed R Module, P = changed Parameters, D = changed Data)
-     [Multiple Regression] [] [2009-11-24 11:34:57] [f57b281e621ed7dff28b90886f5aa97c]
-   P     [Multiple Regression] [] [2009-11-24 11:57:53] [4d89445a8ea4b299af2ee123046cffa6] [Current]
Feedback Forum

Post a new message
Dataseries X:
97.4	116.7
97	109
105.4	119.5
102.7	115.1
98.1	107.1
104.5	109.7
87.4	110.4
89.9	105
109.8	115.8
111.7	116.4
98.6	111.1
96.9	119.5
95.1	110.9
97	115.1
112.7	125.2
102.9	116
97.4	112.9
111.4	121.7
87.4	123.2
96.8	116.6
114.1	136.2
110.3	120.9
103.9	119.6
101.6	125.9
94.6	116.1
95.9	107.5
104.7	116.7
102.8	112.5
98.1	113
113.9	126.4
80.9	114.1
95.7	112.5
113.2	112.4
105.9	113.1
108.8	116.3
102.3	111.7
99	118.8
100.7	116.5
115.5	125.1
100.7	113.1
109.9	119.6
114.6	114.4
85.4	114
100.5	117.8
114.8	117
116.5	120.9
112.9	115
102	117.3
106	119.4
105.3	114.9
118.8	125.8
106.1	117.6
109.3	117.6
117.2	114.9
92.5	121.9
104.2	117
112.5	106.4
122.4	110.5
113.3	113.6
100	114.2


Summary of computational transaction
Raw Inputview raw input (R code)
Raw Outputview raw output of R engine
Computing time6 seconds
R Server'Gwilym Jenkins' @ 72.249.127.135

\begin{tabular}{lllllllll}
\hline
Summary of computational transaction \tabularnewline
Raw Input & view raw input (R code)  \tabularnewline
Raw Output & view raw output of R engine  \tabularnewline
Computing time & 6 seconds \tabularnewline
R Server & 'Gwilym Jenkins' @ 72.249.127.135 \tabularnewline
\hline
\end{tabular}
%Source: https://freestatistics.org/blog/index.php?pk=59015&T=0

[TABLE]
[ROW][C]Summary of computational transaction[/C][/ROW]
[ROW][C]Raw Input[/C][C]view raw input (R code) [/C][/ROW]
[ROW][C]Raw Output[/C][C]view raw output of R engine [/C][/ROW]
[ROW][C]Computing time[/C][C]6 seconds[/C][/ROW]
[ROW][C]R Server[/C][C]'Gwilym Jenkins' @ 72.249.127.135[/C][/ROW]
[/TABLE]
Source: https://freestatistics.org/blog/index.php?pk=59015&T=0

Globally Unique Identifier (entire table): ba.freestatistics.org/blog/index.php?pk=59015&T=0

As an alternative you can also use a QR Code:  

The GUIDs for individual cells are displayed in the table below:

Summary of computational transaction
Raw Inputview raw input (R code)
Raw Outputview raw output of R engine
Computing time6 seconds
R Server'Gwilym Jenkins' @ 72.249.127.135


Multiple Linear Regression - Estimated Regression Equation
ipchn[t] = + 46.4146793383104 + 0.746503234894817Tip[t] -0.892302272677017M1[t] -5.13511571343774M2[t] -4.30778629079102M3[t] -5.54756016461321M4[t] -5.90470959410443M5[t] -9.70605214891858M6[t] + 8.80895968214796M7[t] -2.01409591346731M8[t] -9.6705069071819M9[t] -11.1242994421722M10[t] -7.88526146792929M11[t] -0.104529017759257t + e[t]

\begin{tabular}{lllllllll}
\hline
Multiple Linear Regression - Estimated Regression Equation \tabularnewline
ipchn[t] =  +  46.4146793383104 +  0.746503234894817Tip[t] -0.892302272677017M1[t] -5.13511571343774M2[t] -4.30778629079102M3[t] -5.54756016461321M4[t] -5.90470959410443M5[t] -9.70605214891858M6[t] +  8.80895968214796M7[t] -2.01409591346731M8[t] -9.6705069071819M9[t] -11.1242994421722M10[t] -7.88526146792929M11[t] -0.104529017759257t  + e[t] \tabularnewline
\hline
\end{tabular}
%Source: https://freestatistics.org/blog/index.php?pk=59015&T=1

[TABLE]
[ROW][C]Multiple Linear Regression - Estimated Regression Equation[/C][/ROW]
[ROW][C]ipchn[t] =  +  46.4146793383104 +  0.746503234894817Tip[t] -0.892302272677017M1[t] -5.13511571343774M2[t] -4.30778629079102M3[t] -5.54756016461321M4[t] -5.90470959410443M5[t] -9.70605214891858M6[t] +  8.80895968214796M7[t] -2.01409591346731M8[t] -9.6705069071819M9[t] -11.1242994421722M10[t] -7.88526146792929M11[t] -0.104529017759257t  + e[t][/C][/ROW]
[/TABLE]
Source: https://freestatistics.org/blog/index.php?pk=59015&T=1

Globally Unique Identifier (entire table): ba.freestatistics.org/blog/index.php?pk=59015&T=1

As an alternative you can also use a QR Code:  

The GUIDs for individual cells are displayed in the table below:

Multiple Linear Regression - Estimated Regression Equation
ipchn[t] = + 46.4146793383104 + 0.746503234894817Tip[t] -0.892302272677017M1[t] -5.13511571343774M2[t] -4.30778629079102M3[t] -5.54756016461321M4[t] -5.90470959410443M5[t] -9.70605214891858M6[t] + 8.80895968214796M7[t] -2.01409591346731M8[t] -9.6705069071819M9[t] -11.1242994421722M10[t] -7.88526146792929M11[t] -0.104529017759257t + e[t]


Multiple Linear Regression - Ordinary Least Squares
VariableParameterS.D.T-STATH0: parameter = 02-tail p-value1-tail p-value
(Intercept)46.414679338310419.9534832.32610.0244720.012236
Tip0.7465032348948170.2102423.55070.0008990.00045
M1-0.8923022726770173.154317-0.28290.7785360.389268
M2-5.135115713437743.15061-1.62990.1099570.054978
M3-4.307786290791024.095137-1.05190.2983280.149164
M4-5.547560164613213.24736-1.70830.0943160.047158
M5-5.904709594104433.211719-1.83850.0724520.036226
M6-9.706052148918584.136587-2.34640.023320.01166
M78.808959682147964.1494072.12290.0391710.019586
M8-2.014095913467313.171649-0.6350.5285540.264277
M9-9.67050690718194.134973-2.33870.0237510.011875
M10-11.12429944217224.175721-2.6640.0106090.005305
M11-7.885261467929293.466862-2.27450.0276480.013824
t-0.1045290177592570.053261-1.96260.0557610.02788

\begin{tabular}{lllllllll}
\hline
Multiple Linear Regression - Ordinary Least Squares \tabularnewline
Variable & Parameter & S.D. & T-STATH0: parameter = 0 & 2-tail p-value & 1-tail p-value \tabularnewline
(Intercept) & 46.4146793383104 & 19.953483 & 2.3261 & 0.024472 & 0.012236 \tabularnewline
Tip & 0.746503234894817 & 0.210242 & 3.5507 & 0.000899 & 0.00045 \tabularnewline
M1 & -0.892302272677017 & 3.154317 & -0.2829 & 0.778536 & 0.389268 \tabularnewline
M2 & -5.13511571343774 & 3.15061 & -1.6299 & 0.109957 & 0.054978 \tabularnewline
M3 & -4.30778629079102 & 4.095137 & -1.0519 & 0.298328 & 0.149164 \tabularnewline
M4 & -5.54756016461321 & 3.24736 & -1.7083 & 0.094316 & 0.047158 \tabularnewline
M5 & -5.90470959410443 & 3.211719 & -1.8385 & 0.072452 & 0.036226 \tabularnewline
M6 & -9.70605214891858 & 4.136587 & -2.3464 & 0.02332 & 0.01166 \tabularnewline
M7 & 8.80895968214796 & 4.149407 & 2.1229 & 0.039171 & 0.019586 \tabularnewline
M8 & -2.01409591346731 & 3.171649 & -0.635 & 0.528554 & 0.264277 \tabularnewline
M9 & -9.6705069071819 & 4.134973 & -2.3387 & 0.023751 & 0.011875 \tabularnewline
M10 & -11.1242994421722 & 4.175721 & -2.664 & 0.010609 & 0.005305 \tabularnewline
M11 & -7.88526146792929 & 3.466862 & -2.2745 & 0.027648 & 0.013824 \tabularnewline
t & -0.104529017759257 & 0.053261 & -1.9626 & 0.055761 & 0.02788 \tabularnewline
\hline
\end{tabular}
%Source: https://freestatistics.org/blog/index.php?pk=59015&T=2

[TABLE]
[ROW][C]Multiple Linear Regression - Ordinary Least Squares[/C][/ROW]
[ROW][C]Variable[/C][C]Parameter[/C][C]S.D.[/C][C]T-STATH0: parameter = 0[/C][C]2-tail p-value[/C][C]1-tail p-value[/C][/ROW]
[ROW][C](Intercept)[/C][C]46.4146793383104[/C][C]19.953483[/C][C]2.3261[/C][C]0.024472[/C][C]0.012236[/C][/ROW]
[ROW][C]Tip[/C][C]0.746503234894817[/C][C]0.210242[/C][C]3.5507[/C][C]0.000899[/C][C]0.00045[/C][/ROW]
[ROW][C]M1[/C][C]-0.892302272677017[/C][C]3.154317[/C][C]-0.2829[/C][C]0.778536[/C][C]0.389268[/C][/ROW]
[ROW][C]M2[/C][C]-5.13511571343774[/C][C]3.15061[/C][C]-1.6299[/C][C]0.109957[/C][C]0.054978[/C][/ROW]
[ROW][C]M3[/C][C]-4.30778629079102[/C][C]4.095137[/C][C]-1.0519[/C][C]0.298328[/C][C]0.149164[/C][/ROW]
[ROW][C]M4[/C][C]-5.54756016461321[/C][C]3.24736[/C][C]-1.7083[/C][C]0.094316[/C][C]0.047158[/C][/ROW]
[ROW][C]M5[/C][C]-5.90470959410443[/C][C]3.211719[/C][C]-1.8385[/C][C]0.072452[/C][C]0.036226[/C][/ROW]
[ROW][C]M6[/C][C]-9.70605214891858[/C][C]4.136587[/C][C]-2.3464[/C][C]0.02332[/C][C]0.01166[/C][/ROW]
[ROW][C]M7[/C][C]8.80895968214796[/C][C]4.149407[/C][C]2.1229[/C][C]0.039171[/C][C]0.019586[/C][/ROW]
[ROW][C]M8[/C][C]-2.01409591346731[/C][C]3.171649[/C][C]-0.635[/C][C]0.528554[/C][C]0.264277[/C][/ROW]
[ROW][C]M9[/C][C]-9.6705069071819[/C][C]4.134973[/C][C]-2.3387[/C][C]0.023751[/C][C]0.011875[/C][/ROW]
[ROW][C]M10[/C][C]-11.1242994421722[/C][C]4.175721[/C][C]-2.664[/C][C]0.010609[/C][C]0.005305[/C][/ROW]
[ROW][C]M11[/C][C]-7.88526146792929[/C][C]3.466862[/C][C]-2.2745[/C][C]0.027648[/C][C]0.013824[/C][/ROW]
[ROW][C]t[/C][C]-0.104529017759257[/C][C]0.053261[/C][C]-1.9626[/C][C]0.055761[/C][C]0.02788[/C][/ROW]
[/TABLE]
Source: https://freestatistics.org/blog/index.php?pk=59015&T=2

Globally Unique Identifier (entire table): ba.freestatistics.org/blog/index.php?pk=59015&T=2

As an alternative you can also use a QR Code:  

The GUIDs for individual cells are displayed in the table below:

Multiple Linear Regression - Ordinary Least Squares
VariableParameterS.D.T-STATH0: parameter = 02-tail p-value1-tail p-value
(Intercept)46.414679338310419.9534832.32610.0244720.012236
Tip0.7465032348948170.2102423.55070.0008990.00045
M1-0.8923022726770173.154317-0.28290.7785360.389268
M2-5.135115713437743.15061-1.62990.1099570.054978
M3-4.307786290791024.095137-1.05190.2983280.149164
M4-5.547560164613213.24736-1.70830.0943160.047158
M5-5.904709594104433.211719-1.83850.0724520.036226
M6-9.706052148918584.136587-2.34640.023320.01166
M78.808959682147964.1494072.12290.0391710.019586
M8-2.014095913467313.171649-0.6350.5285540.264277
M9-9.67050690718194.134973-2.33870.0237510.011875
M10-11.12429944217224.175721-2.6640.0106090.005305
M11-7.885261467929293.466862-2.27450.0276480.013824
t-0.1045290177592570.053261-1.96260.0557610.02788


Multiple Linear Regression - Regression Statistics
Multiple R0.61415688381946
R-squared0.377188677942829
Adjusted R-squared0.201176782578846
F-TEST (value)2.14297265058605
F-TEST (DF numerator)13
F-TEST (DF denominator)46
p-value0.0291661287439557
Multiple Linear Regression - Residual Statistics
Residual Standard Deviation4.94401772121584
Sum Squared Residuals1124.39231647403

\begin{tabular}{lllllllll}
\hline
Multiple Linear Regression - Regression Statistics \tabularnewline
Multiple R & 0.61415688381946 \tabularnewline
R-squared & 0.377188677942829 \tabularnewline
Adjusted R-squared & 0.201176782578846 \tabularnewline
F-TEST (value) & 2.14297265058605 \tabularnewline
F-TEST (DF numerator) & 13 \tabularnewline
F-TEST (DF denominator) & 46 \tabularnewline
p-value & 0.0291661287439557 \tabularnewline
Multiple Linear Regression - Residual Statistics \tabularnewline
Residual Standard Deviation & 4.94401772121584 \tabularnewline
Sum Squared Residuals & 1124.39231647403 \tabularnewline
\hline
\end{tabular}
%Source: https://freestatistics.org/blog/index.php?pk=59015&T=3

[TABLE]
[ROW][C]Multiple Linear Regression - Regression Statistics[/C][/ROW]
[ROW][C]Multiple R[/C][C]0.61415688381946[/C][/ROW]
[ROW][C]R-squared[/C][C]0.377188677942829[/C][/ROW]
[ROW][C]Adjusted R-squared[/C][C]0.201176782578846[/C][/ROW]
[ROW][C]F-TEST (value)[/C][C]2.14297265058605[/C][/ROW]
[ROW][C]F-TEST (DF numerator)[/C][C]13[/C][/ROW]
[ROW][C]F-TEST (DF denominator)[/C][C]46[/C][/ROW]
[ROW][C]p-value[/C][C]0.0291661287439557[/C][/ROW]
[ROW][C]Multiple Linear Regression - Residual Statistics[/C][/ROW]
[ROW][C]Residual Standard Deviation[/C][C]4.94401772121584[/C][/ROW]
[ROW][C]Sum Squared Residuals[/C][C]1124.39231647403[/C][/ROW]
[/TABLE]
Source: https://freestatistics.org/blog/index.php?pk=59015&T=3

Globally Unique Identifier (entire table): ba.freestatistics.org/blog/index.php?pk=59015&T=3

As an alternative you can also use a QR Code:  

The GUIDs for individual cells are displayed in the table below:

Multiple Linear Regression - Regression Statistics
Multiple R0.61415688381946
R-squared0.377188677942829
Adjusted R-squared0.201176782578846
F-TEST (value)2.14297265058605
F-TEST (DF numerator)13
F-TEST (DF denominator)46
p-value0.0291661287439557
Multiple Linear Regression - Residual Statistics
Residual Standard Deviation4.94401772121584
Sum Squared Residuals1124.39231647403


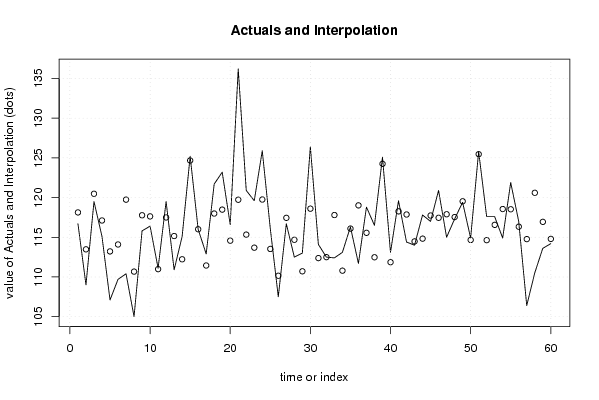
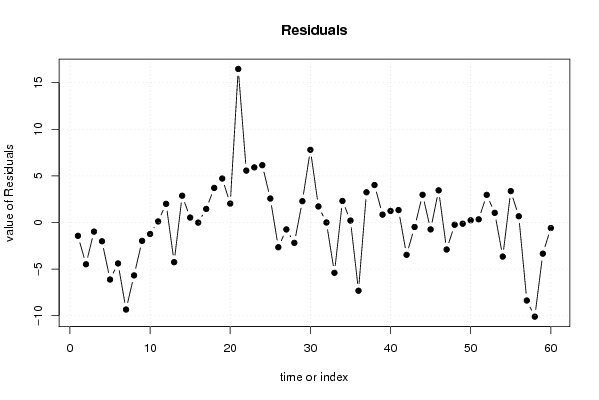
Multiple Linear Regression - Actuals, Interpolation, and Residuals
Time or IndexActualsInterpolationForecastResidualsPrediction Error
1116.7118.127263126630-1.42726312662984
2109113.481319374152-4.48131937415151
3119.5120.474746952155-0.974746952155375
4115.1117.114885326358-2.01488532635793
5107.1113.219291998591-6.11929199859128
6109.7114.091041129345-4.3910411293447
7110.4119.736318625951-9.33631862595064
8105110.674992099813-5.67499209981315
9115.8117.769466462746-1.96946646274613
10116.4117.629501056297-1.22950105629677
11111.1110.9848176356580.115182364341702
12119.5117.4964945865072.00350541349286
13110.9115.155957473260-4.25595747326019
14115.1112.2269711610402.87302883895962
15125.2124.6698723537760.530127646223556
16116116.009837760226-0.00983776022580646
17112.9111.4423915210541.45760847894617
18121.7117.9875652370083.71243476299214
19123.2118.4819704128404.71802958716045
20116.6114.5715162074762.02848379252370
21136.2119.72508215968316.4749178403172
22120.9115.3300483143335.56995168566706
23119.6113.6869365674905.91306343251025
24125.9119.7507115774026.14928842259831
25116.1113.5283576427022.57164235729829
26107.5110.151469389545-2.65146938954499
27116.7117.443498261507-0.743498261506833
28112.5114.680839223625-2.18083922362524
29113110.7105955723692.28940442763088
30126.4118.5994751111347.80052488886619
31114.1112.3753511729121.72464882708782
32112.5112.4960144359810.00398556401908479
33112.4117.798881035166-5.39888103516634
34113.1110.7910858676852.30891413231532
35116.3116.0904542053630.209545794636744
36111.7119.018915628717-7.31891562871698
37118.8115.5586236631283.24137633687218
38116.5112.4803367039294.01966329607097
39125.1124.2513849852600.848615014740228
40113.1111.8588342172351.24116578276495
41119.6118.2649855310171.33501446898312
42114.4117.867679162449-3.46767916244909
43114114.480267516828-0.480267516827762
44117.8114.8248817503652.97511824963505
45117117.738937997887-0.738937997886962
46120.9117.4496719444593.45032805554136
47115117.896769255321-2.89676925532093
48117.3117.540616445137-0.24061644513746
49119.4119.529798094280-0.129798094280441
50114.9114.6599033713340.240096628665911
51125.8125.4604974473020.339502552698423
52117.6114.6356034725562.96439652744403
53117.6116.5627353769691.03726462303110
54114.9118.554239360065-3.65423936006454
55121.9118.526092271473.37390772853014
56117116.3325955063650.66740449363531
57106.4114.767632344518-8.3676323445178
58110.5120.599692817227-10.0996928172270
59113.6116.941022336168-3.34102233616777
60114.2114.793261762237-0.59326176223674

\begin{tabular}{lllllllll}
\hline
Multiple Linear Regression - Actuals, Interpolation, and Residuals \tabularnewline
Time or Index & Actuals & InterpolationForecast & ResidualsPrediction Error \tabularnewline
1 & 116.7 & 118.127263126630 & -1.42726312662984 \tabularnewline
2 & 109 & 113.481319374152 & -4.48131937415151 \tabularnewline
3 & 119.5 & 120.474746952155 & -0.974746952155375 \tabularnewline
4 & 115.1 & 117.114885326358 & -2.01488532635793 \tabularnewline
5 & 107.1 & 113.219291998591 & -6.11929199859128 \tabularnewline
6 & 109.7 & 114.091041129345 & -4.3910411293447 \tabularnewline
7 & 110.4 & 119.736318625951 & -9.33631862595064 \tabularnewline
8 & 105 & 110.674992099813 & -5.67499209981315 \tabularnewline
9 & 115.8 & 117.769466462746 & -1.96946646274613 \tabularnewline
10 & 116.4 & 117.629501056297 & -1.22950105629677 \tabularnewline
11 & 111.1 & 110.984817635658 & 0.115182364341702 \tabularnewline
12 & 119.5 & 117.496494586507 & 2.00350541349286 \tabularnewline
13 & 110.9 & 115.155957473260 & -4.25595747326019 \tabularnewline
14 & 115.1 & 112.226971161040 & 2.87302883895962 \tabularnewline
15 & 125.2 & 124.669872353776 & 0.530127646223556 \tabularnewline
16 & 116 & 116.009837760226 & -0.00983776022580646 \tabularnewline
17 & 112.9 & 111.442391521054 & 1.45760847894617 \tabularnewline
18 & 121.7 & 117.987565237008 & 3.71243476299214 \tabularnewline
19 & 123.2 & 118.481970412840 & 4.71802958716045 \tabularnewline
20 & 116.6 & 114.571516207476 & 2.02848379252370 \tabularnewline
21 & 136.2 & 119.725082159683 & 16.4749178403172 \tabularnewline
22 & 120.9 & 115.330048314333 & 5.56995168566706 \tabularnewline
23 & 119.6 & 113.686936567490 & 5.91306343251025 \tabularnewline
24 & 125.9 & 119.750711577402 & 6.14928842259831 \tabularnewline
25 & 116.1 & 113.528357642702 & 2.57164235729829 \tabularnewline
26 & 107.5 & 110.151469389545 & -2.65146938954499 \tabularnewline
27 & 116.7 & 117.443498261507 & -0.743498261506833 \tabularnewline
28 & 112.5 & 114.680839223625 & -2.18083922362524 \tabularnewline
29 & 113 & 110.710595572369 & 2.28940442763088 \tabularnewline
30 & 126.4 & 118.599475111134 & 7.80052488886619 \tabularnewline
31 & 114.1 & 112.375351172912 & 1.72464882708782 \tabularnewline
32 & 112.5 & 112.496014435981 & 0.00398556401908479 \tabularnewline
33 & 112.4 & 117.798881035166 & -5.39888103516634 \tabularnewline
34 & 113.1 & 110.791085867685 & 2.30891413231532 \tabularnewline
35 & 116.3 & 116.090454205363 & 0.209545794636744 \tabularnewline
36 & 111.7 & 119.018915628717 & -7.31891562871698 \tabularnewline
37 & 118.8 & 115.558623663128 & 3.24137633687218 \tabularnewline
38 & 116.5 & 112.480336703929 & 4.01966329607097 \tabularnewline
39 & 125.1 & 124.251384985260 & 0.848615014740228 \tabularnewline
40 & 113.1 & 111.858834217235 & 1.24116578276495 \tabularnewline
41 & 119.6 & 118.264985531017 & 1.33501446898312 \tabularnewline
42 & 114.4 & 117.867679162449 & -3.46767916244909 \tabularnewline
43 & 114 & 114.480267516828 & -0.480267516827762 \tabularnewline
44 & 117.8 & 114.824881750365 & 2.97511824963505 \tabularnewline
45 & 117 & 117.738937997887 & -0.738937997886962 \tabularnewline
46 & 120.9 & 117.449671944459 & 3.45032805554136 \tabularnewline
47 & 115 & 117.896769255321 & -2.89676925532093 \tabularnewline
48 & 117.3 & 117.540616445137 & -0.24061644513746 \tabularnewline
49 & 119.4 & 119.529798094280 & -0.129798094280441 \tabularnewline
50 & 114.9 & 114.659903371334 & 0.240096628665911 \tabularnewline
51 & 125.8 & 125.460497447302 & 0.339502552698423 \tabularnewline
52 & 117.6 & 114.635603472556 & 2.96439652744403 \tabularnewline
53 & 117.6 & 116.562735376969 & 1.03726462303110 \tabularnewline
54 & 114.9 & 118.554239360065 & -3.65423936006454 \tabularnewline
55 & 121.9 & 118.52609227147 & 3.37390772853014 \tabularnewline
56 & 117 & 116.332595506365 & 0.66740449363531 \tabularnewline
57 & 106.4 & 114.767632344518 & -8.3676323445178 \tabularnewline
58 & 110.5 & 120.599692817227 & -10.0996928172270 \tabularnewline
59 & 113.6 & 116.941022336168 & -3.34102233616777 \tabularnewline
60 & 114.2 & 114.793261762237 & -0.59326176223674 \tabularnewline
\hline
\end{tabular}
%Source: https://freestatistics.org/blog/index.php?pk=59015&T=4

[TABLE]
[ROW][C]Multiple Linear Regression - Actuals, Interpolation, and Residuals[/C][/ROW]
[ROW][C]Time or Index[/C][C]Actuals[/C][C]InterpolationForecast[/C][C]ResidualsPrediction Error[/C][/ROW]
[ROW][C]1[/C][C]116.7[/C][C]118.127263126630[/C][C]-1.42726312662984[/C][/ROW]
[ROW][C]2[/C][C]109[/C][C]113.481319374152[/C][C]-4.48131937415151[/C][/ROW]
[ROW][C]3[/C][C]119.5[/C][C]120.474746952155[/C][C]-0.974746952155375[/C][/ROW]
[ROW][C]4[/C][C]115.1[/C][C]117.114885326358[/C][C]-2.01488532635793[/C][/ROW]
[ROW][C]5[/C][C]107.1[/C][C]113.219291998591[/C][C]-6.11929199859128[/C][/ROW]
[ROW][C]6[/C][C]109.7[/C][C]114.091041129345[/C][C]-4.3910411293447[/C][/ROW]
[ROW][C]7[/C][C]110.4[/C][C]119.736318625951[/C][C]-9.33631862595064[/C][/ROW]
[ROW][C]8[/C][C]105[/C][C]110.674992099813[/C][C]-5.67499209981315[/C][/ROW]
[ROW][C]9[/C][C]115.8[/C][C]117.769466462746[/C][C]-1.96946646274613[/C][/ROW]
[ROW][C]10[/C][C]116.4[/C][C]117.629501056297[/C][C]-1.22950105629677[/C][/ROW]
[ROW][C]11[/C][C]111.1[/C][C]110.984817635658[/C][C]0.115182364341702[/C][/ROW]
[ROW][C]12[/C][C]119.5[/C][C]117.496494586507[/C][C]2.00350541349286[/C][/ROW]
[ROW][C]13[/C][C]110.9[/C][C]115.155957473260[/C][C]-4.25595747326019[/C][/ROW]
[ROW][C]14[/C][C]115.1[/C][C]112.226971161040[/C][C]2.87302883895962[/C][/ROW]
[ROW][C]15[/C][C]125.2[/C][C]124.669872353776[/C][C]0.530127646223556[/C][/ROW]
[ROW][C]16[/C][C]116[/C][C]116.009837760226[/C][C]-0.00983776022580646[/C][/ROW]
[ROW][C]17[/C][C]112.9[/C][C]111.442391521054[/C][C]1.45760847894617[/C][/ROW]
[ROW][C]18[/C][C]121.7[/C][C]117.987565237008[/C][C]3.71243476299214[/C][/ROW]
[ROW][C]19[/C][C]123.2[/C][C]118.481970412840[/C][C]4.71802958716045[/C][/ROW]
[ROW][C]20[/C][C]116.6[/C][C]114.571516207476[/C][C]2.02848379252370[/C][/ROW]
[ROW][C]21[/C][C]136.2[/C][C]119.725082159683[/C][C]16.4749178403172[/C][/ROW]
[ROW][C]22[/C][C]120.9[/C][C]115.330048314333[/C][C]5.56995168566706[/C][/ROW]
[ROW][C]23[/C][C]119.6[/C][C]113.686936567490[/C][C]5.91306343251025[/C][/ROW]
[ROW][C]24[/C][C]125.9[/C][C]119.750711577402[/C][C]6.14928842259831[/C][/ROW]
[ROW][C]25[/C][C]116.1[/C][C]113.528357642702[/C][C]2.57164235729829[/C][/ROW]
[ROW][C]26[/C][C]107.5[/C][C]110.151469389545[/C][C]-2.65146938954499[/C][/ROW]
[ROW][C]27[/C][C]116.7[/C][C]117.443498261507[/C][C]-0.743498261506833[/C][/ROW]
[ROW][C]28[/C][C]112.5[/C][C]114.680839223625[/C][C]-2.18083922362524[/C][/ROW]
[ROW][C]29[/C][C]113[/C][C]110.710595572369[/C][C]2.28940442763088[/C][/ROW]
[ROW][C]30[/C][C]126.4[/C][C]118.599475111134[/C][C]7.80052488886619[/C][/ROW]
[ROW][C]31[/C][C]114.1[/C][C]112.375351172912[/C][C]1.72464882708782[/C][/ROW]
[ROW][C]32[/C][C]112.5[/C][C]112.496014435981[/C][C]0.00398556401908479[/C][/ROW]
[ROW][C]33[/C][C]112.4[/C][C]117.798881035166[/C][C]-5.39888103516634[/C][/ROW]
[ROW][C]34[/C][C]113.1[/C][C]110.791085867685[/C][C]2.30891413231532[/C][/ROW]
[ROW][C]35[/C][C]116.3[/C][C]116.090454205363[/C][C]0.209545794636744[/C][/ROW]
[ROW][C]36[/C][C]111.7[/C][C]119.018915628717[/C][C]-7.31891562871698[/C][/ROW]
[ROW][C]37[/C][C]118.8[/C][C]115.558623663128[/C][C]3.24137633687218[/C][/ROW]
[ROW][C]38[/C][C]116.5[/C][C]112.480336703929[/C][C]4.01966329607097[/C][/ROW]
[ROW][C]39[/C][C]125.1[/C][C]124.251384985260[/C][C]0.848615014740228[/C][/ROW]
[ROW][C]40[/C][C]113.1[/C][C]111.858834217235[/C][C]1.24116578276495[/C][/ROW]
[ROW][C]41[/C][C]119.6[/C][C]118.264985531017[/C][C]1.33501446898312[/C][/ROW]
[ROW][C]42[/C][C]114.4[/C][C]117.867679162449[/C][C]-3.46767916244909[/C][/ROW]
[ROW][C]43[/C][C]114[/C][C]114.480267516828[/C][C]-0.480267516827762[/C][/ROW]
[ROW][C]44[/C][C]117.8[/C][C]114.824881750365[/C][C]2.97511824963505[/C][/ROW]
[ROW][C]45[/C][C]117[/C][C]117.738937997887[/C][C]-0.738937997886962[/C][/ROW]
[ROW][C]46[/C][C]120.9[/C][C]117.449671944459[/C][C]3.45032805554136[/C][/ROW]
[ROW][C]47[/C][C]115[/C][C]117.896769255321[/C][C]-2.89676925532093[/C][/ROW]
[ROW][C]48[/C][C]117.3[/C][C]117.540616445137[/C][C]-0.24061644513746[/C][/ROW]
[ROW][C]49[/C][C]119.4[/C][C]119.529798094280[/C][C]-0.129798094280441[/C][/ROW]
[ROW][C]50[/C][C]114.9[/C][C]114.659903371334[/C][C]0.240096628665911[/C][/ROW]
[ROW][C]51[/C][C]125.8[/C][C]125.460497447302[/C][C]0.339502552698423[/C][/ROW]
[ROW][C]52[/C][C]117.6[/C][C]114.635603472556[/C][C]2.96439652744403[/C][/ROW]
[ROW][C]53[/C][C]117.6[/C][C]116.562735376969[/C][C]1.03726462303110[/C][/ROW]
[ROW][C]54[/C][C]114.9[/C][C]118.554239360065[/C][C]-3.65423936006454[/C][/ROW]
[ROW][C]55[/C][C]121.9[/C][C]118.52609227147[/C][C]3.37390772853014[/C][/ROW]
[ROW][C]56[/C][C]117[/C][C]116.332595506365[/C][C]0.66740449363531[/C][/ROW]
[ROW][C]57[/C][C]106.4[/C][C]114.767632344518[/C][C]-8.3676323445178[/C][/ROW]
[ROW][C]58[/C][C]110.5[/C][C]120.599692817227[/C][C]-10.0996928172270[/C][/ROW]
[ROW][C]59[/C][C]113.6[/C][C]116.941022336168[/C][C]-3.34102233616777[/C][/ROW]
[ROW][C]60[/C][C]114.2[/C][C]114.793261762237[/C][C]-0.59326176223674[/C][/ROW]
[/TABLE]
Source: https://freestatistics.org/blog/index.php?pk=59015&T=4

Globally Unique Identifier (entire table): ba.freestatistics.org/blog/index.php?pk=59015&T=4

As an alternative you can also use a QR Code:  

The GUIDs for individual cells are displayed in the table below:

Multiple Linear Regression - Actuals, Interpolation, and Residuals
Time or IndexActualsInterpolationForecastResidualsPrediction Error
1116.7118.127263126630-1.42726312662984
2109113.481319374152-4.48131937415151
3119.5120.474746952155-0.974746952155375
4115.1117.114885326358-2.01488532635793
5107.1113.219291998591-6.11929199859128
6109.7114.091041129345-4.3910411293447
7110.4119.736318625951-9.33631862595064
8105110.674992099813-5.67499209981315
9115.8117.769466462746-1.96946646274613
10116.4117.629501056297-1.22950105629677
11111.1110.9848176356580.115182364341702
12119.5117.4964945865072.00350541349286
13110.9115.155957473260-4.25595747326019
14115.1112.2269711610402.87302883895962
15125.2124.6698723537760.530127646223556
16116116.009837760226-0.00983776022580646
17112.9111.4423915210541.45760847894617
18121.7117.9875652370083.71243476299214
19123.2118.4819704128404.71802958716045
20116.6114.5715162074762.02848379252370
21136.2119.72508215968316.4749178403172
22120.9115.3300483143335.56995168566706
23119.6113.6869365674905.91306343251025
24125.9119.7507115774026.14928842259831
25116.1113.5283576427022.57164235729829
26107.5110.151469389545-2.65146938954499
27116.7117.443498261507-0.743498261506833
28112.5114.680839223625-2.18083922362524
29113110.7105955723692.28940442763088
30126.4118.5994751111347.80052488886619
31114.1112.3753511729121.72464882708782
32112.5112.4960144359810.00398556401908479
33112.4117.798881035166-5.39888103516634
34113.1110.7910858676852.30891413231532
35116.3116.0904542053630.209545794636744
36111.7119.018915628717-7.31891562871698
37118.8115.5586236631283.24137633687218
38116.5112.4803367039294.01966329607097
39125.1124.2513849852600.848615014740228
40113.1111.8588342172351.24116578276495
41119.6118.2649855310171.33501446898312
42114.4117.867679162449-3.46767916244909
43114114.480267516828-0.480267516827762
44117.8114.8248817503652.97511824963505
45117117.738937997887-0.738937997886962
46120.9117.4496719444593.45032805554136
47115117.896769255321-2.89676925532093
48117.3117.540616445137-0.24061644513746
49119.4119.529798094280-0.129798094280441
50114.9114.6599033713340.240096628665911
51125.8125.4604974473020.339502552698423
52117.6114.6356034725562.96439652744403
53117.6116.5627353769691.03726462303110
54114.9118.554239360065-3.65423936006454
55121.9118.526092271473.37390772853014
56117116.3325955063650.66740449363531
57106.4114.767632344518-8.3676323445178
58110.5120.599692817227-10.0996928172270
59113.6116.941022336168-3.34102233616777
60114.2114.793261762237-0.59326176223674


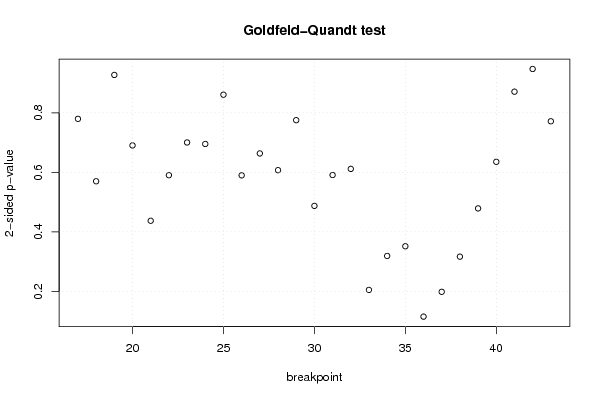
Goldfeld-Quandt test for Heteroskedasticity
p-valuesAlternative Hypothesis
breakpoint indexgreater2-sidedless
170.3897958457577980.7795916915155970.610204154242202
180.2849677201969600.5699354403939210.71503227980304
190.4635850883339790.9271701766679570.536414911666021
200.3451863583457150.690372716691430.654813641654285
210.7813738301570160.4372523396859680.218626169842984
220.7048866272536790.5902267454926420.295113372746321
230.6498761986409930.7002476027180130.350123801359007
240.6523587306313090.6952825387373830.347641269368691
250.569626515143320.860746969713360.43037348485668
260.7050780129257970.5898439741484060.294921987074203
270.6682814415781580.6634371168436850.331718558421842
280.6963912617644480.6072174764711040.303608738235552
290.6124182190399530.7751635619200950.387581780960047
300.7563928540436420.4872142919127170.243607145956358
310.7045756855423240.5908486289153510.295424314457676
320.6942550676486840.6114898647026330.305744932351316
330.8975610760752070.2048778478495860.102438923924793
340.8404863652841540.3190272694316920.159513634715846
350.8242331296341220.3515337407317550.175766870365878
360.9424515233281380.1150969533437230.0575484766718617
370.9007201162549060.1985597674901880.0992798837450942
380.841642916481190.3167141670376210.158357083518810
390.7606107987078630.4787784025842730.239389201292137
400.6823663020265350.635267395946930.317633697973465
410.5645712121177430.8708575757645140.435428787882257
420.4736243829850580.9472487659701170.526375617014942
430.6142792271245040.7714415457509930.385720772875496

\begin{tabular}{lllllllll}
\hline
Goldfeld-Quandt test for Heteroskedasticity \tabularnewline
p-values & Alternative Hypothesis \tabularnewline
breakpoint index & greater & 2-sided & less \tabularnewline
17 & 0.389795845757798 & 0.779591691515597 & 0.610204154242202 \tabularnewline
18 & 0.284967720196960 & 0.569935440393921 & 0.71503227980304 \tabularnewline
19 & 0.463585088333979 & 0.927170176667957 & 0.536414911666021 \tabularnewline
20 & 0.345186358345715 & 0.69037271669143 & 0.654813641654285 \tabularnewline
21 & 0.781373830157016 & 0.437252339685968 & 0.218626169842984 \tabularnewline
22 & 0.704886627253679 & 0.590226745492642 & 0.295113372746321 \tabularnewline
23 & 0.649876198640993 & 0.700247602718013 & 0.350123801359007 \tabularnewline
24 & 0.652358730631309 & 0.695282538737383 & 0.347641269368691 \tabularnewline
25 & 0.56962651514332 & 0.86074696971336 & 0.43037348485668 \tabularnewline
26 & 0.705078012925797 & 0.589843974148406 & 0.294921987074203 \tabularnewline
27 & 0.668281441578158 & 0.663437116843685 & 0.331718558421842 \tabularnewline
28 & 0.696391261764448 & 0.607217476471104 & 0.303608738235552 \tabularnewline
29 & 0.612418219039953 & 0.775163561920095 & 0.387581780960047 \tabularnewline
30 & 0.756392854043642 & 0.487214291912717 & 0.243607145956358 \tabularnewline
31 & 0.704575685542324 & 0.590848628915351 & 0.295424314457676 \tabularnewline
32 & 0.694255067648684 & 0.611489864702633 & 0.305744932351316 \tabularnewline
33 & 0.897561076075207 & 0.204877847849586 & 0.102438923924793 \tabularnewline
34 & 0.840486365284154 & 0.319027269431692 & 0.159513634715846 \tabularnewline
35 & 0.824233129634122 & 0.351533740731755 & 0.175766870365878 \tabularnewline
36 & 0.942451523328138 & 0.115096953343723 & 0.0575484766718617 \tabularnewline
37 & 0.900720116254906 & 0.198559767490188 & 0.0992798837450942 \tabularnewline
38 & 0.84164291648119 & 0.316714167037621 & 0.158357083518810 \tabularnewline
39 & 0.760610798707863 & 0.478778402584273 & 0.239389201292137 \tabularnewline
40 & 0.682366302026535 & 0.63526739594693 & 0.317633697973465 \tabularnewline
41 & 0.564571212117743 & 0.870857575764514 & 0.435428787882257 \tabularnewline
42 & 0.473624382985058 & 0.947248765970117 & 0.526375617014942 \tabularnewline
43 & 0.614279227124504 & 0.771441545750993 & 0.385720772875496 \tabularnewline
\hline
\end{tabular}
%Source: https://freestatistics.org/blog/index.php?pk=59015&T=5

[TABLE]
[ROW][C]Goldfeld-Quandt test for Heteroskedasticity[/C][/ROW]
[ROW][C]p-values[/C][C]Alternative Hypothesis[/C][/ROW]
[ROW][C]breakpoint index[/C][C]greater[/C][C]2-sided[/C][C]less[/C][/ROW]
[ROW][C]17[/C][C]0.389795845757798[/C][C]0.779591691515597[/C][C]0.610204154242202[/C][/ROW]
[ROW][C]18[/C][C]0.284967720196960[/C][C]0.569935440393921[/C][C]0.71503227980304[/C][/ROW]
[ROW][C]19[/C][C]0.463585088333979[/C][C]0.927170176667957[/C][C]0.536414911666021[/C][/ROW]
[ROW][C]20[/C][C]0.345186358345715[/C][C]0.69037271669143[/C][C]0.654813641654285[/C][/ROW]
[ROW][C]21[/C][C]0.781373830157016[/C][C]0.437252339685968[/C][C]0.218626169842984[/C][/ROW]
[ROW][C]22[/C][C]0.704886627253679[/C][C]0.590226745492642[/C][C]0.295113372746321[/C][/ROW]
[ROW][C]23[/C][C]0.649876198640993[/C][C]0.700247602718013[/C][C]0.350123801359007[/C][/ROW]
[ROW][C]24[/C][C]0.652358730631309[/C][C]0.695282538737383[/C][C]0.347641269368691[/C][/ROW]
[ROW][C]25[/C][C]0.56962651514332[/C][C]0.86074696971336[/C][C]0.43037348485668[/C][/ROW]
[ROW][C]26[/C][C]0.705078012925797[/C][C]0.589843974148406[/C][C]0.294921987074203[/C][/ROW]
[ROW][C]27[/C][C]0.668281441578158[/C][C]0.663437116843685[/C][C]0.331718558421842[/C][/ROW]
[ROW][C]28[/C][C]0.696391261764448[/C][C]0.607217476471104[/C][C]0.303608738235552[/C][/ROW]
[ROW][C]29[/C][C]0.612418219039953[/C][C]0.775163561920095[/C][C]0.387581780960047[/C][/ROW]
[ROW][C]30[/C][C]0.756392854043642[/C][C]0.487214291912717[/C][C]0.243607145956358[/C][/ROW]
[ROW][C]31[/C][C]0.704575685542324[/C][C]0.590848628915351[/C][C]0.295424314457676[/C][/ROW]
[ROW][C]32[/C][C]0.694255067648684[/C][C]0.611489864702633[/C][C]0.305744932351316[/C][/ROW]
[ROW][C]33[/C][C]0.897561076075207[/C][C]0.204877847849586[/C][C]0.102438923924793[/C][/ROW]
[ROW][C]34[/C][C]0.840486365284154[/C][C]0.319027269431692[/C][C]0.159513634715846[/C][/ROW]
[ROW][C]35[/C][C]0.824233129634122[/C][C]0.351533740731755[/C][C]0.175766870365878[/C][/ROW]
[ROW][C]36[/C][C]0.942451523328138[/C][C]0.115096953343723[/C][C]0.0575484766718617[/C][/ROW]
[ROW][C]37[/C][C]0.900720116254906[/C][C]0.198559767490188[/C][C]0.0992798837450942[/C][/ROW]
[ROW][C]38[/C][C]0.84164291648119[/C][C]0.316714167037621[/C][C]0.158357083518810[/C][/ROW]
[ROW][C]39[/C][C]0.760610798707863[/C][C]0.478778402584273[/C][C]0.239389201292137[/C][/ROW]
[ROW][C]40[/C][C]0.682366302026535[/C][C]0.63526739594693[/C][C]0.317633697973465[/C][/ROW]
[ROW][C]41[/C][C]0.564571212117743[/C][C]0.870857575764514[/C][C]0.435428787882257[/C][/ROW]
[ROW][C]42[/C][C]0.473624382985058[/C][C]0.947248765970117[/C][C]0.526375617014942[/C][/ROW]
[ROW][C]43[/C][C]0.614279227124504[/C][C]0.771441545750993[/C][C]0.385720772875496[/C][/ROW]
[/TABLE]
Source: https://freestatistics.org/blog/index.php?pk=59015&T=5

Globally Unique Identifier (entire table): ba.freestatistics.org/blog/index.php?pk=59015&T=5

As an alternative you can also use a QR Code:  

The GUIDs for individual cells are displayed in the table below:

Goldfeld-Quandt test for Heteroskedasticity
p-valuesAlternative Hypothesis
breakpoint indexgreater2-sidedless
170.3897958457577980.7795916915155970.610204154242202
180.2849677201969600.5699354403939210.71503227980304
190.4635850883339790.9271701766679570.536414911666021
200.3451863583457150.690372716691430.654813641654285
210.7813738301570160.4372523396859680.218626169842984
220.7048866272536790.5902267454926420.295113372746321
230.6498761986409930.7002476027180130.350123801359007
240.6523587306313090.6952825387373830.347641269368691
250.569626515143320.860746969713360.43037348485668
260.7050780129257970.5898439741484060.294921987074203
270.6682814415781580.6634371168436850.331718558421842
280.6963912617644480.6072174764711040.303608738235552
290.6124182190399530.7751635619200950.387581780960047
300.7563928540436420.4872142919127170.243607145956358
310.7045756855423240.5908486289153510.295424314457676
320.6942550676486840.6114898647026330.305744932351316
330.8975610760752070.2048778478495860.102438923924793
340.8404863652841540.3190272694316920.159513634715846
350.8242331296341220.3515337407317550.175766870365878
360.9424515233281380.1150969533437230.0575484766718617
370.9007201162549060.1985597674901880.0992798837450942
380.841642916481190.3167141670376210.158357083518810
390.7606107987078630.4787784025842730.239389201292137
400.6823663020265350.635267395946930.317633697973465
410.5645712121177430.8708575757645140.435428787882257
420.4736243829850580.9472487659701170.526375617014942
430.6142792271245040.7714415457509930.385720772875496


Meta Analysis of Goldfeld-Quandt test for Heteroskedasticity
Description# significant tests% significant testsOK/NOK
1% type I error level00OK
5% type I error level00OK
10% type I error level00OK

\begin{tabular}{lllllllll}
\hline
Meta Analysis of Goldfeld-Quandt test for Heteroskedasticity \tabularnewline
Description & # significant tests & % significant tests & OK/NOK \tabularnewline
1% type I error level & 0 & 0 & OK \tabularnewline
5% type I error level & 0 & 0 & OK \tabularnewline
10% type I error level & 0 & 0 & OK \tabularnewline
\hline
\end{tabular}
%Source: https://freestatistics.org/blog/index.php?pk=59015&T=6

[TABLE]
[ROW][C]Meta Analysis of Goldfeld-Quandt test for Heteroskedasticity[/C][/ROW]
[ROW][C]Description[/C][C]# significant tests[/C][C]% significant tests[/C][C]OK/NOK[/C][/ROW]
[ROW][C]1% type I error level[/C][C]0[/C][C]0[/C][C]OK[/C][/ROW]
[ROW][C]5% type I error level[/C][C]0[/C][C]0[/C][C]OK[/C][/ROW]
[ROW][C]10% type I error level[/C][C]0[/C][C]0[/C][C]OK[/C][/ROW]
[/TABLE]
Source: https://freestatistics.org/blog/index.php?pk=59015&T=6

Globally Unique Identifier (entire table): ba.freestatistics.org/blog/index.php?pk=59015&T=6

As an alternative you can also use a QR Code:  

The GUIDs for individual cells are displayed in the table below:

Meta Analysis of Goldfeld-Quandt test for Heteroskedasticity
Description# significant tests% significant testsOK/NOK
1% type I error level00OK
5% type I error level00OK
10% type I error level00OK


Parameters (Session):
par1 = 2 ; par2 = Include Monthly Dummies ; par3 = Linear Trend ;
Parameters (R input):
par1 = 2 ; par2 = Include Monthly Dummies ; par3 = Linear Trend ;
R code (references can be found in the software module):
library(lattice)
library(lmtest)
n25 <- 25 #minimum number of obs. for Goldfeld-Quandt test
par1 <- as.numeric(par1)
x <- t(y)
k <- length(x[1,])
n <- length(x[,1])
x1 <- cbind(x[,par1], x[,1:k!=par1])
mycolnames <- c(colnames(x)[par1], colnames(x)[1:k!=par1])
colnames(x1) <- mycolnames #colnames(x)[par1]
x <- x1
if (par3 == 'First Differences'){
x2 <- array(0, dim=c(n-1,k), dimnames=list(1:(n-1), paste('(1-B)',colnames(x),sep='')))
for (i in 1:n-1) {
for (j in 1:k) {
x2[i,j] <- x[i+1,j] - x[i,j]
}
}
x <- x2
}
if (par2 == 'Include Monthly Dummies'){
x2 <- array(0, dim=c(n,11), dimnames=list(1:n, paste('M', seq(1:11), sep ='')))
for (i in 1:11){
x2[seq(i,n,12),i] <- 1
}
x <- cbind(x, x2)
}
if (par2 == 'Include Quarterly Dummies'){
x2 <- array(0, dim=c(n,3), dimnames=list(1:n, paste('Q', seq(1:3), sep ='')))
for (i in 1:3){
x2[seq(i,n,4),i] <- 1
}
x <- cbind(x, x2)
}
k <- length(x[1,])
if (par3 == 'Linear Trend'){
x <- cbind(x, c(1:n))
colnames(x)[k+1] <- 't'
}
x
k <- length(x[1,])
df <- as.data.frame(x)
(mylm <- lm(df))
(mysum <- summary(mylm))
if (n > n25) {
kp3 <- k + 3
nmkm3 <- n - k - 3
gqarr <- array(NA, dim=c(nmkm3-kp3+1,3))
numgqtests <- 0
numsignificant1 <- 0
numsignificant5 <- 0
numsignificant10 <- 0
for (mypoint in kp3:nmkm3) {
j <- 0
numgqtests <- numgqtests + 1
for (myalt in c('greater', 'two.sided', 'less')) {
j <- j + 1
gqarr[mypoint-kp3+1,j] <- gqtest(mylm, point=mypoint, alternative=myalt)$p.value
}
if (gqarr[mypoint-kp3+1,2] < 0.01) numsignificant1 <- numsignificant1 + 1
if (gqarr[mypoint-kp3+1,2] < 0.05) numsignificant5 <- numsignificant5 + 1
if (gqarr[mypoint-kp3+1,2] < 0.10) numsignificant10 <- numsignificant10 + 1
}
gqarr
}
bitmap(file='test0.png')
plot(x[,1], type='l', main='Actuals and Interpolation', ylab='value of Actuals and Interpolation (dots)', xlab='time or index')
points(x[,1]-mysum$resid)
grid()
dev.off()
bitmap(file='test1.png')
plot(mysum$resid, type='b', pch=19, main='Residuals', ylab='value of Residuals', xlab='time or index')
grid()
dev.off()
bitmap(file='test2.png')
hist(mysum$resid, main='Residual Histogram', xlab='values of Residuals')
grid()
dev.off()
bitmap(file='test3.png')
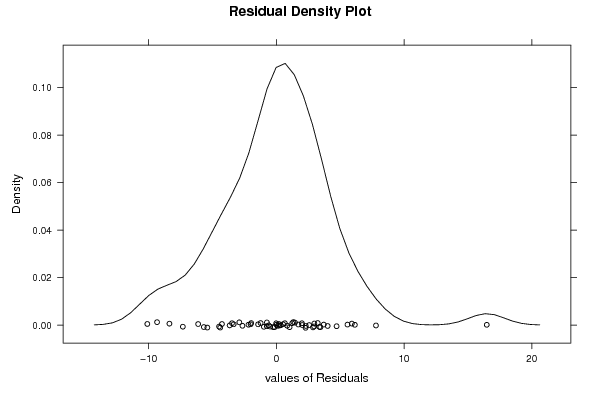
densityplot(~mysum$resid,col='black',main='Residual Density Plot', xlab='values of Residuals')
dev.off()
bitmap(file='test4.png')
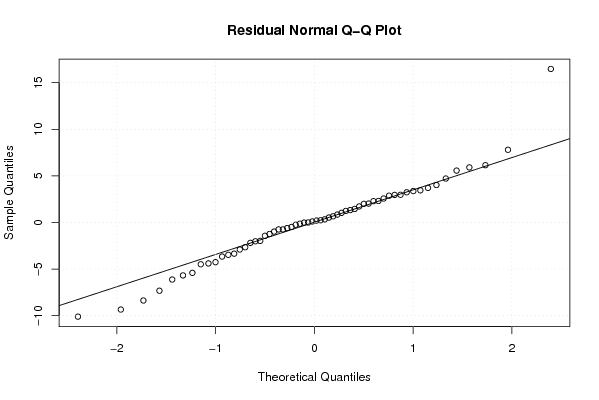
qqnorm(mysum$resid, main='Residual Normal Q-Q Plot')
qqline(mysum$resid)
grid()
dev.off()
(myerror <- as.ts(mysum$resid))
bitmap(file='test5.png')
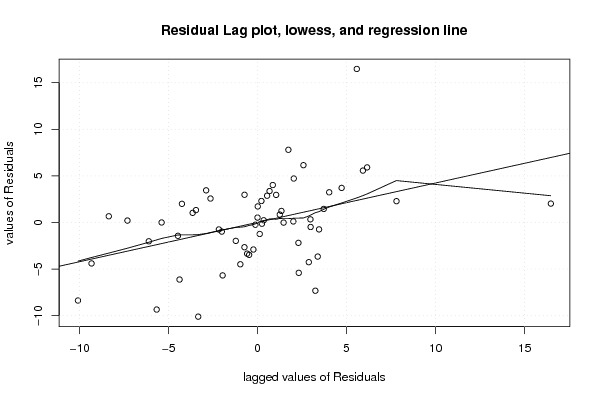
dum <- cbind(lag(myerror,k=1),myerror)
dum
dum1 <- dum[2:length(myerror),]
dum1
z <- as.data.frame(dum1)
z
plot(z,main=paste('Residual Lag plot, lowess, and regression line'), ylab='values of Residuals', xlab='lagged values of Residuals')
lines(lowess(z))
abline(lm(z))
grid()
dev.off()
bitmap(file='test6.png')
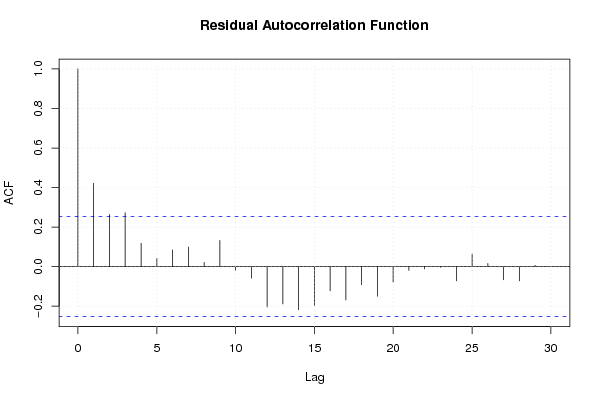
acf(mysum$resid, lag.max=length(mysum$resid)/2, main='Residual Autocorrelation Function')
grid()
dev.off()
bitmap(file='test7.png')
pacf(mysum$resid, lag.max=length(mysum$resid)/2, main='Residual Partial Autocorrelation Function')
grid()
dev.off()
bitmap(file='test8.png')
opar <- par(mfrow = c(2,2), oma = c(0, 0, 1.1, 0))
plot(mylm, las = 1, sub='Residual Diagnostics')
par(opar)
dev.off()
if (n > n25) {
bitmap(file='test9.png')
plot(kp3:nmkm3,gqarr[,2], main='Goldfeld-Quandt test',ylab='2-sided p-value',xlab='breakpoint')
grid()
dev.off()
}
load(file='createtable')
a<-table.start()
a<-table.row.start(a)
a<-table.element(a, 'Multiple Linear Regression - Estimated Regression Equation', 1, TRUE)
a<-table.row.end(a)
myeq <- colnames(x)[1]
myeq <- paste(myeq, '[t] = ', sep='')
for (i in 1:k){
if (mysum$coefficients[i,1] > 0) myeq <- paste(myeq, '+', '')
myeq <- paste(myeq, mysum$coefficients[i,1], sep=' ')
if (rownames(mysum$coefficients)[i] != '(Intercept)') {
myeq <- paste(myeq, rownames(mysum$coefficients)[i], sep='')
if (rownames(mysum$coefficients)[i] != 't') myeq <- paste(myeq, '[t]', sep='')
}
}
myeq <- paste(myeq, ' + e[t]')
a<-table.row.start(a)
a<-table.element(a, myeq)
a<-table.row.end(a)
a<-table.end(a)
table.save(a,file='mytable1.tab')
a<-table.start()
a<-table.row.start(a)
a<-table.element(a,hyperlink('ols1.htm','Multiple Linear Regression - Ordinary Least Squares',''), 6, TRUE)
a<-table.row.end(a)
a<-table.row.start(a)
a<-table.element(a,'Variable',header=TRUE)
a<-table.element(a,'Parameter',header=TRUE)
a<-table.element(a,'S.D.',header=TRUE)
a<-table.element(a,'T-STAT
H0: parameter = 0',header=TRUE)
a<-table.element(a,'2-tail p-value',header=TRUE)
a<-table.element(a,'1-tail p-value',header=TRUE)
a<-table.row.end(a)
for (i in 1:k){
a<-table.row.start(a)
a<-table.element(a,rownames(mysum$coefficients)[i],header=TRUE)
a<-table.element(a,mysum$coefficients[i,1])
a<-table.element(a, round(mysum$coefficients[i,2],6))
a<-table.element(a, round(mysum$coefficients[i,3],4))
a<-table.element(a, round(mysum$coefficients[i,4],6))
a<-table.element(a, round(mysum$coefficients[i,4]/2,6))
a<-table.row.end(a)
}
a<-table.end(a)
table.save(a,file='mytable2.tab')
a<-table.start()
a<-table.row.start(a)
a<-table.element(a, 'Multiple Linear Regression - Regression Statistics', 2, TRUE)
a<-table.row.end(a)
a<-table.row.start(a)
a<-table.element(a, 'Multiple R',1,TRUE)
a<-table.element(a, sqrt(mysum$r.squared))
a<-table.row.end(a)
a<-table.row.start(a)
a<-table.element(a, 'R-squared',1,TRUE)
a<-table.element(a, mysum$r.squared)
a<-table.row.end(a)
a<-table.row.start(a)
a<-table.element(a, 'Adjusted R-squared',1,TRUE)
a<-table.element(a, mysum$adj.r.squared)
a<-table.row.end(a)
a<-table.row.start(a)
a<-table.element(a, 'F-TEST (value)',1,TRUE)
a<-table.element(a, mysum$fstatistic[1])
a<-table.row.end(a)
a<-table.row.start(a)
a<-table.element(a, 'F-TEST (DF numerator)',1,TRUE)
a<-table.element(a, mysum$fstatistic[2])
a<-table.row.end(a)
a<-table.row.start(a)
a<-table.element(a, 'F-TEST (DF denominator)',1,TRUE)
a<-table.element(a, mysum$fstatistic[3])
a<-table.row.end(a)
a<-table.row.start(a)
a<-table.element(a, 'p-value',1,TRUE)
a<-table.element(a, 1-pf(mysum$fstatistic[1],mysum$fstatistic[2],mysum$fstatistic[3]))
a<-table.row.end(a)
a<-table.row.start(a)
a<-table.element(a, 'Multiple Linear Regression - Residual Statistics', 2, TRUE)
a<-table.row.end(a)
a<-table.row.start(a)
a<-table.element(a, 'Residual Standard Deviation',1,TRUE)
a<-table.element(a, mysum$sigma)
a<-table.row.end(a)
a<-table.row.start(a)
a<-table.element(a, 'Sum Squared Residuals',1,TRUE)
a<-table.element(a, sum(myerror*myerror))
a<-table.row.end(a)
a<-table.end(a)
table.save(a,file='mytable3.tab')
a<-table.start()
a<-table.row.start(a)
a<-table.element(a, 'Multiple Linear Regression - Actuals, Interpolation, and Residuals', 4, TRUE)
a<-table.row.end(a)
a<-table.row.start(a)
a<-table.element(a, 'Time or Index', 1, TRUE)
a<-table.element(a, 'Actuals', 1, TRUE)
a<-table.element(a, 'Interpolation
Forecast', 1, TRUE)
a<-table.element(a, 'Residuals
Prediction Error', 1, TRUE)
a<-table.row.end(a)
for (i in 1:n) {
a<-table.row.start(a)
a<-table.element(a,i, 1, TRUE)
a<-table.element(a,x[i])
a<-table.element(a,x[i]-mysum$resid[i])
a<-table.element(a,mysum$resid[i])
a<-table.row.end(a)
}
a<-table.end(a)
table.save(a,file='mytable4.tab')
if (n > n25) {
a<-table.start()
a<-table.row.start(a)
a<-table.element(a,'Goldfeld-Quandt test for Heteroskedasticity',4,TRUE)
a<-table.row.end(a)
a<-table.row.start(a)
a<-table.element(a,'p-values',header=TRUE)
a<-table.element(a,'Alternative Hypothesis',3,header=TRUE)
a<-table.row.end(a)
a<-table.row.start(a)
a<-table.element(a,'breakpoint index',header=TRUE)
a<-table.element(a,'greater',header=TRUE)
a<-table.element(a,'2-sided',header=TRUE)
a<-table.element(a,'less',header=TRUE)
a<-table.row.end(a)
for (mypoint in kp3:nmkm3) {
a<-table.row.start(a)
a<-table.element(a,mypoint,header=TRUE)
a<-table.element(a,gqarr[mypoint-kp3+1,1])
a<-table.element(a,gqarr[mypoint-kp3+1,2])
a<-table.element(a,gqarr[mypoint-kp3+1,3])
a<-table.row.end(a)
}
a<-table.end(a)
table.save(a,file='mytable5.tab')
a<-table.start()
a<-table.row.start(a)
a<-table.element(a,'Meta Analysis of Goldfeld-Quandt test for Heteroskedasticity',4,TRUE)
a<-table.row.end(a)
a<-table.row.start(a)
a<-table.element(a,'Description',header=TRUE)
a<-table.element(a,'# significant tests',header=TRUE)
a<-table.element(a,'% significant tests',header=TRUE)
a<-table.element(a,'OK/NOK',header=TRUE)
a<-table.row.end(a)
a<-table.row.start(a)
a<-table.element(a,'1% type I error level',header=TRUE)
a<-table.element(a,numsignificant1)
a<-table.element(a,numsignificant1/numgqtests)
if (numsignificant1/numgqtests < 0.01) dum <- 'OK' else dum <- 'NOK'
a<-table.element(a,dum)
a<-table.row.end(a)
a<-table.row.start(a)
a<-table.element(a,'5% type I error level',header=TRUE)
a<-table.element(a,numsignificant5)
a<-table.element(a,numsignificant5/numgqtests)
if (numsignificant5/numgqtests < 0.05) dum <- 'OK' else dum <- 'NOK'
a<-table.element(a,dum)
a<-table.row.end(a)
a<-table.row.start(a)
a<-table.element(a,'10% type I error level',header=TRUE)
a<-table.element(a,numsignificant10)
a<-table.element(a,numsignificant10/numgqtests)
if (numsignificant10/numgqtests < 0.1) dum <- 'OK' else dum <- 'NOK'
a<-table.element(a,dum)
a<-table.row.end(a)
a<-table.end(a)
table.save(a,file='mytable6.tab')
}