Free Statistics

of Irreproducible Research!

Author's title

Author*The author of this computation has been verified*
R Software Modulerwasp_autocorrelation.wasp
Title produced by software(Partial) Autocorrelation Function
Date of computationTue, 24 Nov 2009 04:12:49 -0700
Cite this page as followsStatistical Computations at FreeStatistics.org, Office for Research Development and Education, URL https://freestatistics.org/blog/index.php?v=date/2009/Nov/24/t1259061274y2rnj8ym49gb7zs.htm/, Retrieved Thu, 28 Mar 2024 17:49:15 +0000
Statistical Computations at FreeStatistics.org, Office for Research Development and Education, URL https://freestatistics.org/blog/index.php?pk=58992, Retrieved Thu, 28 Mar 2024 17:49:15 +0000
QR Codes:

Original text written by user:
IsPrivate?No (this computation is public)
User-defined keywords
Estimated Impact174
Family? (F = Feedback message, R = changed R code, M = changed R Module, P = changed Parameters, D = changed Data)
-     [(Partial) Autocorrelation Function] [ws4] [2009-11-24 10:25:36] [ca30429b07824e7c5d48293114d35d71]
-   P     [(Partial) Autocorrelation Function] [ws4] [2009-11-24 11:12:49] [94ba0ef70f5b330d175ff4daa1c9cd40] [Current]
Feedback Forum

Post a new message
Dataseries X:
395.3
395.1
403.5
403.3
405.7
406.7
407.2
412.4
415.9
414
411.8
409.9
412.4
415.9
416.3
417.2
421.8
421.4
415.1
412.4
411.8
408.8
404.5
402.5
409.4
410.7
413.4
415.2
417.7
417.8
417.9
418.4
418.2
416.6
418.9
421
423.5
432.3
432.3
428.6
426.7
427.3
428.5
437
442
444.9
441.4
440.3
447.1
455.3
478.6
486.5
487.8
485.9
483.8
488.4
494
493.6
487.3
482.1
484.2
496.8
501.1
499.8
495.5
498.1
503.8
516.2
526.1
527.1
525.1
528.9
540.1
549
556
568.9
589.1
590.3
603.3
638.8
643
656.7
656.1
654.1
659.9
662.1
669.2
673.1
678.3
677.4
678.5
672.4
665.3
667.9
672.1
662.5
682.3
692.1
702.7
721.4
733.2
747.7
737.6
729.3
706.1
674.3
659
645.7


Summary of computational transaction
Raw Inputview raw input (R code)
Raw Outputview raw output of R engine
Computing time1 seconds
R Server'Gwilym Jenkins' @ 72.249.127.135

\begin{tabular}{lllllllll}
\hline
Summary of computational transaction \tabularnewline
Raw Input & view raw input (R code)  \tabularnewline
Raw Output & view raw output of R engine  \tabularnewline
Computing time & 1 seconds \tabularnewline
R Server & 'Gwilym Jenkins' @ 72.249.127.135 \tabularnewline
\hline
\end{tabular}
%Source: https://freestatistics.org/blog/index.php?pk=58992&T=0

[TABLE]
[ROW][C]Summary of computational transaction[/C][/ROW]
[ROW][C]Raw Input[/C][C]view raw input (R code) [/C][/ROW]
[ROW][C]Raw Output[/C][C]view raw output of R engine [/C][/ROW]
[ROW][C]Computing time[/C][C]1 seconds[/C][/ROW]
[ROW][C]R Server[/C][C]'Gwilym Jenkins' @ 72.249.127.135[/C][/ROW]
[/TABLE]
Source: https://freestatistics.org/blog/index.php?pk=58992&T=0

Globally Unique Identifier (entire table): ba.freestatistics.org/blog/index.php?pk=58992&T=0

As an alternative you can also use a QR Code:  

The GUIDs for individual cells are displayed in the table below:

Summary of computational transaction
Raw Inputview raw input (R code)
Raw Outputview raw output of R engine
Computing time1 seconds
R Server'Gwilym Jenkins' @ 72.249.127.135


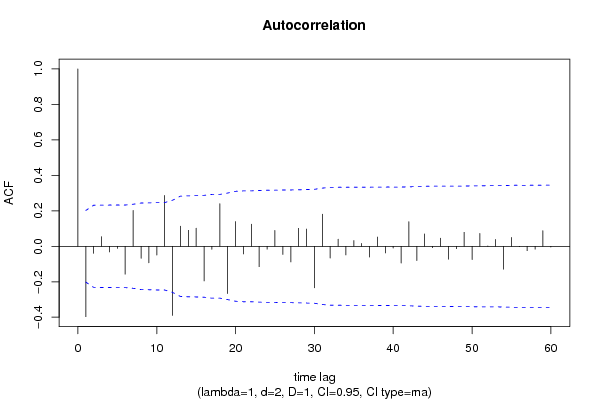
Autocorrelation Function
Time lag kACF(k)T-STATP-value
1-0.396681-3.8460.000109
2-0.039667-0.38460.350707
30.0541950.52540.300258
4-0.031524-0.30560.380278
5-0.012404-0.12030.452265
6-0.157049-1.52260.065602
70.202011.95860.026564
8-0.067427-0.65370.257443
9-0.093056-0.90220.184625
10-0.049325-0.47820.316801
110.2867352.780.003283
12-0.389721-3.77850.000138
130.1133911.09940.137208
140.0900130.87270.192523
150.1019760.98870.162675
16-0.194972-1.89030.030897
17-0.017026-0.16510.434621
180.2399692.32660.011068
19-0.266483-2.58370.005658
200.139541.35290.089668
21-0.043033-0.41720.338735
220.1249091.2110.114459
23-0.11474-1.11240.134393
24-0.016316-0.15820.437325
250.0891590.86440.194776
26-0.045826-0.44430.328924
27-0.087943-0.85260.198014
280.1016810.98580.163372
290.0972570.94290.174065
30-0.234353-2.27210.012679
310.1812161.7570.041091
32-0.066541-0.64510.260205
330.0398890.38670.349913
34-0.048737-0.47250.318825
350.0321570.31180.377951
360.0162870.15790.437435
37-0.060565-0.58720.27924
380.0517730.5020.308435
39-0.037182-0.36050.359644
40-0.010152-0.09840.460901
41-0.094522-0.91640.180894
420.1389821.34750.090533
43-0.080722-0.78260.217907
440.0694810.67360.251096
45-0.008009-0.07760.469138
460.0455170.44130.330005
47-0.072829-0.70610.240936
48-0.01381-0.13390.446887
490.0786560.76260.223808
50-0.074849-0.72570.234917
510.0723380.70130.242411
520.0019280.01870.492562
530.0386970.37520.354187
54-0.12918-1.25240.106757
550.0498740.48350.314916
56-0.002344-0.02270.490959
57-0.024415-0.23670.406697
58-0.016619-0.16110.43617
590.0878670.85190.198217
60-0.004258-0.04130.483578

\begin{tabular}{lllllllll}
\hline
Autocorrelation Function \tabularnewline
Time lag k & ACF(k) & T-STAT & P-value \tabularnewline
1 & -0.396681 & -3.846 & 0.000109 \tabularnewline
2 & -0.039667 & -0.3846 & 0.350707 \tabularnewline
3 & 0.054195 & 0.5254 & 0.300258 \tabularnewline
4 & -0.031524 & -0.3056 & 0.380278 \tabularnewline
5 & -0.012404 & -0.1203 & 0.452265 \tabularnewline
6 & -0.157049 & -1.5226 & 0.065602 \tabularnewline
7 & 0.20201 & 1.9586 & 0.026564 \tabularnewline
8 & -0.067427 & -0.6537 & 0.257443 \tabularnewline
9 & -0.093056 & -0.9022 & 0.184625 \tabularnewline
10 & -0.049325 & -0.4782 & 0.316801 \tabularnewline
11 & 0.286735 & 2.78 & 0.003283 \tabularnewline
12 & -0.389721 & -3.7785 & 0.000138 \tabularnewline
13 & 0.113391 & 1.0994 & 0.137208 \tabularnewline
14 & 0.090013 & 0.8727 & 0.192523 \tabularnewline
15 & 0.101976 & 0.9887 & 0.162675 \tabularnewline
16 & -0.194972 & -1.8903 & 0.030897 \tabularnewline
17 & -0.017026 & -0.1651 & 0.434621 \tabularnewline
18 & 0.239969 & 2.3266 & 0.011068 \tabularnewline
19 & -0.266483 & -2.5837 & 0.005658 \tabularnewline
20 & 0.13954 & 1.3529 & 0.089668 \tabularnewline
21 & -0.043033 & -0.4172 & 0.338735 \tabularnewline
22 & 0.124909 & 1.211 & 0.114459 \tabularnewline
23 & -0.11474 & -1.1124 & 0.134393 \tabularnewline
24 & -0.016316 & -0.1582 & 0.437325 \tabularnewline
25 & 0.089159 & 0.8644 & 0.194776 \tabularnewline
26 & -0.045826 & -0.4443 & 0.328924 \tabularnewline
27 & -0.087943 & -0.8526 & 0.198014 \tabularnewline
28 & 0.101681 & 0.9858 & 0.163372 \tabularnewline
29 & 0.097257 & 0.9429 & 0.174065 \tabularnewline
30 & -0.234353 & -2.2721 & 0.012679 \tabularnewline
31 & 0.181216 & 1.757 & 0.041091 \tabularnewline
32 & -0.066541 & -0.6451 & 0.260205 \tabularnewline
33 & 0.039889 & 0.3867 & 0.349913 \tabularnewline
34 & -0.048737 & -0.4725 & 0.318825 \tabularnewline
35 & 0.032157 & 0.3118 & 0.377951 \tabularnewline
36 & 0.016287 & 0.1579 & 0.437435 \tabularnewline
37 & -0.060565 & -0.5872 & 0.27924 \tabularnewline
38 & 0.051773 & 0.502 & 0.308435 \tabularnewline
39 & -0.037182 & -0.3605 & 0.359644 \tabularnewline
40 & -0.010152 & -0.0984 & 0.460901 \tabularnewline
41 & -0.094522 & -0.9164 & 0.180894 \tabularnewline
42 & 0.138982 & 1.3475 & 0.090533 \tabularnewline
43 & -0.080722 & -0.7826 & 0.217907 \tabularnewline
44 & 0.069481 & 0.6736 & 0.251096 \tabularnewline
45 & -0.008009 & -0.0776 & 0.469138 \tabularnewline
46 & 0.045517 & 0.4413 & 0.330005 \tabularnewline
47 & -0.072829 & -0.7061 & 0.240936 \tabularnewline
48 & -0.01381 & -0.1339 & 0.446887 \tabularnewline
49 & 0.078656 & 0.7626 & 0.223808 \tabularnewline
50 & -0.074849 & -0.7257 & 0.234917 \tabularnewline
51 & 0.072338 & 0.7013 & 0.242411 \tabularnewline
52 & 0.001928 & 0.0187 & 0.492562 \tabularnewline
53 & 0.038697 & 0.3752 & 0.354187 \tabularnewline
54 & -0.12918 & -1.2524 & 0.106757 \tabularnewline
55 & 0.049874 & 0.4835 & 0.314916 \tabularnewline
56 & -0.002344 & -0.0227 & 0.490959 \tabularnewline
57 & -0.024415 & -0.2367 & 0.406697 \tabularnewline
58 & -0.016619 & -0.1611 & 0.43617 \tabularnewline
59 & 0.087867 & 0.8519 & 0.198217 \tabularnewline
60 & -0.004258 & -0.0413 & 0.483578 \tabularnewline
\hline
\end{tabular}
%Source: https://freestatistics.org/blog/index.php?pk=58992&T=1

[TABLE]
[ROW][C]Autocorrelation Function[/C][/ROW]
[ROW][C]Time lag k[/C][C]ACF(k)[/C][C]T-STAT[/C][C]P-value[/C][/ROW]
[ROW][C]1[/C][C]-0.396681[/C][C]-3.846[/C][C]0.000109[/C][/ROW]
[ROW][C]2[/C][C]-0.039667[/C][C]-0.3846[/C][C]0.350707[/C][/ROW]
[ROW][C]3[/C][C]0.054195[/C][C]0.5254[/C][C]0.300258[/C][/ROW]
[ROW][C]4[/C][C]-0.031524[/C][C]-0.3056[/C][C]0.380278[/C][/ROW]
[ROW][C]5[/C][C]-0.012404[/C][C]-0.1203[/C][C]0.452265[/C][/ROW]
[ROW][C]6[/C][C]-0.157049[/C][C]-1.5226[/C][C]0.065602[/C][/ROW]
[ROW][C]7[/C][C]0.20201[/C][C]1.9586[/C][C]0.026564[/C][/ROW]
[ROW][C]8[/C][C]-0.067427[/C][C]-0.6537[/C][C]0.257443[/C][/ROW]
[ROW][C]9[/C][C]-0.093056[/C][C]-0.9022[/C][C]0.184625[/C][/ROW]
[ROW][C]10[/C][C]-0.049325[/C][C]-0.4782[/C][C]0.316801[/C][/ROW]
[ROW][C]11[/C][C]0.286735[/C][C]2.78[/C][C]0.003283[/C][/ROW]
[ROW][C]12[/C][C]-0.389721[/C][C]-3.7785[/C][C]0.000138[/C][/ROW]
[ROW][C]13[/C][C]0.113391[/C][C]1.0994[/C][C]0.137208[/C][/ROW]
[ROW][C]14[/C][C]0.090013[/C][C]0.8727[/C][C]0.192523[/C][/ROW]
[ROW][C]15[/C][C]0.101976[/C][C]0.9887[/C][C]0.162675[/C][/ROW]
[ROW][C]16[/C][C]-0.194972[/C][C]-1.8903[/C][C]0.030897[/C][/ROW]
[ROW][C]17[/C][C]-0.017026[/C][C]-0.1651[/C][C]0.434621[/C][/ROW]
[ROW][C]18[/C][C]0.239969[/C][C]2.3266[/C][C]0.011068[/C][/ROW]
[ROW][C]19[/C][C]-0.266483[/C][C]-2.5837[/C][C]0.005658[/C][/ROW]
[ROW][C]20[/C][C]0.13954[/C][C]1.3529[/C][C]0.089668[/C][/ROW]
[ROW][C]21[/C][C]-0.043033[/C][C]-0.4172[/C][C]0.338735[/C][/ROW]
[ROW][C]22[/C][C]0.124909[/C][C]1.211[/C][C]0.114459[/C][/ROW]
[ROW][C]23[/C][C]-0.11474[/C][C]-1.1124[/C][C]0.134393[/C][/ROW]
[ROW][C]24[/C][C]-0.016316[/C][C]-0.1582[/C][C]0.437325[/C][/ROW]
[ROW][C]25[/C][C]0.089159[/C][C]0.8644[/C][C]0.194776[/C][/ROW]
[ROW][C]26[/C][C]-0.045826[/C][C]-0.4443[/C][C]0.328924[/C][/ROW]
[ROW][C]27[/C][C]-0.087943[/C][C]-0.8526[/C][C]0.198014[/C][/ROW]
[ROW][C]28[/C][C]0.101681[/C][C]0.9858[/C][C]0.163372[/C][/ROW]
[ROW][C]29[/C][C]0.097257[/C][C]0.9429[/C][C]0.174065[/C][/ROW]
[ROW][C]30[/C][C]-0.234353[/C][C]-2.2721[/C][C]0.012679[/C][/ROW]
[ROW][C]31[/C][C]0.181216[/C][C]1.757[/C][C]0.041091[/C][/ROW]
[ROW][C]32[/C][C]-0.066541[/C][C]-0.6451[/C][C]0.260205[/C][/ROW]
[ROW][C]33[/C][C]0.039889[/C][C]0.3867[/C][C]0.349913[/C][/ROW]
[ROW][C]34[/C][C]-0.048737[/C][C]-0.4725[/C][C]0.318825[/C][/ROW]
[ROW][C]35[/C][C]0.032157[/C][C]0.3118[/C][C]0.377951[/C][/ROW]
[ROW][C]36[/C][C]0.016287[/C][C]0.1579[/C][C]0.437435[/C][/ROW]
[ROW][C]37[/C][C]-0.060565[/C][C]-0.5872[/C][C]0.27924[/C][/ROW]
[ROW][C]38[/C][C]0.051773[/C][C]0.502[/C][C]0.308435[/C][/ROW]
[ROW][C]39[/C][C]-0.037182[/C][C]-0.3605[/C][C]0.359644[/C][/ROW]
[ROW][C]40[/C][C]-0.010152[/C][C]-0.0984[/C][C]0.460901[/C][/ROW]
[ROW][C]41[/C][C]-0.094522[/C][C]-0.9164[/C][C]0.180894[/C][/ROW]
[ROW][C]42[/C][C]0.138982[/C][C]1.3475[/C][C]0.090533[/C][/ROW]
[ROW][C]43[/C][C]-0.080722[/C][C]-0.7826[/C][C]0.217907[/C][/ROW]
[ROW][C]44[/C][C]0.069481[/C][C]0.6736[/C][C]0.251096[/C][/ROW]
[ROW][C]45[/C][C]-0.008009[/C][C]-0.0776[/C][C]0.469138[/C][/ROW]
[ROW][C]46[/C][C]0.045517[/C][C]0.4413[/C][C]0.330005[/C][/ROW]
[ROW][C]47[/C][C]-0.072829[/C][C]-0.7061[/C][C]0.240936[/C][/ROW]
[ROW][C]48[/C][C]-0.01381[/C][C]-0.1339[/C][C]0.446887[/C][/ROW]
[ROW][C]49[/C][C]0.078656[/C][C]0.7626[/C][C]0.223808[/C][/ROW]
[ROW][C]50[/C][C]-0.074849[/C][C]-0.7257[/C][C]0.234917[/C][/ROW]
[ROW][C]51[/C][C]0.072338[/C][C]0.7013[/C][C]0.242411[/C][/ROW]
[ROW][C]52[/C][C]0.001928[/C][C]0.0187[/C][C]0.492562[/C][/ROW]
[ROW][C]53[/C][C]0.038697[/C][C]0.3752[/C][C]0.354187[/C][/ROW]
[ROW][C]54[/C][C]-0.12918[/C][C]-1.2524[/C][C]0.106757[/C][/ROW]
[ROW][C]55[/C][C]0.049874[/C][C]0.4835[/C][C]0.314916[/C][/ROW]
[ROW][C]56[/C][C]-0.002344[/C][C]-0.0227[/C][C]0.490959[/C][/ROW]
[ROW][C]57[/C][C]-0.024415[/C][C]-0.2367[/C][C]0.406697[/C][/ROW]
[ROW][C]58[/C][C]-0.016619[/C][C]-0.1611[/C][C]0.43617[/C][/ROW]
[ROW][C]59[/C][C]0.087867[/C][C]0.8519[/C][C]0.198217[/C][/ROW]
[ROW][C]60[/C][C]-0.004258[/C][C]-0.0413[/C][C]0.483578[/C][/ROW]
[/TABLE]
Source: https://freestatistics.org/blog/index.php?pk=58992&T=1

Globally Unique Identifier (entire table): ba.freestatistics.org/blog/index.php?pk=58992&T=1

As an alternative you can also use a QR Code:  

The GUIDs for individual cells are displayed in the table below:

Autocorrelation Function
Time lag kACF(k)T-STATP-value
1-0.396681-3.8460.000109
2-0.039667-0.38460.350707
30.0541950.52540.300258
4-0.031524-0.30560.380278
5-0.012404-0.12030.452265
6-0.157049-1.52260.065602
70.202011.95860.026564
8-0.067427-0.65370.257443
9-0.093056-0.90220.184625
10-0.049325-0.47820.316801
110.2867352.780.003283
12-0.389721-3.77850.000138
130.1133911.09940.137208
140.0900130.87270.192523
150.1019760.98870.162675
16-0.194972-1.89030.030897
17-0.017026-0.16510.434621
180.2399692.32660.011068
19-0.266483-2.58370.005658
200.139541.35290.089668
21-0.043033-0.41720.338735
220.1249091.2110.114459
23-0.11474-1.11240.134393
24-0.016316-0.15820.437325
250.0891590.86440.194776
26-0.045826-0.44430.328924
27-0.087943-0.85260.198014
280.1016810.98580.163372
290.0972570.94290.174065
30-0.234353-2.27210.012679
310.1812161.7570.041091
32-0.066541-0.64510.260205
330.0398890.38670.349913
34-0.048737-0.47250.318825
350.0321570.31180.377951
360.0162870.15790.437435
37-0.060565-0.58720.27924
380.0517730.5020.308435
39-0.037182-0.36050.359644
40-0.010152-0.09840.460901
41-0.094522-0.91640.180894
420.1389821.34750.090533
43-0.080722-0.78260.217907
440.0694810.67360.251096
45-0.008009-0.07760.469138
460.0455170.44130.330005
47-0.072829-0.70610.240936
48-0.01381-0.13390.446887
490.0786560.76260.223808
50-0.074849-0.72570.234917
510.0723380.70130.242411
520.0019280.01870.492562
530.0386970.37520.354187
54-0.12918-1.25240.106757
550.0498740.48350.314916
56-0.002344-0.02270.490959
57-0.024415-0.23670.406697
58-0.016619-0.16110.43617
590.0878670.85190.198217
60-0.004258-0.04130.483578


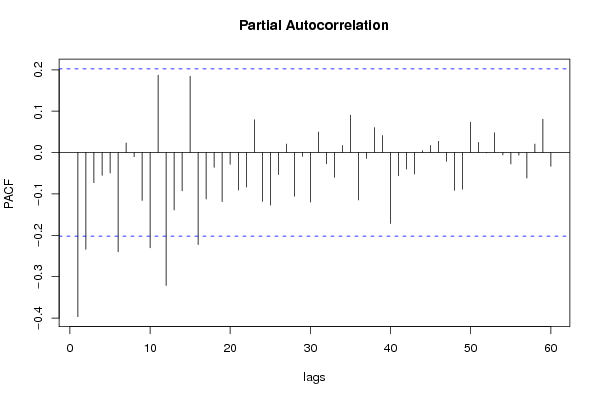
Partial Autocorrelation Function
Time lag kPACF(k)T-STATP-value
1-0.396681-3.8460.000109
2-0.233815-2.26690.012844
3-0.072773-0.70560.241103
4-0.055067-0.53390.297338
5-0.049277-0.47780.316964
6-0.239896-2.32590.011087
70.0233740.22660.410605
8-0.010045-0.09740.461312
9-0.11585-1.12320.132105
10-0.230292-2.23280.013969
110.1870691.81370.036457
12-0.321316-3.11530.001218
13-0.138853-1.34620.090733
14-0.09238-0.89570.186361
150.1847271.7910.038256
16-0.222314-2.15540.016842
17-0.111995-1.08580.140166
18-0.035677-0.34590.365094
19-0.118386-1.14780.126984
20-0.028322-0.27460.392116
21-0.090677-0.87910.190783
22-0.083396-0.80860.210408
230.0792150.7680.222202
24-0.118072-1.14480.127609
25-0.126934-1.23070.110759
26-0.05305-0.51430.304112
270.0205960.19970.421079
28-0.10536-1.02150.154819
29-0.009004-0.08730.46531
30-0.119703-1.16060.124379
310.0496410.48130.315716
32-0.027325-0.26490.395825
33-0.059916-0.58090.281347
340.0171120.16590.434292
350.0902930.87540.191788
36-0.114627-1.11130.134626
37-0.014142-0.13710.445617
380.0604240.58580.279698
390.0413140.40060.344829
40-0.171233-1.66020.050107
41-0.05586-0.54160.294692
42-0.0398-0.38590.35023
43-0.051711-0.50140.308647
440.0045160.04380.482586
450.0171930.16670.433986
460.0271080.26280.396631
47-0.021105-0.20460.419156
48-0.091188-0.88410.18945
49-0.088401-0.85710.19679
500.0734450.71210.23909
510.0245070.23760.406352
52-0.000574-0.00560.497785
530.0478570.4640.321862
54-0.00566-0.05490.478176
55-0.027638-0.2680.394659
56-0.006417-0.06220.47526
57-0.061566-0.59690.276003
580.0205520.19930.421246
590.0805720.78120.218332
60-0.033119-0.32110.374424

\begin{tabular}{lllllllll}
\hline
Partial Autocorrelation Function \tabularnewline
Time lag k & PACF(k) & T-STAT & P-value \tabularnewline
1 & -0.396681 & -3.846 & 0.000109 \tabularnewline
2 & -0.233815 & -2.2669 & 0.012844 \tabularnewline
3 & -0.072773 & -0.7056 & 0.241103 \tabularnewline
4 & -0.055067 & -0.5339 & 0.297338 \tabularnewline
5 & -0.049277 & -0.4778 & 0.316964 \tabularnewline
6 & -0.239896 & -2.3259 & 0.011087 \tabularnewline
7 & 0.023374 & 0.2266 & 0.410605 \tabularnewline
8 & -0.010045 & -0.0974 & 0.461312 \tabularnewline
9 & -0.11585 & -1.1232 & 0.132105 \tabularnewline
10 & -0.230292 & -2.2328 & 0.013969 \tabularnewline
11 & 0.187069 & 1.8137 & 0.036457 \tabularnewline
12 & -0.321316 & -3.1153 & 0.001218 \tabularnewline
13 & -0.138853 & -1.3462 & 0.090733 \tabularnewline
14 & -0.09238 & -0.8957 & 0.186361 \tabularnewline
15 & 0.184727 & 1.791 & 0.038256 \tabularnewline
16 & -0.222314 & -2.1554 & 0.016842 \tabularnewline
17 & -0.111995 & -1.0858 & 0.140166 \tabularnewline
18 & -0.035677 & -0.3459 & 0.365094 \tabularnewline
19 & -0.118386 & -1.1478 & 0.126984 \tabularnewline
20 & -0.028322 & -0.2746 & 0.392116 \tabularnewline
21 & -0.090677 & -0.8791 & 0.190783 \tabularnewline
22 & -0.083396 & -0.8086 & 0.210408 \tabularnewline
23 & 0.079215 & 0.768 & 0.222202 \tabularnewline
24 & -0.118072 & -1.1448 & 0.127609 \tabularnewline
25 & -0.126934 & -1.2307 & 0.110759 \tabularnewline
26 & -0.05305 & -0.5143 & 0.304112 \tabularnewline
27 & 0.020596 & 0.1997 & 0.421079 \tabularnewline
28 & -0.10536 & -1.0215 & 0.154819 \tabularnewline
29 & -0.009004 & -0.0873 & 0.46531 \tabularnewline
30 & -0.119703 & -1.1606 & 0.124379 \tabularnewline
31 & 0.049641 & 0.4813 & 0.315716 \tabularnewline
32 & -0.027325 & -0.2649 & 0.395825 \tabularnewline
33 & -0.059916 & -0.5809 & 0.281347 \tabularnewline
34 & 0.017112 & 0.1659 & 0.434292 \tabularnewline
35 & 0.090293 & 0.8754 & 0.191788 \tabularnewline
36 & -0.114627 & -1.1113 & 0.134626 \tabularnewline
37 & -0.014142 & -0.1371 & 0.445617 \tabularnewline
38 & 0.060424 & 0.5858 & 0.279698 \tabularnewline
39 & 0.041314 & 0.4006 & 0.344829 \tabularnewline
40 & -0.171233 & -1.6602 & 0.050107 \tabularnewline
41 & -0.05586 & -0.5416 & 0.294692 \tabularnewline
42 & -0.0398 & -0.3859 & 0.35023 \tabularnewline
43 & -0.051711 & -0.5014 & 0.308647 \tabularnewline
44 & 0.004516 & 0.0438 & 0.482586 \tabularnewline
45 & 0.017193 & 0.1667 & 0.433986 \tabularnewline
46 & 0.027108 & 0.2628 & 0.396631 \tabularnewline
47 & -0.021105 & -0.2046 & 0.419156 \tabularnewline
48 & -0.091188 & -0.8841 & 0.18945 \tabularnewline
49 & -0.088401 & -0.8571 & 0.19679 \tabularnewline
50 & 0.073445 & 0.7121 & 0.23909 \tabularnewline
51 & 0.024507 & 0.2376 & 0.406352 \tabularnewline
52 & -0.000574 & -0.0056 & 0.497785 \tabularnewline
53 & 0.047857 & 0.464 & 0.321862 \tabularnewline
54 & -0.00566 & -0.0549 & 0.478176 \tabularnewline
55 & -0.027638 & -0.268 & 0.394659 \tabularnewline
56 & -0.006417 & -0.0622 & 0.47526 \tabularnewline
57 & -0.061566 & -0.5969 & 0.276003 \tabularnewline
58 & 0.020552 & 0.1993 & 0.421246 \tabularnewline
59 & 0.080572 & 0.7812 & 0.218332 \tabularnewline
60 & -0.033119 & -0.3211 & 0.374424 \tabularnewline
\hline
\end{tabular}
%Source: https://freestatistics.org/blog/index.php?pk=58992&T=2

[TABLE]
[ROW][C]Partial Autocorrelation Function[/C][/ROW]
[ROW][C]Time lag k[/C][C]PACF(k)[/C][C]T-STAT[/C][C]P-value[/C][/ROW]
[ROW][C]1[/C][C]-0.396681[/C][C]-3.846[/C][C]0.000109[/C][/ROW]
[ROW][C]2[/C][C]-0.233815[/C][C]-2.2669[/C][C]0.012844[/C][/ROW]
[ROW][C]3[/C][C]-0.072773[/C][C]-0.7056[/C][C]0.241103[/C][/ROW]
[ROW][C]4[/C][C]-0.055067[/C][C]-0.5339[/C][C]0.297338[/C][/ROW]
[ROW][C]5[/C][C]-0.049277[/C][C]-0.4778[/C][C]0.316964[/C][/ROW]
[ROW][C]6[/C][C]-0.239896[/C][C]-2.3259[/C][C]0.011087[/C][/ROW]
[ROW][C]7[/C][C]0.023374[/C][C]0.2266[/C][C]0.410605[/C][/ROW]
[ROW][C]8[/C][C]-0.010045[/C][C]-0.0974[/C][C]0.461312[/C][/ROW]
[ROW][C]9[/C][C]-0.11585[/C][C]-1.1232[/C][C]0.132105[/C][/ROW]
[ROW][C]10[/C][C]-0.230292[/C][C]-2.2328[/C][C]0.013969[/C][/ROW]
[ROW][C]11[/C][C]0.187069[/C][C]1.8137[/C][C]0.036457[/C][/ROW]
[ROW][C]12[/C][C]-0.321316[/C][C]-3.1153[/C][C]0.001218[/C][/ROW]
[ROW][C]13[/C][C]-0.138853[/C][C]-1.3462[/C][C]0.090733[/C][/ROW]
[ROW][C]14[/C][C]-0.09238[/C][C]-0.8957[/C][C]0.186361[/C][/ROW]
[ROW][C]15[/C][C]0.184727[/C][C]1.791[/C][C]0.038256[/C][/ROW]
[ROW][C]16[/C][C]-0.222314[/C][C]-2.1554[/C][C]0.016842[/C][/ROW]
[ROW][C]17[/C][C]-0.111995[/C][C]-1.0858[/C][C]0.140166[/C][/ROW]
[ROW][C]18[/C][C]-0.035677[/C][C]-0.3459[/C][C]0.365094[/C][/ROW]
[ROW][C]19[/C][C]-0.118386[/C][C]-1.1478[/C][C]0.126984[/C][/ROW]
[ROW][C]20[/C][C]-0.028322[/C][C]-0.2746[/C][C]0.392116[/C][/ROW]
[ROW][C]21[/C][C]-0.090677[/C][C]-0.8791[/C][C]0.190783[/C][/ROW]
[ROW][C]22[/C][C]-0.083396[/C][C]-0.8086[/C][C]0.210408[/C][/ROW]
[ROW][C]23[/C][C]0.079215[/C][C]0.768[/C][C]0.222202[/C][/ROW]
[ROW][C]24[/C][C]-0.118072[/C][C]-1.1448[/C][C]0.127609[/C][/ROW]
[ROW][C]25[/C][C]-0.126934[/C][C]-1.2307[/C][C]0.110759[/C][/ROW]
[ROW][C]26[/C][C]-0.05305[/C][C]-0.5143[/C][C]0.304112[/C][/ROW]
[ROW][C]27[/C][C]0.020596[/C][C]0.1997[/C][C]0.421079[/C][/ROW]
[ROW][C]28[/C][C]-0.10536[/C][C]-1.0215[/C][C]0.154819[/C][/ROW]
[ROW][C]29[/C][C]-0.009004[/C][C]-0.0873[/C][C]0.46531[/C][/ROW]
[ROW][C]30[/C][C]-0.119703[/C][C]-1.1606[/C][C]0.124379[/C][/ROW]
[ROW][C]31[/C][C]0.049641[/C][C]0.4813[/C][C]0.315716[/C][/ROW]
[ROW][C]32[/C][C]-0.027325[/C][C]-0.2649[/C][C]0.395825[/C][/ROW]
[ROW][C]33[/C][C]-0.059916[/C][C]-0.5809[/C][C]0.281347[/C][/ROW]
[ROW][C]34[/C][C]0.017112[/C][C]0.1659[/C][C]0.434292[/C][/ROW]
[ROW][C]35[/C][C]0.090293[/C][C]0.8754[/C][C]0.191788[/C][/ROW]
[ROW][C]36[/C][C]-0.114627[/C][C]-1.1113[/C][C]0.134626[/C][/ROW]
[ROW][C]37[/C][C]-0.014142[/C][C]-0.1371[/C][C]0.445617[/C][/ROW]
[ROW][C]38[/C][C]0.060424[/C][C]0.5858[/C][C]0.279698[/C][/ROW]
[ROW][C]39[/C][C]0.041314[/C][C]0.4006[/C][C]0.344829[/C][/ROW]
[ROW][C]40[/C][C]-0.171233[/C][C]-1.6602[/C][C]0.050107[/C][/ROW]
[ROW][C]41[/C][C]-0.05586[/C][C]-0.5416[/C][C]0.294692[/C][/ROW]
[ROW][C]42[/C][C]-0.0398[/C][C]-0.3859[/C][C]0.35023[/C][/ROW]
[ROW][C]43[/C][C]-0.051711[/C][C]-0.5014[/C][C]0.308647[/C][/ROW]
[ROW][C]44[/C][C]0.004516[/C][C]0.0438[/C][C]0.482586[/C][/ROW]
[ROW][C]45[/C][C]0.017193[/C][C]0.1667[/C][C]0.433986[/C][/ROW]
[ROW][C]46[/C][C]0.027108[/C][C]0.2628[/C][C]0.396631[/C][/ROW]
[ROW][C]47[/C][C]-0.021105[/C][C]-0.2046[/C][C]0.419156[/C][/ROW]
[ROW][C]48[/C][C]-0.091188[/C][C]-0.8841[/C][C]0.18945[/C][/ROW]
[ROW][C]49[/C][C]-0.088401[/C][C]-0.8571[/C][C]0.19679[/C][/ROW]
[ROW][C]50[/C][C]0.073445[/C][C]0.7121[/C][C]0.23909[/C][/ROW]
[ROW][C]51[/C][C]0.024507[/C][C]0.2376[/C][C]0.406352[/C][/ROW]
[ROW][C]52[/C][C]-0.000574[/C][C]-0.0056[/C][C]0.497785[/C][/ROW]
[ROW][C]53[/C][C]0.047857[/C][C]0.464[/C][C]0.321862[/C][/ROW]
[ROW][C]54[/C][C]-0.00566[/C][C]-0.0549[/C][C]0.478176[/C][/ROW]
[ROW][C]55[/C][C]-0.027638[/C][C]-0.268[/C][C]0.394659[/C][/ROW]
[ROW][C]56[/C][C]-0.006417[/C][C]-0.0622[/C][C]0.47526[/C][/ROW]
[ROW][C]57[/C][C]-0.061566[/C][C]-0.5969[/C][C]0.276003[/C][/ROW]
[ROW][C]58[/C][C]0.020552[/C][C]0.1993[/C][C]0.421246[/C][/ROW]
[ROW][C]59[/C][C]0.080572[/C][C]0.7812[/C][C]0.218332[/C][/ROW]
[ROW][C]60[/C][C]-0.033119[/C][C]-0.3211[/C][C]0.374424[/C][/ROW]
[/TABLE]
Source: https://freestatistics.org/blog/index.php?pk=58992&T=2

Globally Unique Identifier (entire table): ba.freestatistics.org/blog/index.php?pk=58992&T=2

As an alternative you can also use a QR Code:  

The GUIDs for individual cells are displayed in the table below:

Partial Autocorrelation Function
Time lag kPACF(k)T-STATP-value
1-0.396681-3.8460.000109
2-0.233815-2.26690.012844
3-0.072773-0.70560.241103
4-0.055067-0.53390.297338
5-0.049277-0.47780.316964
6-0.239896-2.32590.011087
70.0233740.22660.410605
8-0.010045-0.09740.461312
9-0.11585-1.12320.132105
10-0.230292-2.23280.013969
110.1870691.81370.036457
12-0.321316-3.11530.001218
13-0.138853-1.34620.090733
14-0.09238-0.89570.186361
150.1847271.7910.038256
16-0.222314-2.15540.016842
17-0.111995-1.08580.140166
18-0.035677-0.34590.365094
19-0.118386-1.14780.126984
20-0.028322-0.27460.392116
21-0.090677-0.87910.190783
22-0.083396-0.80860.210408
230.0792150.7680.222202
24-0.118072-1.14480.127609
25-0.126934-1.23070.110759
26-0.05305-0.51430.304112
270.0205960.19970.421079
28-0.10536-1.02150.154819
29-0.009004-0.08730.46531
30-0.119703-1.16060.124379
310.0496410.48130.315716
32-0.027325-0.26490.395825
33-0.059916-0.58090.281347
340.0171120.16590.434292
350.0902930.87540.191788
36-0.114627-1.11130.134626
37-0.014142-0.13710.445617
380.0604240.58580.279698
390.0413140.40060.344829
40-0.171233-1.66020.050107
41-0.05586-0.54160.294692
42-0.0398-0.38590.35023
43-0.051711-0.50140.308647
440.0045160.04380.482586
450.0171930.16670.433986
460.0271080.26280.396631
47-0.021105-0.20460.419156
48-0.091188-0.88410.18945
49-0.088401-0.85710.19679
500.0734450.71210.23909
510.0245070.23760.406352
52-0.000574-0.00560.497785
530.0478570.4640.321862
54-0.00566-0.05490.478176
55-0.027638-0.2680.394659
56-0.006417-0.06220.47526
57-0.061566-0.59690.276003
580.0205520.19930.421246
590.0805720.78120.218332
60-0.033119-0.32110.374424


Parameters (Session):
par1 = 60 ; par2 = 1 ; par3 = 2 ; par4 = 1 ; par5 = 12 ; par6 = MA ; par7 = 0.95 ;
Parameters (R input):
par1 = 60 ; par2 = 1 ; par3 = 2 ; par4 = 1 ; par5 = 12 ; par6 = MA ; par7 = 0.95 ;
R code (references can be found in the software module):
if (par1 == 'Default') {
par1 = 10*log10(length(x))
} else {
par1 <- as.numeric(par1)
}
par2 <- as.numeric(par2)
par3 <- as.numeric(par3)
par4 <- as.numeric(par4)
par5 <- as.numeric(par5)
if (par6 == 'White Noise') par6 <- 'white' else par6 <- 'ma'
par7 <- as.numeric(par7)
if (par2 == 0) {
x <- log(x)
} else {
x <- (x ^ par2 - 1) / par2
}
if (par3 > 0) x <- diff(x,lag=1,difference=par3)
if (par4 > 0) x <- diff(x,lag=par5,difference=par4)
bitmap(file='pic1.png')
racf <- acf(x, par1, main='Autocorrelation', xlab='time lag', ylab='ACF', ci.type=par6, ci=par7, sub=paste('(lambda=',par2,', d=',par3,', D=',par4,', CI=', par7, ', CI type=',par6,')',sep=''))
dev.off()
bitmap(file='pic2.png')
rpacf <- pacf(x,par1,main='Partial Autocorrelation',xlab='lags',ylab='PACF')
dev.off()
(myacf <- c(racf$acf))
(mypacf <- c(rpacf$acf))
lengthx <- length(x)
sqrtn <- sqrt(lengthx)
load(file='createtable')
a<-table.start()
a<-table.row.start(a)
a<-table.element(a,'Autocorrelation Function',4,TRUE)
a<-table.row.end(a)
a<-table.row.start(a)
a<-table.element(a,'Time lag k',header=TRUE)
a<-table.element(a,hyperlink('basics.htm','ACF(k)','click here for more information about the Autocorrelation Function'),header=TRUE)
a<-table.element(a,'T-STAT',header=TRUE)
a<-table.element(a,'P-value',header=TRUE)
a<-table.row.end(a)
for (i in 2:(par1+1)) {
a<-table.row.start(a)
a<-table.element(a,i-1,header=TRUE)
a<-table.element(a,round(myacf[i],6))
mytstat <- myacf[i]*sqrtn
a<-table.element(a,round(mytstat,4))
a<-table.element(a,round(1-pt(abs(mytstat),lengthx),6))
a<-table.row.end(a)
}
a<-table.end(a)
table.save(a,file='mytable.tab')
a<-table.start()
a<-table.row.start(a)
a<-table.element(a,'Partial Autocorrelation Function',4,TRUE)
a<-table.row.end(a)
a<-table.row.start(a)
a<-table.element(a,'Time lag k',header=TRUE)
a<-table.element(a,hyperlink('basics.htm','PACF(k)','click here for more information about the Partial Autocorrelation Function'),header=TRUE)
a<-table.element(a,'T-STAT',header=TRUE)
a<-table.element(a,'P-value',header=TRUE)
a<-table.row.end(a)
for (i in 1:par1) {
a<-table.row.start(a)
a<-table.element(a,i,header=TRUE)
a<-table.element(a,round(mypacf[i],6))
mytstat <- mypacf[i]*sqrtn
a<-table.element(a,round(mytstat,4))
a<-table.element(a,round(1-pt(abs(mytstat),lengthx),6))
a<-table.row.end(a)
}
a<-table.end(a)
table.save(a,file='mytable1.tab')