Free Statistics

of Irreproducible Research!

Author's title

Author*The author of this computation has been verified*
R Software Modulerwasp_autocorrelation.wasp
Title produced by software(Partial) Autocorrelation Function
Date of computationTue, 24 Nov 2009 04:08:53 -0700
Cite this page as followsStatistical Computations at FreeStatistics.org, Office for Research Development and Education, URL https://freestatistics.org/blog/index.php?v=date/2009/Nov/24/t1259061114osavpc53tk5b0ne.htm/, Retrieved Wed, 24 Apr 2024 22:55:32 +0000
Statistical Computations at FreeStatistics.org, Office for Research Development and Education, URL https://freestatistics.org/blog/index.php?pk=58990, Retrieved Wed, 24 Apr 2024 22:55:32 +0000
QR Codes:

Original text written by user:
IsPrivate?No (this computation is public)
User-defined keywords
Estimated Impact193
Family? (F = Feedback message, R = changed R code, M = changed R Module, P = changed Parameters, D = changed Data)
-     [(Partial) Autocorrelation Function] [ws4] [2009-11-24 10:25:36] [ca30429b07824e7c5d48293114d35d71]
-   P     [(Partial) Autocorrelation Function] [ws4] [2009-11-24 11:08:53] [94ba0ef70f5b330d175ff4daa1c9cd40] [Current]
Feedback Forum

Post a new message
Dataseries X:
395.3
395.1
403.5
403.3
405.7
406.7
407.2
412.4
415.9
414
411.8
409.9
412.4
415.9
416.3
417.2
421.8
421.4
415.1
412.4
411.8
408.8
404.5
402.5
409.4
410.7
413.4
415.2
417.7
417.8
417.9
418.4
418.2
416.6
418.9
421
423.5
432.3
432.3
428.6
426.7
427.3
428.5
437
442
444.9
441.4
440.3
447.1
455.3
478.6
486.5
487.8
485.9
483.8
488.4
494
493.6
487.3
482.1
484.2
496.8
501.1
499.8
495.5
498.1
503.8
516.2
526.1
527.1
525.1
528.9
540.1
549
556
568.9
589.1
590.3
603.3
638.8
643
656.7
656.1
654.1
659.9
662.1
669.2
673.1
678.3
677.4
678.5
672.4
665.3
667.9
672.1
662.5
682.3
692.1
702.7
721.4
733.2
747.7
737.6
729.3
706.1
674.3
659
645.7


Summary of computational transaction
Raw Inputview raw input (R code)
Raw Outputview raw output of R engine
Computing time1 seconds
R Server'Gwilym Jenkins' @ 72.249.127.135

\begin{tabular}{lllllllll}
\hline
Summary of computational transaction \tabularnewline
Raw Input & view raw input (R code)  \tabularnewline
Raw Output & view raw output of R engine  \tabularnewline
Computing time & 1 seconds \tabularnewline
R Server & 'Gwilym Jenkins' @ 72.249.127.135 \tabularnewline
\hline
\end{tabular}
%Source: https://freestatistics.org/blog/index.php?pk=58990&T=0

[TABLE]
[ROW][C]Summary of computational transaction[/C][/ROW]
[ROW][C]Raw Input[/C][C]view raw input (R code) [/C][/ROW]
[ROW][C]Raw Output[/C][C]view raw output of R engine [/C][/ROW]
[ROW][C]Computing time[/C][C]1 seconds[/C][/ROW]
[ROW][C]R Server[/C][C]'Gwilym Jenkins' @ 72.249.127.135[/C][/ROW]
[/TABLE]
Source: https://freestatistics.org/blog/index.php?pk=58990&T=0

Globally Unique Identifier (entire table): ba.freestatistics.org/blog/index.php?pk=58990&T=0

As an alternative you can also use a QR Code:  

The GUIDs for individual cells are displayed in the table below:

Summary of computational transaction
Raw Inputview raw input (R code)
Raw Outputview raw output of R engine
Computing time1 seconds
R Server'Gwilym Jenkins' @ 72.249.127.135


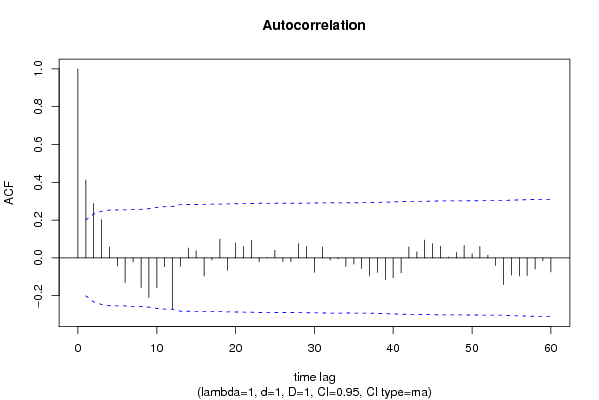
Autocorrelation Function
Time lag kACF(k)T-STATP-value
10.4118984.01475.9e-05
20.2884852.81180.002992
30.201921.96810.025988
40.0577540.56290.287408
5-0.04283-0.41750.338644
6-0.129788-1.2650.104479
7-0.022205-0.21640.414558
8-0.156375-1.52420.065396
9-0.209663-2.04350.021884
10-0.15739-1.5340.064171
11-0.046587-0.45410.325405
12-0.271754-2.64870.004731
13-0.04469-0.43560.332064
140.0518730.50560.307157
150.0375880.36640.357456
16-0.095175-0.92760.17797
17-0.011676-0.11380.454816
180.0997820.97260.166621
19-0.065387-0.63730.262728
200.0784880.7650.223081
210.0602910.58760.279082
220.0935180.91150.18217
23-0.021262-0.20720.418135
240.0027430.02670.489365
250.040390.39370.347351
26-0.019459-0.18970.424989
27-0.020094-0.19580.422573
280.0752740.73370.232476
290.0597940.58280.280704
30-0.075727-0.73810.231137
310.0574070.55950.288558
32-0.011312-0.11030.45622
33-0.005325-0.05190.479356
34-0.045723-0.44570.328431
35-0.032428-0.31610.37632
36-0.055503-0.5410.294894
37-0.095513-0.93090.177121
38-0.076849-0.7490.227846
39-0.114948-1.12040.13269
40-0.104707-1.02060.155028
41-0.078728-0.76730.22239
420.0585590.57080.284756
430.0319120.3110.378227
440.0942530.91870.180298
450.0754130.7350.232064
460.0620360.60470.273426
470.0043370.04230.483184
480.0290180.28280.388961
490.0660170.64350.260738
500.0215890.21040.416895
510.0605030.58970.278392
520.0144030.14040.444326
53-0.040126-0.39110.3483
54-0.141414-1.37830.08567
55-0.090988-0.88680.188701
56-0.095521-0.9310.177101
57-0.092943-0.90590.18364
58-0.05864-0.57160.284487
59-0.015669-0.15270.43947
60-0.074131-0.72250.235868

\begin{tabular}{lllllllll}
\hline
Autocorrelation Function \tabularnewline
Time lag k & ACF(k) & T-STAT & P-value \tabularnewline
1 & 0.411898 & 4.0147 & 5.9e-05 \tabularnewline
2 & 0.288485 & 2.8118 & 0.002992 \tabularnewline
3 & 0.20192 & 1.9681 & 0.025988 \tabularnewline
4 & 0.057754 & 0.5629 & 0.287408 \tabularnewline
5 & -0.04283 & -0.4175 & 0.338644 \tabularnewline
6 & -0.129788 & -1.265 & 0.104479 \tabularnewline
7 & -0.022205 & -0.2164 & 0.414558 \tabularnewline
8 & -0.156375 & -1.5242 & 0.065396 \tabularnewline
9 & -0.209663 & -2.0435 & 0.021884 \tabularnewline
10 & -0.15739 & -1.534 & 0.064171 \tabularnewline
11 & -0.046587 & -0.4541 & 0.325405 \tabularnewline
12 & -0.271754 & -2.6487 & 0.004731 \tabularnewline
13 & -0.04469 & -0.4356 & 0.332064 \tabularnewline
14 & 0.051873 & 0.5056 & 0.307157 \tabularnewline
15 & 0.037588 & 0.3664 & 0.357456 \tabularnewline
16 & -0.095175 & -0.9276 & 0.17797 \tabularnewline
17 & -0.011676 & -0.1138 & 0.454816 \tabularnewline
18 & 0.099782 & 0.9726 & 0.166621 \tabularnewline
19 & -0.065387 & -0.6373 & 0.262728 \tabularnewline
20 & 0.078488 & 0.765 & 0.223081 \tabularnewline
21 & 0.060291 & 0.5876 & 0.279082 \tabularnewline
22 & 0.093518 & 0.9115 & 0.18217 \tabularnewline
23 & -0.021262 & -0.2072 & 0.418135 \tabularnewline
24 & 0.002743 & 0.0267 & 0.489365 \tabularnewline
25 & 0.04039 & 0.3937 & 0.347351 \tabularnewline
26 & -0.019459 & -0.1897 & 0.424989 \tabularnewline
27 & -0.020094 & -0.1958 & 0.422573 \tabularnewline
28 & 0.075274 & 0.7337 & 0.232476 \tabularnewline
29 & 0.059794 & 0.5828 & 0.280704 \tabularnewline
30 & -0.075727 & -0.7381 & 0.231137 \tabularnewline
31 & 0.057407 & 0.5595 & 0.288558 \tabularnewline
32 & -0.011312 & -0.1103 & 0.45622 \tabularnewline
33 & -0.005325 & -0.0519 & 0.479356 \tabularnewline
34 & -0.045723 & -0.4457 & 0.328431 \tabularnewline
35 & -0.032428 & -0.3161 & 0.37632 \tabularnewline
36 & -0.055503 & -0.541 & 0.294894 \tabularnewline
37 & -0.095513 & -0.9309 & 0.177121 \tabularnewline
38 & -0.076849 & -0.749 & 0.227846 \tabularnewline
39 & -0.114948 & -1.1204 & 0.13269 \tabularnewline
40 & -0.104707 & -1.0206 & 0.155028 \tabularnewline
41 & -0.078728 & -0.7673 & 0.22239 \tabularnewline
42 & 0.058559 & 0.5708 & 0.284756 \tabularnewline
43 & 0.031912 & 0.311 & 0.378227 \tabularnewline
44 & 0.094253 & 0.9187 & 0.180298 \tabularnewline
45 & 0.075413 & 0.735 & 0.232064 \tabularnewline
46 & 0.062036 & 0.6047 & 0.273426 \tabularnewline
47 & 0.004337 & 0.0423 & 0.483184 \tabularnewline
48 & 0.029018 & 0.2828 & 0.388961 \tabularnewline
49 & 0.066017 & 0.6435 & 0.260738 \tabularnewline
50 & 0.021589 & 0.2104 & 0.416895 \tabularnewline
51 & 0.060503 & 0.5897 & 0.278392 \tabularnewline
52 & 0.014403 & 0.1404 & 0.444326 \tabularnewline
53 & -0.040126 & -0.3911 & 0.3483 \tabularnewline
54 & -0.141414 & -1.3783 & 0.08567 \tabularnewline
55 & -0.090988 & -0.8868 & 0.188701 \tabularnewline
56 & -0.095521 & -0.931 & 0.177101 \tabularnewline
57 & -0.092943 & -0.9059 & 0.18364 \tabularnewline
58 & -0.05864 & -0.5716 & 0.284487 \tabularnewline
59 & -0.015669 & -0.1527 & 0.43947 \tabularnewline
60 & -0.074131 & -0.7225 & 0.235868 \tabularnewline
\hline
\end{tabular}
%Source: https://freestatistics.org/blog/index.php?pk=58990&T=1

[TABLE]
[ROW][C]Autocorrelation Function[/C][/ROW]
[ROW][C]Time lag k[/C][C]ACF(k)[/C][C]T-STAT[/C][C]P-value[/C][/ROW]
[ROW][C]1[/C][C]0.411898[/C][C]4.0147[/C][C]5.9e-05[/C][/ROW]
[ROW][C]2[/C][C]0.288485[/C][C]2.8118[/C][C]0.002992[/C][/ROW]
[ROW][C]3[/C][C]0.20192[/C][C]1.9681[/C][C]0.025988[/C][/ROW]
[ROW][C]4[/C][C]0.057754[/C][C]0.5629[/C][C]0.287408[/C][/ROW]
[ROW][C]5[/C][C]-0.04283[/C][C]-0.4175[/C][C]0.338644[/C][/ROW]
[ROW][C]6[/C][C]-0.129788[/C][C]-1.265[/C][C]0.104479[/C][/ROW]
[ROW][C]7[/C][C]-0.022205[/C][C]-0.2164[/C][C]0.414558[/C][/ROW]
[ROW][C]8[/C][C]-0.156375[/C][C]-1.5242[/C][C]0.065396[/C][/ROW]
[ROW][C]9[/C][C]-0.209663[/C][C]-2.0435[/C][C]0.021884[/C][/ROW]
[ROW][C]10[/C][C]-0.15739[/C][C]-1.534[/C][C]0.064171[/C][/ROW]
[ROW][C]11[/C][C]-0.046587[/C][C]-0.4541[/C][C]0.325405[/C][/ROW]
[ROW][C]12[/C][C]-0.271754[/C][C]-2.6487[/C][C]0.004731[/C][/ROW]
[ROW][C]13[/C][C]-0.04469[/C][C]-0.4356[/C][C]0.332064[/C][/ROW]
[ROW][C]14[/C][C]0.051873[/C][C]0.5056[/C][C]0.307157[/C][/ROW]
[ROW][C]15[/C][C]0.037588[/C][C]0.3664[/C][C]0.357456[/C][/ROW]
[ROW][C]16[/C][C]-0.095175[/C][C]-0.9276[/C][C]0.17797[/C][/ROW]
[ROW][C]17[/C][C]-0.011676[/C][C]-0.1138[/C][C]0.454816[/C][/ROW]
[ROW][C]18[/C][C]0.099782[/C][C]0.9726[/C][C]0.166621[/C][/ROW]
[ROW][C]19[/C][C]-0.065387[/C][C]-0.6373[/C][C]0.262728[/C][/ROW]
[ROW][C]20[/C][C]0.078488[/C][C]0.765[/C][C]0.223081[/C][/ROW]
[ROW][C]21[/C][C]0.060291[/C][C]0.5876[/C][C]0.279082[/C][/ROW]
[ROW][C]22[/C][C]0.093518[/C][C]0.9115[/C][C]0.18217[/C][/ROW]
[ROW][C]23[/C][C]-0.021262[/C][C]-0.2072[/C][C]0.418135[/C][/ROW]
[ROW][C]24[/C][C]0.002743[/C][C]0.0267[/C][C]0.489365[/C][/ROW]
[ROW][C]25[/C][C]0.04039[/C][C]0.3937[/C][C]0.347351[/C][/ROW]
[ROW][C]26[/C][C]-0.019459[/C][C]-0.1897[/C][C]0.424989[/C][/ROW]
[ROW][C]27[/C][C]-0.020094[/C][C]-0.1958[/C][C]0.422573[/C][/ROW]
[ROW][C]28[/C][C]0.075274[/C][C]0.7337[/C][C]0.232476[/C][/ROW]
[ROW][C]29[/C][C]0.059794[/C][C]0.5828[/C][C]0.280704[/C][/ROW]
[ROW][C]30[/C][C]-0.075727[/C][C]-0.7381[/C][C]0.231137[/C][/ROW]
[ROW][C]31[/C][C]0.057407[/C][C]0.5595[/C][C]0.288558[/C][/ROW]
[ROW][C]32[/C][C]-0.011312[/C][C]-0.1103[/C][C]0.45622[/C][/ROW]
[ROW][C]33[/C][C]-0.005325[/C][C]-0.0519[/C][C]0.479356[/C][/ROW]
[ROW][C]34[/C][C]-0.045723[/C][C]-0.4457[/C][C]0.328431[/C][/ROW]
[ROW][C]35[/C][C]-0.032428[/C][C]-0.3161[/C][C]0.37632[/C][/ROW]
[ROW][C]36[/C][C]-0.055503[/C][C]-0.541[/C][C]0.294894[/C][/ROW]
[ROW][C]37[/C][C]-0.095513[/C][C]-0.9309[/C][C]0.177121[/C][/ROW]
[ROW][C]38[/C][C]-0.076849[/C][C]-0.749[/C][C]0.227846[/C][/ROW]
[ROW][C]39[/C][C]-0.114948[/C][C]-1.1204[/C][C]0.13269[/C][/ROW]
[ROW][C]40[/C][C]-0.104707[/C][C]-1.0206[/C][C]0.155028[/C][/ROW]
[ROW][C]41[/C][C]-0.078728[/C][C]-0.7673[/C][C]0.22239[/C][/ROW]
[ROW][C]42[/C][C]0.058559[/C][C]0.5708[/C][C]0.284756[/C][/ROW]
[ROW][C]43[/C][C]0.031912[/C][C]0.311[/C][C]0.378227[/C][/ROW]
[ROW][C]44[/C][C]0.094253[/C][C]0.9187[/C][C]0.180298[/C][/ROW]
[ROW][C]45[/C][C]0.075413[/C][C]0.735[/C][C]0.232064[/C][/ROW]
[ROW][C]46[/C][C]0.062036[/C][C]0.6047[/C][C]0.273426[/C][/ROW]
[ROW][C]47[/C][C]0.004337[/C][C]0.0423[/C][C]0.483184[/C][/ROW]
[ROW][C]48[/C][C]0.029018[/C][C]0.2828[/C][C]0.388961[/C][/ROW]
[ROW][C]49[/C][C]0.066017[/C][C]0.6435[/C][C]0.260738[/C][/ROW]
[ROW][C]50[/C][C]0.021589[/C][C]0.2104[/C][C]0.416895[/C][/ROW]
[ROW][C]51[/C][C]0.060503[/C][C]0.5897[/C][C]0.278392[/C][/ROW]
[ROW][C]52[/C][C]0.014403[/C][C]0.1404[/C][C]0.444326[/C][/ROW]
[ROW][C]53[/C][C]-0.040126[/C][C]-0.3911[/C][C]0.3483[/C][/ROW]
[ROW][C]54[/C][C]-0.141414[/C][C]-1.3783[/C][C]0.08567[/C][/ROW]
[ROW][C]55[/C][C]-0.090988[/C][C]-0.8868[/C][C]0.188701[/C][/ROW]
[ROW][C]56[/C][C]-0.095521[/C][C]-0.931[/C][C]0.177101[/C][/ROW]
[ROW][C]57[/C][C]-0.092943[/C][C]-0.9059[/C][C]0.18364[/C][/ROW]
[ROW][C]58[/C][C]-0.05864[/C][C]-0.5716[/C][C]0.284487[/C][/ROW]
[ROW][C]59[/C][C]-0.015669[/C][C]-0.1527[/C][C]0.43947[/C][/ROW]
[ROW][C]60[/C][C]-0.074131[/C][C]-0.7225[/C][C]0.235868[/C][/ROW]
[/TABLE]
Source: https://freestatistics.org/blog/index.php?pk=58990&T=1

Globally Unique Identifier (entire table): ba.freestatistics.org/blog/index.php?pk=58990&T=1

As an alternative you can also use a QR Code:  

The GUIDs for individual cells are displayed in the table below:

Autocorrelation Function
Time lag kACF(k)T-STATP-value
10.4118984.01475.9e-05
20.2884852.81180.002992
30.201921.96810.025988
40.0577540.56290.287408
5-0.04283-0.41750.338644
6-0.129788-1.2650.104479
7-0.022205-0.21640.414558
8-0.156375-1.52420.065396
9-0.209663-2.04350.021884
10-0.15739-1.5340.064171
11-0.046587-0.45410.325405
12-0.271754-2.64870.004731
13-0.04469-0.43560.332064
140.0518730.50560.307157
150.0375880.36640.357456
16-0.095175-0.92760.17797
17-0.011676-0.11380.454816
180.0997820.97260.166621
19-0.065387-0.63730.262728
200.0784880.7650.223081
210.0602910.58760.279082
220.0935180.91150.18217
23-0.021262-0.20720.418135
240.0027430.02670.489365
250.040390.39370.347351
26-0.019459-0.18970.424989
27-0.020094-0.19580.422573
280.0752740.73370.232476
290.0597940.58280.280704
30-0.075727-0.73810.231137
310.0574070.55950.288558
32-0.011312-0.11030.45622
33-0.005325-0.05190.479356
34-0.045723-0.44570.328431
35-0.032428-0.31610.37632
36-0.055503-0.5410.294894
37-0.095513-0.93090.177121
38-0.076849-0.7490.227846
39-0.114948-1.12040.13269
40-0.104707-1.02060.155028
41-0.078728-0.76730.22239
420.0585590.57080.284756
430.0319120.3110.378227
440.0942530.91870.180298
450.0754130.7350.232064
460.0620360.60470.273426
470.0043370.04230.483184
480.0290180.28280.388961
490.0660170.64350.260738
500.0215890.21040.416895
510.0605030.58970.278392
520.0144030.14040.444326
53-0.040126-0.39110.3483
54-0.141414-1.37830.08567
55-0.090988-0.88680.188701
56-0.095521-0.9310.177101
57-0.092943-0.90590.18364
58-0.05864-0.57160.284487
59-0.015669-0.15270.43947
60-0.074131-0.72250.235868


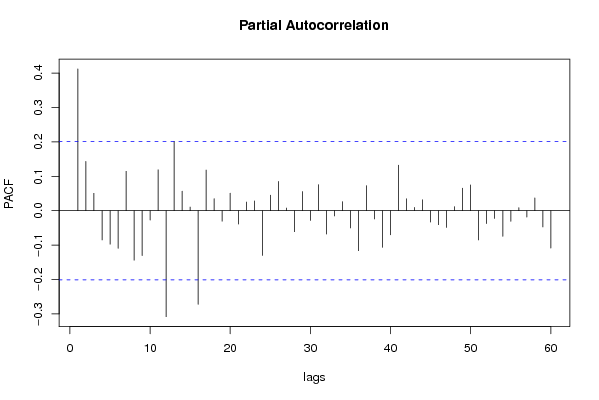
Partial Autocorrelation Function
Time lag kPACF(k)T-STATP-value
10.4118984.01475.9e-05
20.1431041.39480.083163
30.0505980.49320.311515
4-0.085084-0.82930.204507
5-0.097498-0.95030.172187
6-0.109591-1.06820.144077
70.1145371.11640.13354
8-0.143877-1.40230.082037
9-0.130441-1.27140.103348
10-0.027176-0.26490.395838
110.1186211.15620.125254
12-0.308057-3.00260.001711
130.2015471.96440.026201
140.0566540.55220.291057
150.0103280.10070.460014
16-0.27226-2.65370.004667
170.1179381.14950.126614
180.0348280.33950.367507
19-0.030756-0.29980.382505
200.05080.49510.310823
21-0.038849-0.37870.352896
220.0249570.24320.404168
230.0284220.2770.391181
24-0.130014-1.26720.104088
250.045120.43980.330549
260.0848610.82710.20512
270.0077330.07540.470039
28-0.061274-0.59720.275888
290.0555040.5410.294891
30-0.028481-0.27760.390962
310.0754130.7350.232064
32-0.068095-0.66370.254242
33-0.015413-0.15020.440451
340.0261420.25480.399714
35-0.050186-0.48920.312931
36-0.116228-1.13290.130064
370.0724480.70610.240917
38-0.024243-0.23630.406857
39-0.106594-1.0390.150732
40-0.070341-0.68560.247316
410.1320181.28680.100653
420.0344240.33550.368984
430.0094230.09180.463508
440.031390.3060.380156
45-0.033-0.32160.374213
46-0.040848-0.39810.34571
47-0.04873-0.4750.317952
480.011480.11190.455571
490.0652940.63640.26302
500.0746730.72780.234257
51-0.085148-0.82990.204333
52-0.03749-0.36540.357811
53-0.022604-0.22030.413049
54-0.07467-0.72780.234267
55-0.030924-0.30140.38188
560.0085750.08360.466782
57-0.018598-0.18130.428271
580.0369930.36060.359613
59-0.047415-0.46210.322516
60-0.108856-1.0610.145691

\begin{tabular}{lllllllll}
\hline
Partial Autocorrelation Function \tabularnewline
Time lag k & PACF(k) & T-STAT & P-value \tabularnewline
1 & 0.411898 & 4.0147 & 5.9e-05 \tabularnewline
2 & 0.143104 & 1.3948 & 0.083163 \tabularnewline
3 & 0.050598 & 0.4932 & 0.311515 \tabularnewline
4 & -0.085084 & -0.8293 & 0.204507 \tabularnewline
5 & -0.097498 & -0.9503 & 0.172187 \tabularnewline
6 & -0.109591 & -1.0682 & 0.144077 \tabularnewline
7 & 0.114537 & 1.1164 & 0.13354 \tabularnewline
8 & -0.143877 & -1.4023 & 0.082037 \tabularnewline
9 & -0.130441 & -1.2714 & 0.103348 \tabularnewline
10 & -0.027176 & -0.2649 & 0.395838 \tabularnewline
11 & 0.118621 & 1.1562 & 0.125254 \tabularnewline
12 & -0.308057 & -3.0026 & 0.001711 \tabularnewline
13 & 0.201547 & 1.9644 & 0.026201 \tabularnewline
14 & 0.056654 & 0.5522 & 0.291057 \tabularnewline
15 & 0.010328 & 0.1007 & 0.460014 \tabularnewline
16 & -0.27226 & -2.6537 & 0.004667 \tabularnewline
17 & 0.117938 & 1.1495 & 0.126614 \tabularnewline
18 & 0.034828 & 0.3395 & 0.367507 \tabularnewline
19 & -0.030756 & -0.2998 & 0.382505 \tabularnewline
20 & 0.0508 & 0.4951 & 0.310823 \tabularnewline
21 & -0.038849 & -0.3787 & 0.352896 \tabularnewline
22 & 0.024957 & 0.2432 & 0.404168 \tabularnewline
23 & 0.028422 & 0.277 & 0.391181 \tabularnewline
24 & -0.130014 & -1.2672 & 0.104088 \tabularnewline
25 & 0.04512 & 0.4398 & 0.330549 \tabularnewline
26 & 0.084861 & 0.8271 & 0.20512 \tabularnewline
27 & 0.007733 & 0.0754 & 0.470039 \tabularnewline
28 & -0.061274 & -0.5972 & 0.275888 \tabularnewline
29 & 0.055504 & 0.541 & 0.294891 \tabularnewline
30 & -0.028481 & -0.2776 & 0.390962 \tabularnewline
31 & 0.075413 & 0.735 & 0.232064 \tabularnewline
32 & -0.068095 & -0.6637 & 0.254242 \tabularnewline
33 & -0.015413 & -0.1502 & 0.440451 \tabularnewline
34 & 0.026142 & 0.2548 & 0.399714 \tabularnewline
35 & -0.050186 & -0.4892 & 0.312931 \tabularnewline
36 & -0.116228 & -1.1329 & 0.130064 \tabularnewline
37 & 0.072448 & 0.7061 & 0.240917 \tabularnewline
38 & -0.024243 & -0.2363 & 0.406857 \tabularnewline
39 & -0.106594 & -1.039 & 0.150732 \tabularnewline
40 & -0.070341 & -0.6856 & 0.247316 \tabularnewline
41 & 0.132018 & 1.2868 & 0.100653 \tabularnewline
42 & 0.034424 & 0.3355 & 0.368984 \tabularnewline
43 & 0.009423 & 0.0918 & 0.463508 \tabularnewline
44 & 0.03139 & 0.306 & 0.380156 \tabularnewline
45 & -0.033 & -0.3216 & 0.374213 \tabularnewline
46 & -0.040848 & -0.3981 & 0.34571 \tabularnewline
47 & -0.04873 & -0.475 & 0.317952 \tabularnewline
48 & 0.01148 & 0.1119 & 0.455571 \tabularnewline
49 & 0.065294 & 0.6364 & 0.26302 \tabularnewline
50 & 0.074673 & 0.7278 & 0.234257 \tabularnewline
51 & -0.085148 & -0.8299 & 0.204333 \tabularnewline
52 & -0.03749 & -0.3654 & 0.357811 \tabularnewline
53 & -0.022604 & -0.2203 & 0.413049 \tabularnewline
54 & -0.07467 & -0.7278 & 0.234267 \tabularnewline
55 & -0.030924 & -0.3014 & 0.38188 \tabularnewline
56 & 0.008575 & 0.0836 & 0.466782 \tabularnewline
57 & -0.018598 & -0.1813 & 0.428271 \tabularnewline
58 & 0.036993 & 0.3606 & 0.359613 \tabularnewline
59 & -0.047415 & -0.4621 & 0.322516 \tabularnewline
60 & -0.108856 & -1.061 & 0.145691 \tabularnewline
\hline
\end{tabular}
%Source: https://freestatistics.org/blog/index.php?pk=58990&T=2

[TABLE]
[ROW][C]Partial Autocorrelation Function[/C][/ROW]
[ROW][C]Time lag k[/C][C]PACF(k)[/C][C]T-STAT[/C][C]P-value[/C][/ROW]
[ROW][C]1[/C][C]0.411898[/C][C]4.0147[/C][C]5.9e-05[/C][/ROW]
[ROW][C]2[/C][C]0.143104[/C][C]1.3948[/C][C]0.083163[/C][/ROW]
[ROW][C]3[/C][C]0.050598[/C][C]0.4932[/C][C]0.311515[/C][/ROW]
[ROW][C]4[/C][C]-0.085084[/C][C]-0.8293[/C][C]0.204507[/C][/ROW]
[ROW][C]5[/C][C]-0.097498[/C][C]-0.9503[/C][C]0.172187[/C][/ROW]
[ROW][C]6[/C][C]-0.109591[/C][C]-1.0682[/C][C]0.144077[/C][/ROW]
[ROW][C]7[/C][C]0.114537[/C][C]1.1164[/C][C]0.13354[/C][/ROW]
[ROW][C]8[/C][C]-0.143877[/C][C]-1.4023[/C][C]0.082037[/C][/ROW]
[ROW][C]9[/C][C]-0.130441[/C][C]-1.2714[/C][C]0.103348[/C][/ROW]
[ROW][C]10[/C][C]-0.027176[/C][C]-0.2649[/C][C]0.395838[/C][/ROW]
[ROW][C]11[/C][C]0.118621[/C][C]1.1562[/C][C]0.125254[/C][/ROW]
[ROW][C]12[/C][C]-0.308057[/C][C]-3.0026[/C][C]0.001711[/C][/ROW]
[ROW][C]13[/C][C]0.201547[/C][C]1.9644[/C][C]0.026201[/C][/ROW]
[ROW][C]14[/C][C]0.056654[/C][C]0.5522[/C][C]0.291057[/C][/ROW]
[ROW][C]15[/C][C]0.010328[/C][C]0.1007[/C][C]0.460014[/C][/ROW]
[ROW][C]16[/C][C]-0.27226[/C][C]-2.6537[/C][C]0.004667[/C][/ROW]
[ROW][C]17[/C][C]0.117938[/C][C]1.1495[/C][C]0.126614[/C][/ROW]
[ROW][C]18[/C][C]0.034828[/C][C]0.3395[/C][C]0.367507[/C][/ROW]
[ROW][C]19[/C][C]-0.030756[/C][C]-0.2998[/C][C]0.382505[/C][/ROW]
[ROW][C]20[/C][C]0.0508[/C][C]0.4951[/C][C]0.310823[/C][/ROW]
[ROW][C]21[/C][C]-0.038849[/C][C]-0.3787[/C][C]0.352896[/C][/ROW]
[ROW][C]22[/C][C]0.024957[/C][C]0.2432[/C][C]0.404168[/C][/ROW]
[ROW][C]23[/C][C]0.028422[/C][C]0.277[/C][C]0.391181[/C][/ROW]
[ROW][C]24[/C][C]-0.130014[/C][C]-1.2672[/C][C]0.104088[/C][/ROW]
[ROW][C]25[/C][C]0.04512[/C][C]0.4398[/C][C]0.330549[/C][/ROW]
[ROW][C]26[/C][C]0.084861[/C][C]0.8271[/C][C]0.20512[/C][/ROW]
[ROW][C]27[/C][C]0.007733[/C][C]0.0754[/C][C]0.470039[/C][/ROW]
[ROW][C]28[/C][C]-0.061274[/C][C]-0.5972[/C][C]0.275888[/C][/ROW]
[ROW][C]29[/C][C]0.055504[/C][C]0.541[/C][C]0.294891[/C][/ROW]
[ROW][C]30[/C][C]-0.028481[/C][C]-0.2776[/C][C]0.390962[/C][/ROW]
[ROW][C]31[/C][C]0.075413[/C][C]0.735[/C][C]0.232064[/C][/ROW]
[ROW][C]32[/C][C]-0.068095[/C][C]-0.6637[/C][C]0.254242[/C][/ROW]
[ROW][C]33[/C][C]-0.015413[/C][C]-0.1502[/C][C]0.440451[/C][/ROW]
[ROW][C]34[/C][C]0.026142[/C][C]0.2548[/C][C]0.399714[/C][/ROW]
[ROW][C]35[/C][C]-0.050186[/C][C]-0.4892[/C][C]0.312931[/C][/ROW]
[ROW][C]36[/C][C]-0.116228[/C][C]-1.1329[/C][C]0.130064[/C][/ROW]
[ROW][C]37[/C][C]0.072448[/C][C]0.7061[/C][C]0.240917[/C][/ROW]
[ROW][C]38[/C][C]-0.024243[/C][C]-0.2363[/C][C]0.406857[/C][/ROW]
[ROW][C]39[/C][C]-0.106594[/C][C]-1.039[/C][C]0.150732[/C][/ROW]
[ROW][C]40[/C][C]-0.070341[/C][C]-0.6856[/C][C]0.247316[/C][/ROW]
[ROW][C]41[/C][C]0.132018[/C][C]1.2868[/C][C]0.100653[/C][/ROW]
[ROW][C]42[/C][C]0.034424[/C][C]0.3355[/C][C]0.368984[/C][/ROW]
[ROW][C]43[/C][C]0.009423[/C][C]0.0918[/C][C]0.463508[/C][/ROW]
[ROW][C]44[/C][C]0.03139[/C][C]0.306[/C][C]0.380156[/C][/ROW]
[ROW][C]45[/C][C]-0.033[/C][C]-0.3216[/C][C]0.374213[/C][/ROW]
[ROW][C]46[/C][C]-0.040848[/C][C]-0.3981[/C][C]0.34571[/C][/ROW]
[ROW][C]47[/C][C]-0.04873[/C][C]-0.475[/C][C]0.317952[/C][/ROW]
[ROW][C]48[/C][C]0.01148[/C][C]0.1119[/C][C]0.455571[/C][/ROW]
[ROW][C]49[/C][C]0.065294[/C][C]0.6364[/C][C]0.26302[/C][/ROW]
[ROW][C]50[/C][C]0.074673[/C][C]0.7278[/C][C]0.234257[/C][/ROW]
[ROW][C]51[/C][C]-0.085148[/C][C]-0.8299[/C][C]0.204333[/C][/ROW]
[ROW][C]52[/C][C]-0.03749[/C][C]-0.3654[/C][C]0.357811[/C][/ROW]
[ROW][C]53[/C][C]-0.022604[/C][C]-0.2203[/C][C]0.413049[/C][/ROW]
[ROW][C]54[/C][C]-0.07467[/C][C]-0.7278[/C][C]0.234267[/C][/ROW]
[ROW][C]55[/C][C]-0.030924[/C][C]-0.3014[/C][C]0.38188[/C][/ROW]
[ROW][C]56[/C][C]0.008575[/C][C]0.0836[/C][C]0.466782[/C][/ROW]
[ROW][C]57[/C][C]-0.018598[/C][C]-0.1813[/C][C]0.428271[/C][/ROW]
[ROW][C]58[/C][C]0.036993[/C][C]0.3606[/C][C]0.359613[/C][/ROW]
[ROW][C]59[/C][C]-0.047415[/C][C]-0.4621[/C][C]0.322516[/C][/ROW]
[ROW][C]60[/C][C]-0.108856[/C][C]-1.061[/C][C]0.145691[/C][/ROW]
[/TABLE]
Source: https://freestatistics.org/blog/index.php?pk=58990&T=2

Globally Unique Identifier (entire table): ba.freestatistics.org/blog/index.php?pk=58990&T=2

As an alternative you can also use a QR Code:  

The GUIDs for individual cells are displayed in the table below:

Partial Autocorrelation Function
Time lag kPACF(k)T-STATP-value
10.4118984.01475.9e-05
20.1431041.39480.083163
30.0505980.49320.311515
4-0.085084-0.82930.204507
5-0.097498-0.95030.172187
6-0.109591-1.06820.144077
70.1145371.11640.13354
8-0.143877-1.40230.082037
9-0.130441-1.27140.103348
10-0.027176-0.26490.395838
110.1186211.15620.125254
12-0.308057-3.00260.001711
130.2015471.96440.026201
140.0566540.55220.291057
150.0103280.10070.460014
16-0.27226-2.65370.004667
170.1179381.14950.126614
180.0348280.33950.367507
19-0.030756-0.29980.382505
200.05080.49510.310823
21-0.038849-0.37870.352896
220.0249570.24320.404168
230.0284220.2770.391181
24-0.130014-1.26720.104088
250.045120.43980.330549
260.0848610.82710.20512
270.0077330.07540.470039
28-0.061274-0.59720.275888
290.0555040.5410.294891
30-0.028481-0.27760.390962
310.0754130.7350.232064
32-0.068095-0.66370.254242
33-0.015413-0.15020.440451
340.0261420.25480.399714
35-0.050186-0.48920.312931
36-0.116228-1.13290.130064
370.0724480.70610.240917
38-0.024243-0.23630.406857
39-0.106594-1.0390.150732
40-0.070341-0.68560.247316
410.1320181.28680.100653
420.0344240.33550.368984
430.0094230.09180.463508
440.031390.3060.380156
45-0.033-0.32160.374213
46-0.040848-0.39810.34571
47-0.04873-0.4750.317952
480.011480.11190.455571
490.0652940.63640.26302
500.0746730.72780.234257
51-0.085148-0.82990.204333
52-0.03749-0.36540.357811
53-0.022604-0.22030.413049
54-0.07467-0.72780.234267
55-0.030924-0.30140.38188
560.0085750.08360.466782
57-0.018598-0.18130.428271
580.0369930.36060.359613
59-0.047415-0.46210.322516
60-0.108856-1.0610.145691


Parameters (Session):
par1 = 60 ; par2 = 1 ; par3 = 1 ; par4 = 1 ; par5 = 12 ; par6 = MA ; par7 = 0.95 ;
Parameters (R input):
par1 = 60 ; par2 = 1 ; par3 = 1 ; par4 = 1 ; par5 = 12 ; par6 = MA ; par7 = 0.95 ;
R code (references can be found in the software module):
if (par1 == 'Default') {
par1 = 10*log10(length(x))
} else {
par1 <- as.numeric(par1)
}
par2 <- as.numeric(par2)
par3 <- as.numeric(par3)
par4 <- as.numeric(par4)
par5 <- as.numeric(par5)
if (par6 == 'White Noise') par6 <- 'white' else par6 <- 'ma'
par7 <- as.numeric(par7)
if (par2 == 0) {
x <- log(x)
} else {
x <- (x ^ par2 - 1) / par2
}
if (par3 > 0) x <- diff(x,lag=1,difference=par3)
if (par4 > 0) x <- diff(x,lag=par5,difference=par4)
bitmap(file='pic1.png')
racf <- acf(x, par1, main='Autocorrelation', xlab='time lag', ylab='ACF', ci.type=par6, ci=par7, sub=paste('(lambda=',par2,', d=',par3,', D=',par4,', CI=', par7, ', CI type=',par6,')',sep=''))
dev.off()
bitmap(file='pic2.png')
rpacf <- pacf(x,par1,main='Partial Autocorrelation',xlab='lags',ylab='PACF')
dev.off()
(myacf <- c(racf$acf))
(mypacf <- c(rpacf$acf))
lengthx <- length(x)
sqrtn <- sqrt(lengthx)
load(file='createtable')
a<-table.start()
a<-table.row.start(a)
a<-table.element(a,'Autocorrelation Function',4,TRUE)
a<-table.row.end(a)
a<-table.row.start(a)
a<-table.element(a,'Time lag k',header=TRUE)
a<-table.element(a,hyperlink('basics.htm','ACF(k)','click here for more information about the Autocorrelation Function'),header=TRUE)
a<-table.element(a,'T-STAT',header=TRUE)
a<-table.element(a,'P-value',header=TRUE)
a<-table.row.end(a)
for (i in 2:(par1+1)) {
a<-table.row.start(a)
a<-table.element(a,i-1,header=TRUE)
a<-table.element(a,round(myacf[i],6))
mytstat <- myacf[i]*sqrtn
a<-table.element(a,round(mytstat,4))
a<-table.element(a,round(1-pt(abs(mytstat),lengthx),6))
a<-table.row.end(a)
}
a<-table.end(a)
table.save(a,file='mytable.tab')
a<-table.start()
a<-table.row.start(a)
a<-table.element(a,'Partial Autocorrelation Function',4,TRUE)
a<-table.row.end(a)
a<-table.row.start(a)
a<-table.element(a,'Time lag k',header=TRUE)
a<-table.element(a,hyperlink('basics.htm','PACF(k)','click here for more information about the Partial Autocorrelation Function'),header=TRUE)
a<-table.element(a,'T-STAT',header=TRUE)
a<-table.element(a,'P-value',header=TRUE)
a<-table.row.end(a)
for (i in 1:par1) {
a<-table.row.start(a)
a<-table.element(a,i,header=TRUE)
a<-table.element(a,round(mypacf[i],6))
mytstat <- mypacf[i]*sqrtn
a<-table.element(a,round(mytstat,4))
a<-table.element(a,round(1-pt(abs(mytstat),lengthx),6))
a<-table.row.end(a)
}
a<-table.end(a)
table.save(a,file='mytable1.tab')