Free Statistics

of Irreproducible Research!

Author's title

Author*The author of this computation has been verified*
R Software Modulerwasp_autocorrelation.wasp
Title produced by software(Partial) Autocorrelation Function
Date of computationTue, 24 Nov 2009 03:25:36 -0700
Cite this page as followsStatistical Computations at FreeStatistics.org, Office for Research Development and Education, URL https://freestatistics.org/blog/index.php?v=date/2009/Nov/24/t1259058391x0xhtr2ql3x7vty.htm/, Retrieved Fri, 26 Apr 2024 04:52:44 +0000
Statistical Computations at FreeStatistics.org, Office for Research Development and Education, URL https://freestatistics.org/blog/index.php?pk=58981, Retrieved Fri, 26 Apr 2024 04:52:44 +0000
QR Codes:

Original text written by user:
IsPrivate?No (this computation is public)
User-defined keywords
Estimated Impact164
Family? (F = Feedback message, R = changed R code, M = changed R Module, P = changed Parameters, D = changed Data)
-       [(Partial) Autocorrelation Function] [ws4] [2009-11-24 10:25:36] [94ba0ef70f5b330d175ff4daa1c9cd40] [Current]
-   P     [(Partial) Autocorrelation Function] [ws4] [2009-11-24 11:08:53] [ca30429b07824e7c5d48293114d35d71]
-   P     [(Partial) Autocorrelation Function] [ws4] [2009-11-24 11:12:49] [ca30429b07824e7c5d48293114d35d71]
Feedback Forum

Post a new message
Dataseries X:
395.3
395.1
403.5
403.3
405.7
406.7
407.2
412.4
415.9
414
411.8
409.9
412.4
415.9
416.3
417.2
421.8
421.4
415.1
412.4
411.8
408.8
404.5
402.5
409.4
410.7
413.4
415.2
417.7
417.8
417.9
418.4
418.2
416.6
418.9
421
423.5
432.3
432.3
428.6
426.7
427.3
428.5
437
442
444.9
441.4
440.3
447.1
455.3
478.6
486.5
487.8
485.9
483.8
488.4
494
493.6
487.3
482.1
484.2
496.8
501.1
499.8
495.5
498.1
503.8
516.2
526.1
527.1
525.1
528.9
540.1
549
556
568.9
589.1
590.3
603.3
638.8
643
656.7
656.1
654.1
659.9
662.1
669.2
673.1
678.3
677.4
678.5
672.4
665.3
667.9
672.1
662.5
682.3
692.1
702.7
721.4
733.2
747.7
737.6
729.3
706.1
674.3
659
645.7


Summary of computational transaction
Raw Inputview raw input (R code)
Raw Outputview raw output of R engine
Computing time1 seconds
R Server'Gwilym Jenkins' @ 72.249.127.135

\begin{tabular}{lllllllll}
\hline
Summary of computational transaction \tabularnewline
Raw Input & view raw input (R code)  \tabularnewline
Raw Output & view raw output of R engine  \tabularnewline
Computing time & 1 seconds \tabularnewline
R Server & 'Gwilym Jenkins' @ 72.249.127.135 \tabularnewline
\hline
\end{tabular}
%Source: https://freestatistics.org/blog/index.php?pk=58981&T=0

[TABLE]
[ROW][C]Summary of computational transaction[/C][/ROW]
[ROW][C]Raw Input[/C][C]view raw input (R code) [/C][/ROW]
[ROW][C]Raw Output[/C][C]view raw output of R engine [/C][/ROW]
[ROW][C]Computing time[/C][C]1 seconds[/C][/ROW]
[ROW][C]R Server[/C][C]'Gwilym Jenkins' @ 72.249.127.135[/C][/ROW]
[/TABLE]
Source: https://freestatistics.org/blog/index.php?pk=58981&T=0

Globally Unique Identifier (entire table): ba.freestatistics.org/blog/index.php?pk=58981&T=0

As an alternative you can also use a QR Code:  

The GUIDs for individual cells are displayed in the table below:

Summary of computational transaction
Raw Inputview raw input (R code)
Raw Outputview raw output of R engine
Computing time1 seconds
R Server'Gwilym Jenkins' @ 72.249.127.135


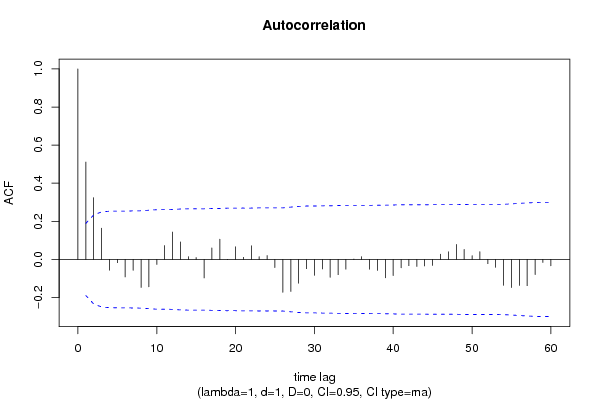
Autocorrelation Function
Time lag kACF(k)T-STATP-value
10.5114555.29050
20.3240573.35210.000555
30.1638561.69490.046498
4-0.056721-0.58670.279312
5-0.017145-0.17740.429784
6-0.092105-0.95270.171434
7-0.056982-0.58940.278408
8-0.147196-1.52260.065404
9-0.143409-1.48340.070449
10-0.026076-0.26970.393943
110.0729770.75490.225989
120.143491.48430.070339
130.0919550.95120.171825
140.0147260.15230.43961
150.009630.09960.46042
16-0.097288-1.00640.158258
170.0606120.6270.266006
180.1062821.09940.137033
19-0.000603-0.00620.497517
200.0664160.6870.24678
210.0111320.11510.454271
220.0717170.74180.229903
230.0147770.15290.4394
240.0203530.21050.416827
25-0.042642-0.44110.330017
26-0.172278-1.78210.038788
27-0.168199-1.73990.042379
28-0.124535-1.28820.100228
29-0.048278-0.49940.309264
30-0.083202-0.86060.195679
31-0.049528-0.51230.304741
32-0.093667-0.96890.167389
33-0.080361-0.83130.203839
34-0.051137-0.5290.298961
350.0020040.02070.491752
360.0143110.1480.441299
37-0.050926-0.52680.299718
38-0.057773-0.59760.275682
39-0.096429-0.99750.160394
40-0.084934-0.87860.190804
41-0.044184-0.4570.324283
42-0.032533-0.33650.368566
43-0.036853-0.38120.3519
44-0.033785-0.34950.363712
45-0.031728-0.32820.371702
460.0277330.28690.387383
470.039920.41290.340241
480.0787310.81440.208612
490.0523260.54130.294724
500.0197750.20460.419154
510.0405190.41910.337982
52-0.022382-0.23150.408677
53-0.041314-0.42740.334991
54-0.135878-1.40550.08138
55-0.147757-1.52840.064681
56-0.136453-1.41150.080502
57-0.137984-1.42730.0782
58-0.079284-0.82010.206987
59-0.01558-0.16120.436137
60-0.033772-0.34930.36376

\begin{tabular}{lllllllll}
\hline
Autocorrelation Function \tabularnewline
Time lag k & ACF(k) & T-STAT & P-value \tabularnewline
1 & 0.511455 & 5.2905 & 0 \tabularnewline
2 & 0.324057 & 3.3521 & 0.000555 \tabularnewline
3 & 0.163856 & 1.6949 & 0.046498 \tabularnewline
4 & -0.056721 & -0.5867 & 0.279312 \tabularnewline
5 & -0.017145 & -0.1774 & 0.429784 \tabularnewline
6 & -0.092105 & -0.9527 & 0.171434 \tabularnewline
7 & -0.056982 & -0.5894 & 0.278408 \tabularnewline
8 & -0.147196 & -1.5226 & 0.065404 \tabularnewline
9 & -0.143409 & -1.4834 & 0.070449 \tabularnewline
10 & -0.026076 & -0.2697 & 0.393943 \tabularnewline
11 & 0.072977 & 0.7549 & 0.225989 \tabularnewline
12 & 0.14349 & 1.4843 & 0.070339 \tabularnewline
13 & 0.091955 & 0.9512 & 0.171825 \tabularnewline
14 & 0.014726 & 0.1523 & 0.43961 \tabularnewline
15 & 0.00963 & 0.0996 & 0.46042 \tabularnewline
16 & -0.097288 & -1.0064 & 0.158258 \tabularnewline
17 & 0.060612 & 0.627 & 0.266006 \tabularnewline
18 & 0.106282 & 1.0994 & 0.137033 \tabularnewline
19 & -0.000603 & -0.0062 & 0.497517 \tabularnewline
20 & 0.066416 & 0.687 & 0.24678 \tabularnewline
21 & 0.011132 & 0.1151 & 0.454271 \tabularnewline
22 & 0.071717 & 0.7418 & 0.229903 \tabularnewline
23 & 0.014777 & 0.1529 & 0.4394 \tabularnewline
24 & 0.020353 & 0.2105 & 0.416827 \tabularnewline
25 & -0.042642 & -0.4411 & 0.330017 \tabularnewline
26 & -0.172278 & -1.7821 & 0.038788 \tabularnewline
27 & -0.168199 & -1.7399 & 0.042379 \tabularnewline
28 & -0.124535 & -1.2882 & 0.100228 \tabularnewline
29 & -0.048278 & -0.4994 & 0.309264 \tabularnewline
30 & -0.083202 & -0.8606 & 0.195679 \tabularnewline
31 & -0.049528 & -0.5123 & 0.304741 \tabularnewline
32 & -0.093667 & -0.9689 & 0.167389 \tabularnewline
33 & -0.080361 & -0.8313 & 0.203839 \tabularnewline
34 & -0.051137 & -0.529 & 0.298961 \tabularnewline
35 & 0.002004 & 0.0207 & 0.491752 \tabularnewline
36 & 0.014311 & 0.148 & 0.441299 \tabularnewline
37 & -0.050926 & -0.5268 & 0.299718 \tabularnewline
38 & -0.057773 & -0.5976 & 0.275682 \tabularnewline
39 & -0.096429 & -0.9975 & 0.160394 \tabularnewline
40 & -0.084934 & -0.8786 & 0.190804 \tabularnewline
41 & -0.044184 & -0.457 & 0.324283 \tabularnewline
42 & -0.032533 & -0.3365 & 0.368566 \tabularnewline
43 & -0.036853 & -0.3812 & 0.3519 \tabularnewline
44 & -0.033785 & -0.3495 & 0.363712 \tabularnewline
45 & -0.031728 & -0.3282 & 0.371702 \tabularnewline
46 & 0.027733 & 0.2869 & 0.387383 \tabularnewline
47 & 0.03992 & 0.4129 & 0.340241 \tabularnewline
48 & 0.078731 & 0.8144 & 0.208612 \tabularnewline
49 & 0.052326 & 0.5413 & 0.294724 \tabularnewline
50 & 0.019775 & 0.2046 & 0.419154 \tabularnewline
51 & 0.040519 & 0.4191 & 0.337982 \tabularnewline
52 & -0.022382 & -0.2315 & 0.408677 \tabularnewline
53 & -0.041314 & -0.4274 & 0.334991 \tabularnewline
54 & -0.135878 & -1.4055 & 0.08138 \tabularnewline
55 & -0.147757 & -1.5284 & 0.064681 \tabularnewline
56 & -0.136453 & -1.4115 & 0.080502 \tabularnewline
57 & -0.137984 & -1.4273 & 0.0782 \tabularnewline
58 & -0.079284 & -0.8201 & 0.206987 \tabularnewline
59 & -0.01558 & -0.1612 & 0.436137 \tabularnewline
60 & -0.033772 & -0.3493 & 0.36376 \tabularnewline
\hline
\end{tabular}
%Source: https://freestatistics.org/blog/index.php?pk=58981&T=1

[TABLE]
[ROW][C]Autocorrelation Function[/C][/ROW]
[ROW][C]Time lag k[/C][C]ACF(k)[/C][C]T-STAT[/C][C]P-value[/C][/ROW]
[ROW][C]1[/C][C]0.511455[/C][C]5.2905[/C][C]0[/C][/ROW]
[ROW][C]2[/C][C]0.324057[/C][C]3.3521[/C][C]0.000555[/C][/ROW]
[ROW][C]3[/C][C]0.163856[/C][C]1.6949[/C][C]0.046498[/C][/ROW]
[ROW][C]4[/C][C]-0.056721[/C][C]-0.5867[/C][C]0.279312[/C][/ROW]
[ROW][C]5[/C][C]-0.017145[/C][C]-0.1774[/C][C]0.429784[/C][/ROW]
[ROW][C]6[/C][C]-0.092105[/C][C]-0.9527[/C][C]0.171434[/C][/ROW]
[ROW][C]7[/C][C]-0.056982[/C][C]-0.5894[/C][C]0.278408[/C][/ROW]
[ROW][C]8[/C][C]-0.147196[/C][C]-1.5226[/C][C]0.065404[/C][/ROW]
[ROW][C]9[/C][C]-0.143409[/C][C]-1.4834[/C][C]0.070449[/C][/ROW]
[ROW][C]10[/C][C]-0.026076[/C][C]-0.2697[/C][C]0.393943[/C][/ROW]
[ROW][C]11[/C][C]0.072977[/C][C]0.7549[/C][C]0.225989[/C][/ROW]
[ROW][C]12[/C][C]0.14349[/C][C]1.4843[/C][C]0.070339[/C][/ROW]
[ROW][C]13[/C][C]0.091955[/C][C]0.9512[/C][C]0.171825[/C][/ROW]
[ROW][C]14[/C][C]0.014726[/C][C]0.1523[/C][C]0.43961[/C][/ROW]
[ROW][C]15[/C][C]0.00963[/C][C]0.0996[/C][C]0.46042[/C][/ROW]
[ROW][C]16[/C][C]-0.097288[/C][C]-1.0064[/C][C]0.158258[/C][/ROW]
[ROW][C]17[/C][C]0.060612[/C][C]0.627[/C][C]0.266006[/C][/ROW]
[ROW][C]18[/C][C]0.106282[/C][C]1.0994[/C][C]0.137033[/C][/ROW]
[ROW][C]19[/C][C]-0.000603[/C][C]-0.0062[/C][C]0.497517[/C][/ROW]
[ROW][C]20[/C][C]0.066416[/C][C]0.687[/C][C]0.24678[/C][/ROW]
[ROW][C]21[/C][C]0.011132[/C][C]0.1151[/C][C]0.454271[/C][/ROW]
[ROW][C]22[/C][C]0.071717[/C][C]0.7418[/C][C]0.229903[/C][/ROW]
[ROW][C]23[/C][C]0.014777[/C][C]0.1529[/C][C]0.4394[/C][/ROW]
[ROW][C]24[/C][C]0.020353[/C][C]0.2105[/C][C]0.416827[/C][/ROW]
[ROW][C]25[/C][C]-0.042642[/C][C]-0.4411[/C][C]0.330017[/C][/ROW]
[ROW][C]26[/C][C]-0.172278[/C][C]-1.7821[/C][C]0.038788[/C][/ROW]
[ROW][C]27[/C][C]-0.168199[/C][C]-1.7399[/C][C]0.042379[/C][/ROW]
[ROW][C]28[/C][C]-0.124535[/C][C]-1.2882[/C][C]0.100228[/C][/ROW]
[ROW][C]29[/C][C]-0.048278[/C][C]-0.4994[/C][C]0.309264[/C][/ROW]
[ROW][C]30[/C][C]-0.083202[/C][C]-0.8606[/C][C]0.195679[/C][/ROW]
[ROW][C]31[/C][C]-0.049528[/C][C]-0.5123[/C][C]0.304741[/C][/ROW]
[ROW][C]32[/C][C]-0.093667[/C][C]-0.9689[/C][C]0.167389[/C][/ROW]
[ROW][C]33[/C][C]-0.080361[/C][C]-0.8313[/C][C]0.203839[/C][/ROW]
[ROW][C]34[/C][C]-0.051137[/C][C]-0.529[/C][C]0.298961[/C][/ROW]
[ROW][C]35[/C][C]0.002004[/C][C]0.0207[/C][C]0.491752[/C][/ROW]
[ROW][C]36[/C][C]0.014311[/C][C]0.148[/C][C]0.441299[/C][/ROW]
[ROW][C]37[/C][C]-0.050926[/C][C]-0.5268[/C][C]0.299718[/C][/ROW]
[ROW][C]38[/C][C]-0.057773[/C][C]-0.5976[/C][C]0.275682[/C][/ROW]
[ROW][C]39[/C][C]-0.096429[/C][C]-0.9975[/C][C]0.160394[/C][/ROW]
[ROW][C]40[/C][C]-0.084934[/C][C]-0.8786[/C][C]0.190804[/C][/ROW]
[ROW][C]41[/C][C]-0.044184[/C][C]-0.457[/C][C]0.324283[/C][/ROW]
[ROW][C]42[/C][C]-0.032533[/C][C]-0.3365[/C][C]0.368566[/C][/ROW]
[ROW][C]43[/C][C]-0.036853[/C][C]-0.3812[/C][C]0.3519[/C][/ROW]
[ROW][C]44[/C][C]-0.033785[/C][C]-0.3495[/C][C]0.363712[/C][/ROW]
[ROW][C]45[/C][C]-0.031728[/C][C]-0.3282[/C][C]0.371702[/C][/ROW]
[ROW][C]46[/C][C]0.027733[/C][C]0.2869[/C][C]0.387383[/C][/ROW]
[ROW][C]47[/C][C]0.03992[/C][C]0.4129[/C][C]0.340241[/C][/ROW]
[ROW][C]48[/C][C]0.078731[/C][C]0.8144[/C][C]0.208612[/C][/ROW]
[ROW][C]49[/C][C]0.052326[/C][C]0.5413[/C][C]0.294724[/C][/ROW]
[ROW][C]50[/C][C]0.019775[/C][C]0.2046[/C][C]0.419154[/C][/ROW]
[ROW][C]51[/C][C]0.040519[/C][C]0.4191[/C][C]0.337982[/C][/ROW]
[ROW][C]52[/C][C]-0.022382[/C][C]-0.2315[/C][C]0.408677[/C][/ROW]
[ROW][C]53[/C][C]-0.041314[/C][C]-0.4274[/C][C]0.334991[/C][/ROW]
[ROW][C]54[/C][C]-0.135878[/C][C]-1.4055[/C][C]0.08138[/C][/ROW]
[ROW][C]55[/C][C]-0.147757[/C][C]-1.5284[/C][C]0.064681[/C][/ROW]
[ROW][C]56[/C][C]-0.136453[/C][C]-1.4115[/C][C]0.080502[/C][/ROW]
[ROW][C]57[/C][C]-0.137984[/C][C]-1.4273[/C][C]0.0782[/C][/ROW]
[ROW][C]58[/C][C]-0.079284[/C][C]-0.8201[/C][C]0.206987[/C][/ROW]
[ROW][C]59[/C][C]-0.01558[/C][C]-0.1612[/C][C]0.436137[/C][/ROW]
[ROW][C]60[/C][C]-0.033772[/C][C]-0.3493[/C][C]0.36376[/C][/ROW]
[/TABLE]
Source: https://freestatistics.org/blog/index.php?pk=58981&T=1

Globally Unique Identifier (entire table): ba.freestatistics.org/blog/index.php?pk=58981&T=1

As an alternative you can also use a QR Code:  

The GUIDs for individual cells are displayed in the table below:

Autocorrelation Function
Time lag kACF(k)T-STATP-value
10.5114555.29050
20.3240573.35210.000555
30.1638561.69490.046498
4-0.056721-0.58670.279312
5-0.017145-0.17740.429784
6-0.092105-0.95270.171434
7-0.056982-0.58940.278408
8-0.147196-1.52260.065404
9-0.143409-1.48340.070449
10-0.026076-0.26970.393943
110.0729770.75490.225989
120.143491.48430.070339
130.0919550.95120.171825
140.0147260.15230.43961
150.009630.09960.46042
16-0.097288-1.00640.158258
170.0606120.6270.266006
180.1062821.09940.137033
19-0.000603-0.00620.497517
200.0664160.6870.24678
210.0111320.11510.454271
220.0717170.74180.229903
230.0147770.15290.4394
240.0203530.21050.416827
25-0.042642-0.44110.330017
26-0.172278-1.78210.038788
27-0.168199-1.73990.042379
28-0.124535-1.28820.100228
29-0.048278-0.49940.309264
30-0.083202-0.86060.195679
31-0.049528-0.51230.304741
32-0.093667-0.96890.167389
33-0.080361-0.83130.203839
34-0.051137-0.5290.298961
350.0020040.02070.491752
360.0143110.1480.441299
37-0.050926-0.52680.299718
38-0.057773-0.59760.275682
39-0.096429-0.99750.160394
40-0.084934-0.87860.190804
41-0.044184-0.4570.324283
42-0.032533-0.33650.368566
43-0.036853-0.38120.3519
44-0.033785-0.34950.363712
45-0.031728-0.32820.371702
460.0277330.28690.387383
470.039920.41290.340241
480.0787310.81440.208612
490.0523260.54130.294724
500.0197750.20460.419154
510.0405190.41910.337982
52-0.022382-0.23150.408677
53-0.041314-0.42740.334991
54-0.135878-1.40550.08138
55-0.147757-1.52840.064681
56-0.136453-1.41150.080502
57-0.137984-1.42730.0782
58-0.079284-0.82010.206987
59-0.01558-0.16120.436137
60-0.033772-0.34930.36376


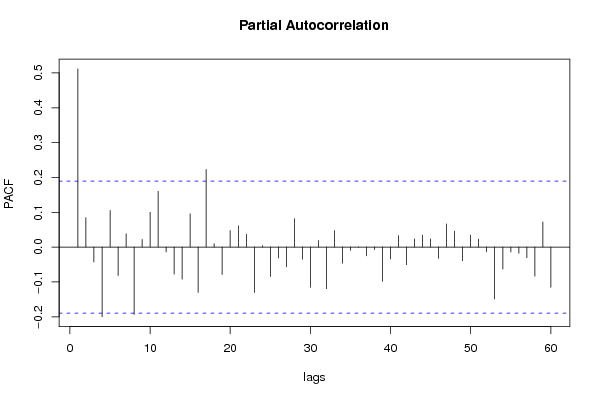
Partial Autocorrelation Function
Time lag kPACF(k)T-STATP-value
10.5114555.29050
20.0846020.87510.191733
3-0.042465-0.43930.330677
4-0.19973-2.0660.020621
50.1052821.0890.13929
6-0.081511-0.84320.20051
70.0382310.39550.346642
8-0.193197-1.99840.024103
90.0220150.22770.410145
100.0999791.03420.151689
110.1600881.6560.05033
12-0.013901-0.14380.442966
13-0.077516-0.80180.212215
14-0.092011-0.95180.17168
150.0955930.98880.162491
16-0.130076-1.34550.090652
170.2227572.30420.011571
180.0096120.09940.460492
19-0.078403-0.8110.209581
200.0473840.49010.312517
210.0612060.63310.264004
220.0368660.38130.351851
23-0.1307-1.3520.089617
240.003520.03640.485512
25-0.084581-0.87490.191792
26-0.031177-0.32250.373854
27-0.056488-0.58430.280118
280.0816480.84460.200117
29-0.034597-0.35790.360572
30-0.11563-1.19610.117153
310.0190740.19730.421983
32-0.119299-1.2340.109947
330.0473490.48980.312646
34-0.046268-0.47860.316601
35-0.009164-0.09480.46233
36-0.000827-0.00860.496597
37-0.024896-0.25750.398634
38-0.007248-0.0750.470188
39-0.098114-1.01490.156222
40-0.034149-0.35320.362301
410.0331570.3430.366145
42-0.050545-0.52280.301084
430.0232840.24090.405064
440.0342170.35390.362041
450.0232930.24090.405029
46-0.032161-0.33270.370016
470.0664270.68710.246745
480.0455950.47160.319074
49-0.039157-0.4050.343128
500.034010.35180.362838
510.0226810.23460.407477
52-0.013723-0.1420.443692
53-0.148893-1.54020.063236
54-0.063205-0.65380.257322
55-0.013996-0.14480.442579
56-0.017757-0.18370.427305
57-0.030366-0.31410.377026
58-0.083732-0.86610.194179
590.0721990.74680.228403
60-0.115575-1.19550.117264

\begin{tabular}{lllllllll}
\hline
Partial Autocorrelation Function \tabularnewline
Time lag k & PACF(k) & T-STAT & P-value \tabularnewline
1 & 0.511455 & 5.2905 & 0 \tabularnewline
2 & 0.084602 & 0.8751 & 0.191733 \tabularnewline
3 & -0.042465 & -0.4393 & 0.330677 \tabularnewline
4 & -0.19973 & -2.066 & 0.020621 \tabularnewline
5 & 0.105282 & 1.089 & 0.13929 \tabularnewline
6 & -0.081511 & -0.8432 & 0.20051 \tabularnewline
7 & 0.038231 & 0.3955 & 0.346642 \tabularnewline
8 & -0.193197 & -1.9984 & 0.024103 \tabularnewline
9 & 0.022015 & 0.2277 & 0.410145 \tabularnewline
10 & 0.099979 & 1.0342 & 0.151689 \tabularnewline
11 & 0.160088 & 1.656 & 0.05033 \tabularnewline
12 & -0.013901 & -0.1438 & 0.442966 \tabularnewline
13 & -0.077516 & -0.8018 & 0.212215 \tabularnewline
14 & -0.092011 & -0.9518 & 0.17168 \tabularnewline
15 & 0.095593 & 0.9888 & 0.162491 \tabularnewline
16 & -0.130076 & -1.3455 & 0.090652 \tabularnewline
17 & 0.222757 & 2.3042 & 0.011571 \tabularnewline
18 & 0.009612 & 0.0994 & 0.460492 \tabularnewline
19 & -0.078403 & -0.811 & 0.209581 \tabularnewline
20 & 0.047384 & 0.4901 & 0.312517 \tabularnewline
21 & 0.061206 & 0.6331 & 0.264004 \tabularnewline
22 & 0.036866 & 0.3813 & 0.351851 \tabularnewline
23 & -0.1307 & -1.352 & 0.089617 \tabularnewline
24 & 0.00352 & 0.0364 & 0.485512 \tabularnewline
25 & -0.084581 & -0.8749 & 0.191792 \tabularnewline
26 & -0.031177 & -0.3225 & 0.373854 \tabularnewline
27 & -0.056488 & -0.5843 & 0.280118 \tabularnewline
28 & 0.081648 & 0.8446 & 0.200117 \tabularnewline
29 & -0.034597 & -0.3579 & 0.360572 \tabularnewline
30 & -0.11563 & -1.1961 & 0.117153 \tabularnewline
31 & 0.019074 & 0.1973 & 0.421983 \tabularnewline
32 & -0.119299 & -1.234 & 0.109947 \tabularnewline
33 & 0.047349 & 0.4898 & 0.312646 \tabularnewline
34 & -0.046268 & -0.4786 & 0.316601 \tabularnewline
35 & -0.009164 & -0.0948 & 0.46233 \tabularnewline
36 & -0.000827 & -0.0086 & 0.496597 \tabularnewline
37 & -0.024896 & -0.2575 & 0.398634 \tabularnewline
38 & -0.007248 & -0.075 & 0.470188 \tabularnewline
39 & -0.098114 & -1.0149 & 0.156222 \tabularnewline
40 & -0.034149 & -0.3532 & 0.362301 \tabularnewline
41 & 0.033157 & 0.343 & 0.366145 \tabularnewline
42 & -0.050545 & -0.5228 & 0.301084 \tabularnewline
43 & 0.023284 & 0.2409 & 0.405064 \tabularnewline
44 & 0.034217 & 0.3539 & 0.362041 \tabularnewline
45 & 0.023293 & 0.2409 & 0.405029 \tabularnewline
46 & -0.032161 & -0.3327 & 0.370016 \tabularnewline
47 & 0.066427 & 0.6871 & 0.246745 \tabularnewline
48 & 0.045595 & 0.4716 & 0.319074 \tabularnewline
49 & -0.039157 & -0.405 & 0.343128 \tabularnewline
50 & 0.03401 & 0.3518 & 0.362838 \tabularnewline
51 & 0.022681 & 0.2346 & 0.407477 \tabularnewline
52 & -0.013723 & -0.142 & 0.443692 \tabularnewline
53 & -0.148893 & -1.5402 & 0.063236 \tabularnewline
54 & -0.063205 & -0.6538 & 0.257322 \tabularnewline
55 & -0.013996 & -0.1448 & 0.442579 \tabularnewline
56 & -0.017757 & -0.1837 & 0.427305 \tabularnewline
57 & -0.030366 & -0.3141 & 0.377026 \tabularnewline
58 & -0.083732 & -0.8661 & 0.194179 \tabularnewline
59 & 0.072199 & 0.7468 & 0.228403 \tabularnewline
60 & -0.115575 & -1.1955 & 0.117264 \tabularnewline
\hline
\end{tabular}
%Source: https://freestatistics.org/blog/index.php?pk=58981&T=2

[TABLE]
[ROW][C]Partial Autocorrelation Function[/C][/ROW]
[ROW][C]Time lag k[/C][C]PACF(k)[/C][C]T-STAT[/C][C]P-value[/C][/ROW]
[ROW][C]1[/C][C]0.511455[/C][C]5.2905[/C][C]0[/C][/ROW]
[ROW][C]2[/C][C]0.084602[/C][C]0.8751[/C][C]0.191733[/C][/ROW]
[ROW][C]3[/C][C]-0.042465[/C][C]-0.4393[/C][C]0.330677[/C][/ROW]
[ROW][C]4[/C][C]-0.19973[/C][C]-2.066[/C][C]0.020621[/C][/ROW]
[ROW][C]5[/C][C]0.105282[/C][C]1.089[/C][C]0.13929[/C][/ROW]
[ROW][C]6[/C][C]-0.081511[/C][C]-0.8432[/C][C]0.20051[/C][/ROW]
[ROW][C]7[/C][C]0.038231[/C][C]0.3955[/C][C]0.346642[/C][/ROW]
[ROW][C]8[/C][C]-0.193197[/C][C]-1.9984[/C][C]0.024103[/C][/ROW]
[ROW][C]9[/C][C]0.022015[/C][C]0.2277[/C][C]0.410145[/C][/ROW]
[ROW][C]10[/C][C]0.099979[/C][C]1.0342[/C][C]0.151689[/C][/ROW]
[ROW][C]11[/C][C]0.160088[/C][C]1.656[/C][C]0.05033[/C][/ROW]
[ROW][C]12[/C][C]-0.013901[/C][C]-0.1438[/C][C]0.442966[/C][/ROW]
[ROW][C]13[/C][C]-0.077516[/C][C]-0.8018[/C][C]0.212215[/C][/ROW]
[ROW][C]14[/C][C]-0.092011[/C][C]-0.9518[/C][C]0.17168[/C][/ROW]
[ROW][C]15[/C][C]0.095593[/C][C]0.9888[/C][C]0.162491[/C][/ROW]
[ROW][C]16[/C][C]-0.130076[/C][C]-1.3455[/C][C]0.090652[/C][/ROW]
[ROW][C]17[/C][C]0.222757[/C][C]2.3042[/C][C]0.011571[/C][/ROW]
[ROW][C]18[/C][C]0.009612[/C][C]0.0994[/C][C]0.460492[/C][/ROW]
[ROW][C]19[/C][C]-0.078403[/C][C]-0.811[/C][C]0.209581[/C][/ROW]
[ROW][C]20[/C][C]0.047384[/C][C]0.4901[/C][C]0.312517[/C][/ROW]
[ROW][C]21[/C][C]0.061206[/C][C]0.6331[/C][C]0.264004[/C][/ROW]
[ROW][C]22[/C][C]0.036866[/C][C]0.3813[/C][C]0.351851[/C][/ROW]
[ROW][C]23[/C][C]-0.1307[/C][C]-1.352[/C][C]0.089617[/C][/ROW]
[ROW][C]24[/C][C]0.00352[/C][C]0.0364[/C][C]0.485512[/C][/ROW]
[ROW][C]25[/C][C]-0.084581[/C][C]-0.8749[/C][C]0.191792[/C][/ROW]
[ROW][C]26[/C][C]-0.031177[/C][C]-0.3225[/C][C]0.373854[/C][/ROW]
[ROW][C]27[/C][C]-0.056488[/C][C]-0.5843[/C][C]0.280118[/C][/ROW]
[ROW][C]28[/C][C]0.081648[/C][C]0.8446[/C][C]0.200117[/C][/ROW]
[ROW][C]29[/C][C]-0.034597[/C][C]-0.3579[/C][C]0.360572[/C][/ROW]
[ROW][C]30[/C][C]-0.11563[/C][C]-1.1961[/C][C]0.117153[/C][/ROW]
[ROW][C]31[/C][C]0.019074[/C][C]0.1973[/C][C]0.421983[/C][/ROW]
[ROW][C]32[/C][C]-0.119299[/C][C]-1.234[/C][C]0.109947[/C][/ROW]
[ROW][C]33[/C][C]0.047349[/C][C]0.4898[/C][C]0.312646[/C][/ROW]
[ROW][C]34[/C][C]-0.046268[/C][C]-0.4786[/C][C]0.316601[/C][/ROW]
[ROW][C]35[/C][C]-0.009164[/C][C]-0.0948[/C][C]0.46233[/C][/ROW]
[ROW][C]36[/C][C]-0.000827[/C][C]-0.0086[/C][C]0.496597[/C][/ROW]
[ROW][C]37[/C][C]-0.024896[/C][C]-0.2575[/C][C]0.398634[/C][/ROW]
[ROW][C]38[/C][C]-0.007248[/C][C]-0.075[/C][C]0.470188[/C][/ROW]
[ROW][C]39[/C][C]-0.098114[/C][C]-1.0149[/C][C]0.156222[/C][/ROW]
[ROW][C]40[/C][C]-0.034149[/C][C]-0.3532[/C][C]0.362301[/C][/ROW]
[ROW][C]41[/C][C]0.033157[/C][C]0.343[/C][C]0.366145[/C][/ROW]
[ROW][C]42[/C][C]-0.050545[/C][C]-0.5228[/C][C]0.301084[/C][/ROW]
[ROW][C]43[/C][C]0.023284[/C][C]0.2409[/C][C]0.405064[/C][/ROW]
[ROW][C]44[/C][C]0.034217[/C][C]0.3539[/C][C]0.362041[/C][/ROW]
[ROW][C]45[/C][C]0.023293[/C][C]0.2409[/C][C]0.405029[/C][/ROW]
[ROW][C]46[/C][C]-0.032161[/C][C]-0.3327[/C][C]0.370016[/C][/ROW]
[ROW][C]47[/C][C]0.066427[/C][C]0.6871[/C][C]0.246745[/C][/ROW]
[ROW][C]48[/C][C]0.045595[/C][C]0.4716[/C][C]0.319074[/C][/ROW]
[ROW][C]49[/C][C]-0.039157[/C][C]-0.405[/C][C]0.343128[/C][/ROW]
[ROW][C]50[/C][C]0.03401[/C][C]0.3518[/C][C]0.362838[/C][/ROW]
[ROW][C]51[/C][C]0.022681[/C][C]0.2346[/C][C]0.407477[/C][/ROW]
[ROW][C]52[/C][C]-0.013723[/C][C]-0.142[/C][C]0.443692[/C][/ROW]
[ROW][C]53[/C][C]-0.148893[/C][C]-1.5402[/C][C]0.063236[/C][/ROW]
[ROW][C]54[/C][C]-0.063205[/C][C]-0.6538[/C][C]0.257322[/C][/ROW]
[ROW][C]55[/C][C]-0.013996[/C][C]-0.1448[/C][C]0.442579[/C][/ROW]
[ROW][C]56[/C][C]-0.017757[/C][C]-0.1837[/C][C]0.427305[/C][/ROW]
[ROW][C]57[/C][C]-0.030366[/C][C]-0.3141[/C][C]0.377026[/C][/ROW]
[ROW][C]58[/C][C]-0.083732[/C][C]-0.8661[/C][C]0.194179[/C][/ROW]
[ROW][C]59[/C][C]0.072199[/C][C]0.7468[/C][C]0.228403[/C][/ROW]
[ROW][C]60[/C][C]-0.115575[/C][C]-1.1955[/C][C]0.117264[/C][/ROW]
[/TABLE]
Source: https://freestatistics.org/blog/index.php?pk=58981&T=2

Globally Unique Identifier (entire table): ba.freestatistics.org/blog/index.php?pk=58981&T=2

As an alternative you can also use a QR Code:  

The GUIDs for individual cells are displayed in the table below:

Partial Autocorrelation Function
Time lag kPACF(k)T-STATP-value
10.5114555.29050
20.0846020.87510.191733
3-0.042465-0.43930.330677
4-0.19973-2.0660.020621
50.1052821.0890.13929
6-0.081511-0.84320.20051
70.0382310.39550.346642
8-0.193197-1.99840.024103
90.0220150.22770.410145
100.0999791.03420.151689
110.1600881.6560.05033
12-0.013901-0.14380.442966
13-0.077516-0.80180.212215
14-0.092011-0.95180.17168
150.0955930.98880.162491
16-0.130076-1.34550.090652
170.2227572.30420.011571
180.0096120.09940.460492
19-0.078403-0.8110.209581
200.0473840.49010.312517
210.0612060.63310.264004
220.0368660.38130.351851
23-0.1307-1.3520.089617
240.003520.03640.485512
25-0.084581-0.87490.191792
26-0.031177-0.32250.373854
27-0.056488-0.58430.280118
280.0816480.84460.200117
29-0.034597-0.35790.360572
30-0.11563-1.19610.117153
310.0190740.19730.421983
32-0.119299-1.2340.109947
330.0473490.48980.312646
34-0.046268-0.47860.316601
35-0.009164-0.09480.46233
36-0.000827-0.00860.496597
37-0.024896-0.25750.398634
38-0.007248-0.0750.470188
39-0.098114-1.01490.156222
40-0.034149-0.35320.362301
410.0331570.3430.366145
42-0.050545-0.52280.301084
430.0232840.24090.405064
440.0342170.35390.362041
450.0232930.24090.405029
46-0.032161-0.33270.370016
470.0664270.68710.246745
480.0455950.47160.319074
49-0.039157-0.4050.343128
500.034010.35180.362838
510.0226810.23460.407477
52-0.013723-0.1420.443692
53-0.148893-1.54020.063236
54-0.063205-0.65380.257322
55-0.013996-0.14480.442579
56-0.017757-0.18370.427305
57-0.030366-0.31410.377026
58-0.083732-0.86610.194179
590.0721990.74680.228403
60-0.115575-1.19550.117264


Parameters (Session):
par1 = 60 ; par2 = 1 ; par3 = 1 ; par4 = 0 ; par5 = 12 ; par6 = MA ; par7 = 0.95 ;
Parameters (R input):
par1 = 60 ; par2 = 1 ; par3 = 1 ; par4 = 0 ; par5 = 12 ; par6 = MA ; par7 = 0.95 ;
R code (references can be found in the software module):
if (par1 == 'Default') {
par1 = 10*log10(length(x))
} else {
par1 <- as.numeric(par1)
}
par2 <- as.numeric(par2)
par3 <- as.numeric(par3)
par4 <- as.numeric(par4)
par5 <- as.numeric(par5)
if (par6 == 'White Noise') par6 <- 'white' else par6 <- 'ma'
par7 <- as.numeric(par7)
if (par2 == 0) {
x <- log(x)
} else {
x <- (x ^ par2 - 1) / par2
}
if (par3 > 0) x <- diff(x,lag=1,difference=par3)
if (par4 > 0) x <- diff(x,lag=par5,difference=par4)
bitmap(file='pic1.png')
racf <- acf(x, par1, main='Autocorrelation', xlab='time lag', ylab='ACF', ci.type=par6, ci=par7, sub=paste('(lambda=',par2,', d=',par3,', D=',par4,', CI=', par7, ', CI type=',par6,')',sep=''))
dev.off()
bitmap(file='pic2.png')
rpacf <- pacf(x,par1,main='Partial Autocorrelation',xlab='lags',ylab='PACF')
dev.off()
(myacf <- c(racf$acf))
(mypacf <- c(rpacf$acf))
lengthx <- length(x)
sqrtn <- sqrt(lengthx)
load(file='createtable')
a<-table.start()
a<-table.row.start(a)
a<-table.element(a,'Autocorrelation Function',4,TRUE)
a<-table.row.end(a)
a<-table.row.start(a)
a<-table.element(a,'Time lag k',header=TRUE)
a<-table.element(a,hyperlink('basics.htm','ACF(k)','click here for more information about the Autocorrelation Function'),header=TRUE)
a<-table.element(a,'T-STAT',header=TRUE)
a<-table.element(a,'P-value',header=TRUE)
a<-table.row.end(a)
for (i in 2:(par1+1)) {
a<-table.row.start(a)
a<-table.element(a,i-1,header=TRUE)
a<-table.element(a,round(myacf[i],6))
mytstat <- myacf[i]*sqrtn
a<-table.element(a,round(mytstat,4))
a<-table.element(a,round(1-pt(abs(mytstat),lengthx),6))
a<-table.row.end(a)
}
a<-table.end(a)
table.save(a,file='mytable.tab')
a<-table.start()
a<-table.row.start(a)
a<-table.element(a,'Partial Autocorrelation Function',4,TRUE)
a<-table.row.end(a)
a<-table.row.start(a)
a<-table.element(a,'Time lag k',header=TRUE)
a<-table.element(a,hyperlink('basics.htm','PACF(k)','click here for more information about the Partial Autocorrelation Function'),header=TRUE)
a<-table.element(a,'T-STAT',header=TRUE)
a<-table.element(a,'P-value',header=TRUE)
a<-table.row.end(a)
for (i in 1:par1) {
a<-table.row.start(a)
a<-table.element(a,i,header=TRUE)
a<-table.element(a,round(mypacf[i],6))
mytstat <- mypacf[i]*sqrtn
a<-table.element(a,round(mytstat,4))
a<-table.element(a,round(1-pt(abs(mytstat),lengthx),6))
a<-table.row.end(a)
}
a<-table.end(a)
table.save(a,file='mytable1.tab')