| Multiple Linear Regression - Estimated Regression Equation |
| Y[t] = + 5.81666666666664 + 13.6895833333334X[t] + e[t] |
| Multiple Linear Regression - Ordinary Least Squares | |||||
| Variable | Parameter | S.D. | T-STAT H0: parameter = 0 | 2-tail p-value | 1-tail p-value |
| (Intercept) | 5.81666666666664 | 1.043263 | 5.5755 | 1e-06 | 0 |
| X | 13.6895833333334 | 1.166403 | 11.7366 | 0 | 0 |
| Multiple Linear Regression - Regression Statistics | |
| Multiple R | 0.838867982627093 |
| R-squared | 0.703699492276849 |
| Adjusted R-squared | 0.698590862833346 |
| F-TEST (value) | 137.747217734073 |
| F-TEST (DF numerator) | 1 |
| F-TEST (DF denominator) | 58 |
| p-value | 0 |
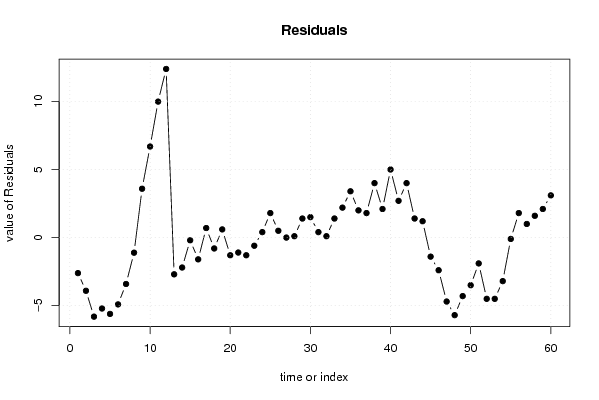
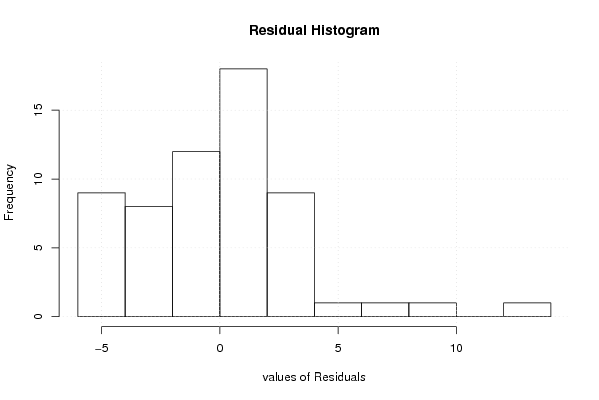
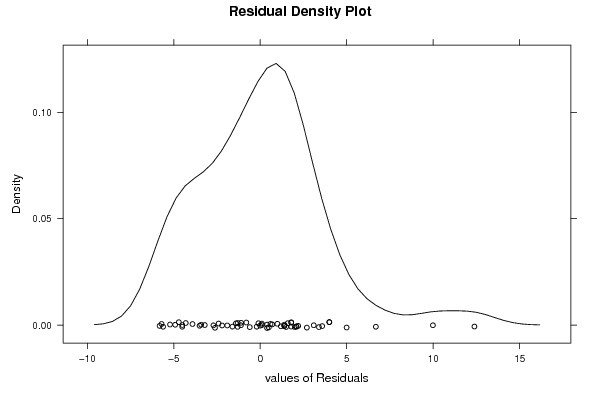
| Multiple Linear Regression - Residual Statistics | |
| Residual Standard Deviation | 3.61396904664594 |
| Sum Squared Residuals | 757.524791666667 |
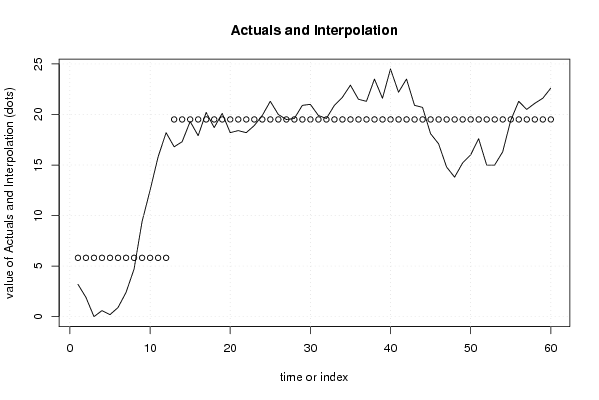
| Multiple Linear Regression - Actuals, Interpolation, and Residuals | |||
| Time or Index | Actuals | Interpolation Forecast | Residuals Prediction Error |
| 1 | 3.2 | 5.81666666666671 | -2.61666666666671 |
| 2 | 1.9 | 5.8166666666667 | -3.9166666666667 |
| 3 | 0 | 5.81666666666666 | -5.81666666666666 |
| 4 | 0.6 | 5.81666666666666 | -5.21666666666666 |
| 5 | 0.2 | 5.81666666666666 | -5.61666666666666 |
| 6 | 0.9 | 5.81666666666666 | -4.91666666666666 |
| 7 | 2.4 | 5.81666666666666 | -3.41666666666666 |
| 8 | 4.7 | 5.81666666666666 | -1.11666666666666 |
| 9 | 9.4 | 5.81666666666666 | 3.58333333333334 |
| 10 | 12.5 | 5.81666666666666 | 6.68333333333334 |
| 11 | 15.8 | 5.81666666666666 | 9.98333333333334 |
| 12 | 18.2 | 5.81666666666666 | 12.3833333333333 |
| 13 | 16.8 | 19.50625 | -2.70625 |
| 14 | 17.3 | 19.50625 | -2.20625 |
| 15 | 19.3 | 19.50625 | -0.206249999999999 |
| 16 | 17.9 | 19.50625 | -1.60625 |
| 17 | 20.2 | 19.50625 | 0.69375 |
| 18 | 18.7 | 19.50625 | -0.80625 |
| 19 | 20.1 | 19.50625 | 0.593750000000002 |
| 20 | 18.2 | 19.50625 | -1.30625 |
| 21 | 18.4 | 19.50625 | -1.10625000000000 |
| 22 | 18.2 | 19.50625 | -1.30625 |
| 23 | 18.9 | 19.50625 | -0.606250000000001 |
| 24 | 19.9 | 19.50625 | 0.393749999999999 |
| 25 | 21.3 | 19.50625 | 1.79375 |
| 26 | 20 | 19.50625 | 0.49375 |
| 27 | 19.5 | 19.50625 | -0.00624999999999976 |
| 28 | 19.6 | 19.50625 | 0.0937500000000017 |
| 29 | 20.9 | 19.50625 | 1.39375 |
| 30 | 21 | 19.50625 | 1.49375 |
| 31 | 19.9 | 19.50625 | 0.393749999999999 |
| 32 | 19.6 | 19.50625 | 0.0937500000000017 |
| 33 | 20.9 | 19.50625 | 1.39375 |
| 34 | 21.7 | 19.50625 | 2.19375 |
| 35 | 22.9 | 19.50625 | 3.39375 |
| 36 | 21.5 | 19.50625 | 1.99375 |
| 37 | 21.3 | 19.50625 | 1.79375 |
| 38 | 23.5 | 19.50625 | 3.99375 |
| 39 | 21.6 | 19.50625 | 2.09375 |
| 40 | 24.5 | 19.50625 | 4.99375 |
| 41 | 22.2 | 19.50625 | 2.69375 |
| 42 | 23.5 | 19.50625 | 3.99375 |
| 43 | 20.9 | 19.50625 | 1.39375 |
| 44 | 20.7 | 19.50625 | 1.19375 |
| 45 | 18.1 | 19.50625 | -1.40625000000000 |
| 46 | 17.1 | 19.50625 | -2.40625 |
| 47 | 14.8 | 19.50625 | -4.70625 |
| 48 | 13.8 | 19.50625 | -5.70625 |
| 49 | 15.2 | 19.50625 | -4.30625 |
| 50 | 16 | 19.50625 | -3.50625 |
| 51 | 17.6 | 19.50625 | -1.90625 |
| 52 | 15 | 19.50625 | -4.50625 |
| 53 | 15 | 19.50625 | -4.50625 |
| 54 | 16.3 | 19.50625 | -3.20625 |
| 55 | 19.4 | 19.50625 | -0.106250000000001 |
| 56 | 21.3 | 19.50625 | 1.79375 |
| 57 | 20.5 | 19.50625 | 0.99375 |
| 58 | 21.1 | 19.50625 | 1.59375000000000 |
| 59 | 21.6 | 19.50625 | 2.09375 |
| 60 | 22.6 | 19.50625 | 3.09375 |
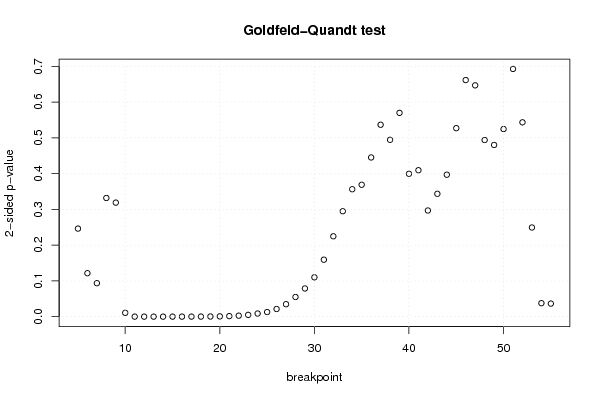
| Goldfeld-Quandt test for Heteroskedasticity | |||
| p-values | Alternative Hypothesis | ||
| breakpoint index | greater | 2-sided | less |
| 5 | 0.123150511609714 | 0.246301023219428 | 0.876849488390286 |
| 6 | 0.0607720626191958 | 0.121544125238392 | 0.939227937380804 |
| 7 | 0.0468095311278893 | 0.0936190622557786 | 0.95319046887211 |
| 8 | 0.16595332683969 | 0.33190665367938 | 0.83404667316031 |
| 9 | 0.840565676979509 | 0.318868646040983 | 0.159434323020491 |
| 10 | 0.994658913575692 | 0.0106821728486168 | 0.00534108642430838 |
| 11 | 0.999935870279595 | 0.000128259440810105 | 6.41297204050523e-05 |
| 12 | 0.999998957410045 | 2.0851799097921e-06 | 1.04258995489605e-06 |
| 13 | 0.999997853739072 | 4.29252185671588e-06 | 2.14626092835794e-06 |
| 14 | 0.999995380202273 | 9.23959545498073e-06 | 4.61979772749037e-06 |
| 15 | 0.999989151627274 | 2.16967454527043e-05 | 1.08483727263521e-05 |
| 16 | 0.99997648242797 | 4.70351440596933e-05 | 2.35175720298467e-05 |
| 17 | 0.999950939524722 | 9.81209505559624e-05 | 4.90604752779812e-05 |
| 18 | 0.999893894988669 | 0.000212210022662064 | 0.000106105011331032 |
| 19 | 0.999785142135737 | 0.00042971572852514 | 0.00021485786426257 |
| 20 | 0.99958853462418 | 0.000822930751640584 | 0.000411465375820292 |
| 21 | 0.9992248840589 | 0.00155023188219967 | 0.000775115941099837 |
| 22 | 0.998619900890076 | 0.0027601982198477 | 0.00138009910992385 |
| 23 | 0.997499867086882 | 0.00500026582623705 | 0.00250013291311852 |
| 24 | 0.995636392467387 | 0.00872721506522592 | 0.00436360753261296 |
| 25 | 0.993551895057171 | 0.0128962098856571 | 0.00644810494282857 |
| 26 | 0.989296854609021 | 0.0214062907819580 | 0.0107031453909790 |
| 27 | 0.982573705044473 | 0.0348525899110531 | 0.0174262949555265 |
| 28 | 0.972537194843779 | 0.0549256103124421 | 0.0274628051562210 |
| 29 | 0.96057623512777 | 0.0788475297444597 | 0.0394237648722299 |
| 30 | 0.94499826472776 | 0.110003470544480 | 0.0550017352722401 |
| 31 | 0.92034635515082 | 0.15930728969836 | 0.07965364484918 |
| 32 | 0.887624602549118 | 0.224750794901764 | 0.112375397450882 |
| 33 | 0.852556212465746 | 0.294887575068508 | 0.147443787534254 |
| 34 | 0.821808416355114 | 0.356383167289772 | 0.178191583644886 |
| 35 | 0.81557080968427 | 0.368858380631461 | 0.184429190315731 |
| 36 | 0.777407066153003 | 0.445185867693993 | 0.222592933846996 |
| 37 | 0.73164099938193 | 0.536718001236139 | 0.268359000618070 |
| 38 | 0.752725467546986 | 0.494549064906028 | 0.247274532453014 |
| 39 | 0.715006401732449 | 0.569987196535102 | 0.284993598267551 |
| 40 | 0.800244456904326 | 0.399511086191349 | 0.199755543095674 |
| 41 | 0.795241526256726 | 0.409516947486549 | 0.204758473743275 |
| 42 | 0.851539750509942 | 0.296920498980117 | 0.148460249490058 |
| 43 | 0.828197532163548 | 0.343604935672903 | 0.171802467836452 |
| 44 | 0.80151495184863 | 0.396970096302739 | 0.198485048151370 |
| 45 | 0.736437190854881 | 0.527125618290238 | 0.263562809145119 |
| 46 | 0.669160922956759 | 0.661678154086482 | 0.330839077043241 |
| 47 | 0.676518038013102 | 0.646963923973797 | 0.323481961986898 |
| 48 | 0.753027737804964 | 0.493944524390072 | 0.246972262195036 |
| 49 | 0.759913271547688 | 0.480173456904624 | 0.240086728452312 |
| 50 | 0.737644145915463 | 0.524711708169073 | 0.262355854084537 |
| 51 | 0.65361523832442 | 0.692769523351161 | 0.346384761675581 |
| 52 | 0.728247526775111 | 0.543504946449778 | 0.271752473224889 |
| 53 | 0.87532539099499 | 0.249349218010021 | 0.124674609005010 |
| 54 | 0.981158307257745 | 0.0376833854845093 | 0.0188416927422547 |
| 55 | 0.981734628503734 | 0.0365307429925325 | 0.0182653714962663 |
| Meta Analysis of Goldfeld-Quandt test for Heteroskedasticity | |||
| Description | # significant tests | % significant tests | OK/NOK |
| 1% type I error level | 14 | 0.274509803921569 | NOK |
| 5% type I error level | 20 | 0.392156862745098 | NOK |
| 10% type I error level | 23 | 0.450980392156863 | NOK |