| Multiple Linear Regression - Estimated Regression Equation |
| y[t] = + 0.989097746251875 + 0.00487608435585063x[t] + 1.40073692274530`y-1`[t] -0.574367374215303`y-2`[t] + 0.0852761437421179M1[t] + 0.289523775607878M2[t] + 0.286041328110218M3[t] + 0.0727959225051778M4[t] + 0.0651493773256329M5[t] + 0.0352599174579693M6[t] + 0.0815601084452934M7[t] -0.00106378547321905M8[t] + 0.297128142922298M9[t] -0.134853023618768M10[t] + 0.00937862150184482M11[t] -0.00168436928728821t + e[t] |
| Multiple Linear Regression - Ordinary Least Squares | |||||
| Variable | Parameter | S.D. | T-STAT H0: parameter = 0 | 2-tail p-value | 1-tail p-value |
| (Intercept) | 0.989097746251875 | 0.461344 | 2.1439 | 0.038169 | 0.019084 |
| x | 0.00487608435585063 | 0.092619 | 0.0526 | 0.958276 | 0.479138 |
| `y-1` | 1.40073692274530 | 0.134845 | 10.3877 | 0 | 0 |
| `y-2` | -0.574367374215303 | 0.141296 | -4.065 | 0.000219 | 0.000109 |
| M1 | 0.0852761437421179 | 0.123746 | 0.6891 | 0.494726 | 0.247363 |
| M2 | 0.289523775607878 | 0.124883 | 2.3184 | 0.025626 | 0.012813 |
| M3 | 0.286041328110218 | 0.134802 | 2.1219 | 0.040087 | 0.020043 |
| M4 | 0.0727959225051778 | 0.141842 | 0.5132 | 0.610621 | 0.30531 |
| M5 | 0.0651493773256329 | 0.136653 | 0.4767 | 0.636135 | 0.318067 |
| M6 | 0.0352599174579693 | 0.135379 | 0.2605 | 0.79585 | 0.397925 |
| M7 | 0.0815601084452934 | 0.133362 | 0.6116 | 0.544282 | 0.272141 |
| M8 | -0.00106378547321905 | 0.130128 | -0.0082 | 0.993518 | 0.496759 |
| M9 | 0.297128142922298 | 0.132039 | 2.2503 | 0.029998 | 0.014999 |
| M10 | -0.134853023618768 | 0.133602 | -1.0094 | 0.318866 | 0.159433 |
| M11 | 0.00937862150184482 | 0.130278 | 0.072 | 0.942969 | 0.471485 |
| t | -0.00168436928728821 | 0.002882 | -0.5844 | 0.562264 | 0.281132 |
| Multiple Linear Regression - Regression Statistics | |
| Multiple R | 0.956435186436456 |
| R-squared | 0.914768265853738 |
| Adjusted R-squared | 0.88280636554889 |
| F-TEST (value) | 28.6205844185986 |
| F-TEST (DF numerator) | 15 |
| F-TEST (DF denominator) | 40 |
| p-value | 1.11022302462516e-16 |
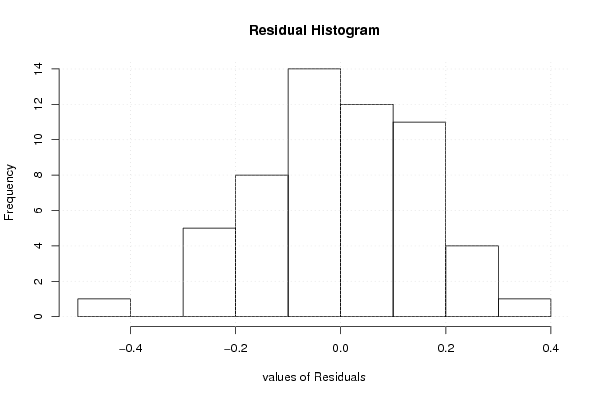
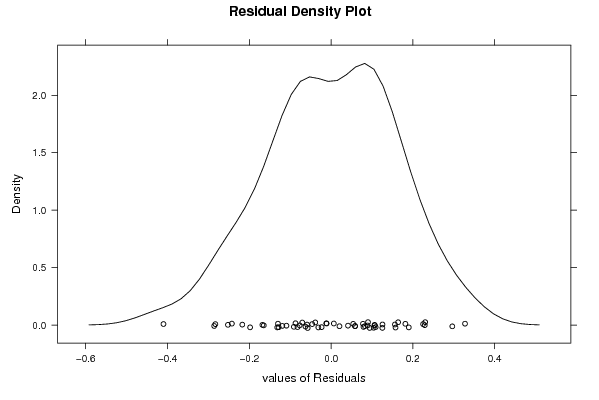
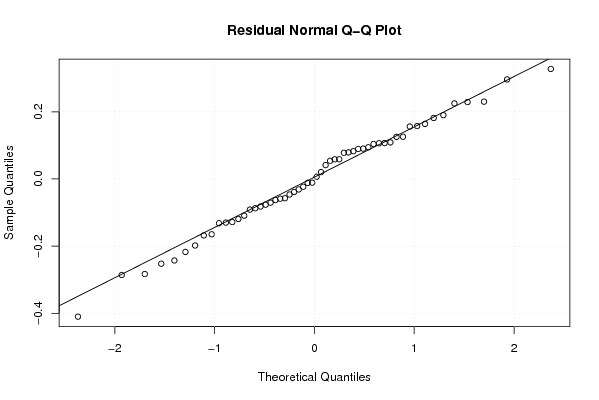
| Multiple Linear Regression - Residual Statistics | |
| Residual Standard Deviation | 0.183690648242067 |
| Sum Squared Residuals | 1.34969017006363 |
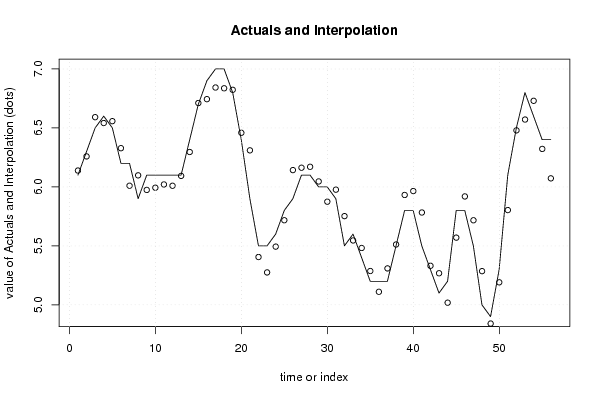
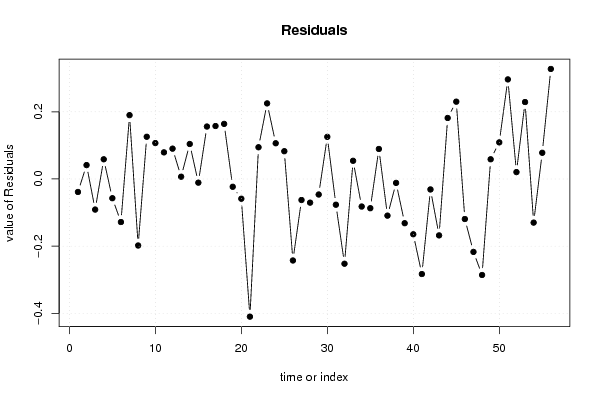
| Multiple Linear Regression - Actuals, Interpolation, and Residuals | |||
| Time or Index | Actuals | Interpolation Forecast | Residuals Prediction Error |
| 1 | 6.1 | 6.13874398417115 | -0.0387439841711496 |
| 2 | 6.3 | 6.25867029189661 | 0.0413297081033868 |
| 3 | 6.5 | 6.59108759708225 | -0.0910875970822549 |
| 4 | 6.6 | 6.54143173189593 | 0.0585682681040732 |
| 5 | 6.5 | 6.55730103486056 | -0.0573010348605629 |
| 6 | 6.2 | 6.32821677600955 | -0.128216776009552 |
| 7 | 6.2 | 6.01004825830753 | 0.189951741692472 |
| 8 | 5.9 | 6.09805020736632 | -0.198050207366318 |
| 9 | 6.1 | 5.97433668965096 | 0.125663310349041 |
| 10 | 6.1 | 5.99312875063625 | 0.106871249363746 |
| 11 | 6.1 | 6.02080255162652 | 0.0791974483734817 |
| 12 | 6.1 | 6.00973956083739 | 0.0902604391626146 |
| 13 | 6.1 | 6.09333133529221 | 0.00666866470778512 |
| 14 | 6.4 | 6.29589459787069 | 0.104105402129314 |
| 15 | 6.7 | 6.71094885790933 | -0.0109488579093281 |
| 16 | 6.9 | 6.743929947576 | 0.156070052424002 |
| 17 | 7 | 6.84243620539363 | 0.157563794606366 |
| 18 | 7 | 6.83606259367015 | 0.163937406329849 |
| 19 | 6.8 | 6.82324167794866 | -0.0232416779486567 |
| 20 | 6.4 | 6.4587860301938 | -0.0587860301937957 |
| 21 | 5.9 | 6.30987229504697 | -0.409872295046968 |
| 22 | 5.5 | 5.40558524753209 | 0.0944147524679146 |
| 23 | 5.5 | 5.27502144137494 | 0.224978558625058 |
| 24 | 5.6 | 5.49370540027193 | 0.10629459972807 |
| 25 | 5.8 | 5.71737086700129 | 0.0826291329987112 |
| 26 | 5.9 | 6.14264477670729 | -0.242644776707289 |
| 27 | 6.1 | 6.16267817735381 | -0.0626781773538121 |
| 28 | 6.1 | 6.17045904958901 | -0.0704590495890119 |
| 29 | 6 | 6.04625466027912 | -0.0462546602791184 |
| 30 | 6 | 5.87460713884964 | 0.125392861150363 |
| 31 | 5.9 | 5.9766596979712 | -0.0766596979712029 |
| 32 | 5.5 | 5.75227774249087 | -0.252277742490873 |
| 33 | 5.6 | 5.54592726992251 | 0.0540727300774864 |
| 34 | 5.4 | 5.48208237605481 | -0.0820823760548086 |
| 35 | 5.2 | 5.28704552991755 | -0.0870455299175448 |
| 36 | 5.2 | 5.11070862942241 | 0.0892913705775878 |
| 37 | 5.2 | 5.3091738787203 | -0.109173878720302 |
| 38 | 5.5 | 5.51173714129877 | -0.0117371412987739 |
| 39 | 5.8 | 5.93166748569327 | -0.131667485693266 |
| 40 | 5.8 | 5.96464857535994 | -0.164648575359936 |
| 41 | 5.5 | 5.78300744862851 | -0.283007448628513 |
| 42 | 5.3 | 5.33121254264997 | -0.0312125426499719 |
| 43 | 5.1 | 5.26799119206554 | -0.167991192065539 |
| 44 | 5.2 | 5.01840901915374 | 0.181590980846262 |
| 45 | 5.8 | 5.56986374537956 | 0.230136254620441 |
| 46 | 5.8 | 5.91920362577685 | -0.119203625776852 |
| 47 | 5.5 | 5.717130477081 | -0.217130477080995 |
| 48 | 5 | 5.28584640946827 | -0.285846409468273 |
| 49 | 4.9 | 4.84137993481504 | 0.0586200651849557 |
| 50 | 5.3 | 5.19105319222664 | 0.108946807773362 |
| 51 | 6.1 | 5.80361788196134 | 0.296382118038661 |
| 52 | 6.5 | 6.47953069557913 | 0.0204693044208727 |
| 53 | 6.8 | 6.57100065083817 | 0.228999349161828 |
| 54 | 6.6 | 6.72990094882069 | -0.129900948820688 |
| 55 | 6.4 | 6.32205917370707 | 0.077940826292927 |
| 56 | 6.4 | 6.07247700079528 | 0.327522999204726 |
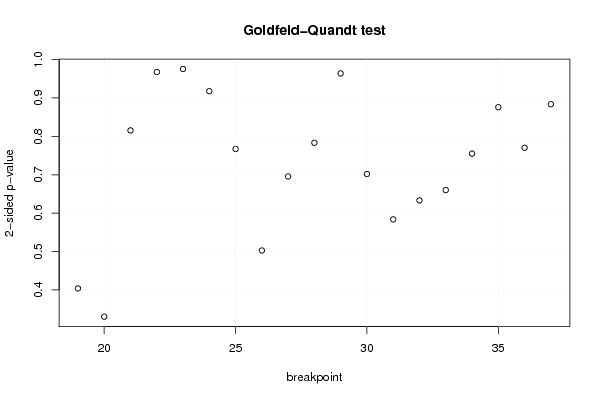
| Goldfeld-Quandt test for Heteroskedasticity | |||
| p-values | Alternative Hypothesis | ||
| breakpoint index | greater | 2-sided | less |
| 19 | 0.201967753741900 | 0.403935507483799 | 0.7980322462581 |
| 20 | 0.165174100137253 | 0.330348200274506 | 0.834825899862747 |
| 21 | 0.592234752328878 | 0.815530495342243 | 0.407765247671122 |
| 22 | 0.483801275897242 | 0.967602551794484 | 0.516198724102758 |
| 23 | 0.512190036439145 | 0.97561992712171 | 0.487809963560855 |
| 24 | 0.541176911949949 | 0.917646176100102 | 0.458823088050051 |
| 25 | 0.616463657710898 | 0.767072684578204 | 0.383536342289102 |
| 26 | 0.748611119696632 | 0.502777760606736 | 0.251388880303368 |
| 27 | 0.652223002538505 | 0.69555399492299 | 0.347776997461495 |
| 28 | 0.608403569228279 | 0.783192861543443 | 0.391596430771721 |
| 29 | 0.518015282828331 | 0.963969434343338 | 0.481984717171669 |
| 30 | 0.649028763274184 | 0.701942473451632 | 0.350971236725816 |
| 31 | 0.708113928431813 | 0.583772143136375 | 0.291886071568188 |
| 32 | 0.683400822163906 | 0.633198355672187 | 0.316599177836094 |
| 33 | 0.669954954154463 | 0.660090091691074 | 0.330045045845537 |
| 34 | 0.622517628640455 | 0.75496474271909 | 0.377482371359545 |
| 35 | 0.562026456742789 | 0.875947086514423 | 0.437973543257211 |
| 36 | 0.614844360348184 | 0.770311279303633 | 0.385155639651816 |
| 37 | 0.441861809500934 | 0.883723619001867 | 0.558138190499066 |
| Meta Analysis of Goldfeld-Quandt test for Heteroskedasticity | |||
| Description | # significant tests | % significant tests | OK/NOK |
| 1% type I error level | 0 | 0 | OK |
| 5% type I error level | 0 | 0 | OK |
| 10% type I error level | 0 | 0 | OK |