Free Statistics

of Irreproducible Research!

Author's title

Author*The author of this computation has been verified*
R Software Modulerwasp_multipleregression.wasp
Title produced by softwareMultiple Regression
Date of computationMon, 23 Nov 2009 13:31:52 -0700
Cite this page as followsStatistical Computations at FreeStatistics.org, Office for Research Development and Education, URL https://freestatistics.org/blog/index.php?v=date/2009/Nov/23/t1259008361oxxewtuazyke4bk.htm/, Retrieved Fri, 03 May 2024 13:14:30 +0000
Statistical Computations at FreeStatistics.org, Office for Research Development and Education, URL https://freestatistics.org/blog/index.php?pk=58899, Retrieved Fri, 03 May 2024 13:14:30 +0000
QR Codes:

Original text written by user:
IsPrivate?No (this computation is public)
User-defined keywordslineaire trend
Estimated Impact113
Family? (F = Feedback message, R = changed R code, M = changed R Module, P = changed Parameters, D = changed Data)
-     [Multiple Regression] [Q1 The Seatbeltlaw] [2007-11-14 19:27:43] [8cd6641b921d30ebe00b648d1481bba0]
- RMPD  [Multiple Regression] [Seatbelt] [2009-11-12 14:03:14] [b98453cac15ba1066b407e146608df68]
-    D    [Multiple Regression] [BBWS-2] [2009-11-23 20:14:10] [408e92805dcb18620260f240a7fb9d53]
-   P         [Multiple Regression] [BBWS7-3] [2009-11-23 20:31:52] [b32ceebc68d054278e6bda97f3d57f91] [Current]
Feedback Forum

Post a new message
Dataseries X:
3922	8.1
3759	7.7
4138	7.5
4634	7.6
3996	7.8
4308	7.8
4143	7.8
4429	7.5
5219	7.5
4929	7.1
5755	7.5
5592	7.5
4163	7.6
4962	7.7
5208	7.7
4755	7.9
4491	8.1
5732	8.2
5731	8.2
5040	8.2
6102	7.9
4904	7.3
5369	6.9
5578	6.6
4619	6.7
4731	6.9
5011	7
5299	7.1
4146	7.2
4625	7.1
4736	6.9
4219	7
5116	6.8
4205	6.4
4121	6.7
5103	6.6
4300	6.4
4578	6.3
3809	6.2
5526	6.5
4247	6.8
3830	6.8
4394	6.4
4826	6.1
4409	5.8
4569	6.1
4106	7.2
4794	7.3
3914	6.9
3793	6.1
4405	5.8
4022	6.2
4100	7.1
4788	7.7
3163	7.9
3585	7.7
3903	7.4
4178	7.5
3863	8
4187	8.1


Summary of computational transaction
Raw Inputview raw input (R code)
Raw Outputview raw output of R engine
Computing time5 seconds
R Server'Gwilym Jenkins' @ 72.249.127.135

\begin{tabular}{lllllllll}
\hline
Summary of computational transaction \tabularnewline
Raw Input & view raw input (R code)  \tabularnewline
Raw Output & view raw output of R engine  \tabularnewline
Computing time & 5 seconds \tabularnewline
R Server & 'Gwilym Jenkins' @ 72.249.127.135 \tabularnewline
\hline
\end{tabular}
%Source: https://freestatistics.org/blog/index.php?pk=58899&T=0

[TABLE]
[ROW][C]Summary of computational transaction[/C][/ROW]
[ROW][C]Raw Input[/C][C]view raw input (R code) [/C][/ROW]
[ROW][C]Raw Output[/C][C]view raw output of R engine [/C][/ROW]
[ROW][C]Computing time[/C][C]5 seconds[/C][/ROW]
[ROW][C]R Server[/C][C]'Gwilym Jenkins' @ 72.249.127.135[/C][/ROW]
[/TABLE]
Source: https://freestatistics.org/blog/index.php?pk=58899&T=0

Globally Unique Identifier (entire table): ba.freestatistics.org/blog/index.php?pk=58899&T=0

As an alternative you can also use a QR Code:  

The GUIDs for individual cells are displayed in the table below:

Summary of computational transaction
Raw Inputview raw input (R code)
Raw Outputview raw output of R engine
Computing time5 seconds
R Server'Gwilym Jenkins' @ 72.249.127.135


Multiple Linear Regression - Estimated Regression Equation
Bouw[t] = + 6446.10011836946 -106.382518310276Wman[t] -1067.36064862766M1[t] -890.214420729451M2[t] -733.829941000222M3[t] -360.003055411703M4[t] -957.610267625952M5[t] -466.821633868461M6[t] -681.109503773026M7[t] -692.180324776207M8[t] -168.161747244211M9[t] -564.815519346008M10[t] -421.167430827846M11[t] -17.4227315602574t + e[t]

\begin{tabular}{lllllllll}
\hline
Multiple Linear Regression - Estimated Regression Equation \tabularnewline
Bouw[t] =  +  6446.10011836946 -106.382518310276Wman[t] -1067.36064862766M1[t] -890.214420729451M2[t] -733.829941000222M3[t] -360.003055411703M4[t] -957.610267625952M5[t] -466.821633868461M6[t] -681.109503773026M7[t] -692.180324776207M8[t] -168.161747244211M9[t] -564.815519346008M10[t] -421.167430827846M11[t] -17.4227315602574t  + e[t] \tabularnewline
\hline
\end{tabular}
%Source: https://freestatistics.org/blog/index.php?pk=58899&T=1

[TABLE]
[ROW][C]Multiple Linear Regression - Estimated Regression Equation[/C][/ROW]
[ROW][C]Bouw[t] =  +  6446.10011836946 -106.382518310276Wman[t] -1067.36064862766M1[t] -890.214420729451M2[t] -733.829941000222M3[t] -360.003055411703M4[t] -957.610267625952M5[t] -466.821633868461M6[t] -681.109503773026M7[t] -692.180324776207M8[t] -168.161747244211M9[t] -564.815519346008M10[t] -421.167430827846M11[t] -17.4227315602574t  + e[t][/C][/ROW]
[/TABLE]
Source: https://freestatistics.org/blog/index.php?pk=58899&T=1

Globally Unique Identifier (entire table): ba.freestatistics.org/blog/index.php?pk=58899&T=1

As an alternative you can also use a QR Code:  

The GUIDs for individual cells are displayed in the table below:

Multiple Linear Regression - Estimated Regression Equation
Bouw[t] = + 6446.10011836946 -106.382518310276Wman[t] -1067.36064862766M1[t] -890.214420729451M2[t] -733.829941000222M3[t] -360.003055411703M4[t] -957.610267625952M5[t] -466.821633868461M6[t] -681.109503773026M7[t] -692.180324776207M8[t] -168.161747244211M9[t] -564.815519346008M10[t] -421.167430827846M11[t] -17.4227315602574t + e[t]


Multiple Linear Regression - Ordinary Least Squares
VariableParameterS.D.T-STATH0: parameter = 02-tail p-value1-tail p-value
(Intercept)6446.100118369461075.7180215.992400
Wman-106.382518310276132.146573-0.8050.4249420.212471
M1-1067.36064862766359.628835-2.9680.0047460.002373
M2-890.214420729451362.268806-2.45730.0178270.008914
M3-733.829941000222363.753797-2.01740.0495120.024756
M4-360.003055411703358.581873-1.0040.3206480.160324
M5-957.610267625952356.157477-2.68870.0099560.004978
M6-466.821633868461356.696624-1.30870.1971250.098562
M7-681.109503773026355.899972-1.91380.0618840.030942
M8-692.180324776207355.223747-1.94860.0574610.028731
M9-168.161747244211355.935043-0.47250.6388390.31942
M10-564.815519346008358.334909-1.57620.1218280.060914
M11-421.167430827846354.848398-1.18690.2413630.120681
t-17.42273156025744.819443-3.61510.0007420.000371

\begin{tabular}{lllllllll}
\hline
Multiple Linear Regression - Ordinary Least Squares \tabularnewline
Variable & Parameter & S.D. & T-STATH0: parameter = 0 & 2-tail p-value & 1-tail p-value \tabularnewline
(Intercept) & 6446.10011836946 & 1075.718021 & 5.9924 & 0 & 0 \tabularnewline
Wman & -106.382518310276 & 132.146573 & -0.805 & 0.424942 & 0.212471 \tabularnewline
M1 & -1067.36064862766 & 359.628835 & -2.968 & 0.004746 & 0.002373 \tabularnewline
M2 & -890.214420729451 & 362.268806 & -2.4573 & 0.017827 & 0.008914 \tabularnewline
M3 & -733.829941000222 & 363.753797 & -2.0174 & 0.049512 & 0.024756 \tabularnewline
M4 & -360.003055411703 & 358.581873 & -1.004 & 0.320648 & 0.160324 \tabularnewline
M5 & -957.610267625952 & 356.157477 & -2.6887 & 0.009956 & 0.004978 \tabularnewline
M6 & -466.821633868461 & 356.696624 & -1.3087 & 0.197125 & 0.098562 \tabularnewline
M7 & -681.109503773026 & 355.899972 & -1.9138 & 0.061884 & 0.030942 \tabularnewline
M8 & -692.180324776207 & 355.223747 & -1.9486 & 0.057461 & 0.028731 \tabularnewline
M9 & -168.161747244211 & 355.935043 & -0.4725 & 0.638839 & 0.31942 \tabularnewline
M10 & -564.815519346008 & 358.334909 & -1.5762 & 0.121828 & 0.060914 \tabularnewline
M11 & -421.167430827846 & 354.848398 & -1.1869 & 0.241363 & 0.120681 \tabularnewline
t & -17.4227315602574 & 4.819443 & -3.6151 & 0.000742 & 0.000371 \tabularnewline
\hline
\end{tabular}
%Source: https://freestatistics.org/blog/index.php?pk=58899&T=2

[TABLE]
[ROW][C]Multiple Linear Regression - Ordinary Least Squares[/C][/ROW]
[ROW][C]Variable[/C][C]Parameter[/C][C]S.D.[/C][C]T-STATH0: parameter = 0[/C][C]2-tail p-value[/C][C]1-tail p-value[/C][/ROW]
[ROW][C](Intercept)[/C][C]6446.10011836946[/C][C]1075.718021[/C][C]5.9924[/C][C]0[/C][C]0[/C][/ROW]
[ROW][C]Wman[/C][C]-106.382518310276[/C][C]132.146573[/C][C]-0.805[/C][C]0.424942[/C][C]0.212471[/C][/ROW]
[ROW][C]M1[/C][C]-1067.36064862766[/C][C]359.628835[/C][C]-2.968[/C][C]0.004746[/C][C]0.002373[/C][/ROW]
[ROW][C]M2[/C][C]-890.214420729451[/C][C]362.268806[/C][C]-2.4573[/C][C]0.017827[/C][C]0.008914[/C][/ROW]
[ROW][C]M3[/C][C]-733.829941000222[/C][C]363.753797[/C][C]-2.0174[/C][C]0.049512[/C][C]0.024756[/C][/ROW]
[ROW][C]M4[/C][C]-360.003055411703[/C][C]358.581873[/C][C]-1.004[/C][C]0.320648[/C][C]0.160324[/C][/ROW]
[ROW][C]M5[/C][C]-957.610267625952[/C][C]356.157477[/C][C]-2.6887[/C][C]0.009956[/C][C]0.004978[/C][/ROW]
[ROW][C]M6[/C][C]-466.821633868461[/C][C]356.696624[/C][C]-1.3087[/C][C]0.197125[/C][C]0.098562[/C][/ROW]
[ROW][C]M7[/C][C]-681.109503773026[/C][C]355.899972[/C][C]-1.9138[/C][C]0.061884[/C][C]0.030942[/C][/ROW]
[ROW][C]M8[/C][C]-692.180324776207[/C][C]355.223747[/C][C]-1.9486[/C][C]0.057461[/C][C]0.028731[/C][/ROW]
[ROW][C]M9[/C][C]-168.161747244211[/C][C]355.935043[/C][C]-0.4725[/C][C]0.638839[/C][C]0.31942[/C][/ROW]
[ROW][C]M10[/C][C]-564.815519346008[/C][C]358.334909[/C][C]-1.5762[/C][C]0.121828[/C][C]0.060914[/C][/ROW]
[ROW][C]M11[/C][C]-421.167430827846[/C][C]354.848398[/C][C]-1.1869[/C][C]0.241363[/C][C]0.120681[/C][/ROW]
[ROW][C]t[/C][C]-17.4227315602574[/C][C]4.819443[/C][C]-3.6151[/C][C]0.000742[/C][C]0.000371[/C][/ROW]
[/TABLE]
Source: https://freestatistics.org/blog/index.php?pk=58899&T=2

Globally Unique Identifier (entire table): ba.freestatistics.org/blog/index.php?pk=58899&T=2

As an alternative you can also use a QR Code:  

The GUIDs for individual cells are displayed in the table below:

Multiple Linear Regression - Ordinary Least Squares
VariableParameterS.D.T-STATH0: parameter = 02-tail p-value1-tail p-value
(Intercept)6446.100118369461075.7180215.992400
Wman-106.382518310276132.146573-0.8050.4249420.212471
M1-1067.36064862766359.628835-2.9680.0047460.002373
M2-890.214420729451362.268806-2.45730.0178270.008914
M3-733.829941000222363.753797-2.01740.0495120.024756
M4-360.003055411703358.581873-1.0040.3206480.160324
M5-957.610267625952356.157477-2.68870.0099560.004978
M6-466.821633868461356.696624-1.30870.1971250.098562
M7-681.109503773026355.899972-1.91380.0618840.030942
M8-692.180324776207355.223747-1.94860.0574610.028731
M9-168.161747244211355.935043-0.47250.6388390.31942
M10-564.815519346008358.334909-1.57620.1218280.060914
M11-421.167430827846354.848398-1.18690.2413630.120681
t-17.42273156025744.819443-3.61510.0007420.000371


Multiple Linear Regression - Regression Statistics
Multiple R0.611003276177982
R-squared0.373325003500227
Adjusted R-squared0.196221200141595
F-TEST (value)2.10794458628453
F-TEST (DF numerator)13
F-TEST (DF denominator)46
p-value0.0320159092689808
Multiple Linear Regression - Residual Statistics
Residual Standard Deviation561.003319836701
Sum Squared Residuals14477337.3439188

\begin{tabular}{lllllllll}
\hline
Multiple Linear Regression - Regression Statistics \tabularnewline
Multiple R & 0.611003276177982 \tabularnewline
R-squared & 0.373325003500227 \tabularnewline
Adjusted R-squared & 0.196221200141595 \tabularnewline
F-TEST (value) & 2.10794458628453 \tabularnewline
F-TEST (DF numerator) & 13 \tabularnewline
F-TEST (DF denominator) & 46 \tabularnewline
p-value & 0.0320159092689808 \tabularnewline
Multiple Linear Regression - Residual Statistics \tabularnewline
Residual Standard Deviation & 561.003319836701 \tabularnewline
Sum Squared Residuals & 14477337.3439188 \tabularnewline
\hline
\end{tabular}
%Source: https://freestatistics.org/blog/index.php?pk=58899&T=3

[TABLE]
[ROW][C]Multiple Linear Regression - Regression Statistics[/C][/ROW]
[ROW][C]Multiple R[/C][C]0.611003276177982[/C][/ROW]
[ROW][C]R-squared[/C][C]0.373325003500227[/C][/ROW]
[ROW][C]Adjusted R-squared[/C][C]0.196221200141595[/C][/ROW]
[ROW][C]F-TEST (value)[/C][C]2.10794458628453[/C][/ROW]
[ROW][C]F-TEST (DF numerator)[/C][C]13[/C][/ROW]
[ROW][C]F-TEST (DF denominator)[/C][C]46[/C][/ROW]
[ROW][C]p-value[/C][C]0.0320159092689808[/C][/ROW]
[ROW][C]Multiple Linear Regression - Residual Statistics[/C][/ROW]
[ROW][C]Residual Standard Deviation[/C][C]561.003319836701[/C][/ROW]
[ROW][C]Sum Squared Residuals[/C][C]14477337.3439188[/C][/ROW]
[/TABLE]
Source: https://freestatistics.org/blog/index.php?pk=58899&T=3

Globally Unique Identifier (entire table): ba.freestatistics.org/blog/index.php?pk=58899&T=3

As an alternative you can also use a QR Code:  

The GUIDs for individual cells are displayed in the table below:

Multiple Linear Regression - Regression Statistics
Multiple R0.611003276177982
R-squared0.373325003500227
Adjusted R-squared0.196221200141595
F-TEST (value)2.10794458628453
F-TEST (DF numerator)13
F-TEST (DF denominator)46
p-value0.0320159092689808
Multiple Linear Regression - Residual Statistics
Residual Standard Deviation561.003319836701
Sum Squared Residuals14477337.3439188


Multiple Linear Regression - Actuals, Interpolation, and Residuals
Time or IndexActualsInterpolationForecastResidualsPrediction Error
139224499.61833986833-577.618339868325
237594701.89484353037-942.89484353037
341384862.1330953614-724.133095361397
446345207.89899755863-573.89899755863
539964571.59255012207-575.592550122068
643085044.9584523193-736.958452319301
741434813.24785085448-670.247850854479
844294816.66905378412-387.669053784123
952195323.26489975586-104.264899755863
1049294951.74140341792-22.7414034179176
1157555035.41375305171719.586246948289
1255925439.1584523193152.841547680700
1341634343.73682030036-180.736820300360
1449624492.82206480728469.177935192721
1552084631.78381297625576.216187023748
1647554966.91146334246-211.911463342458
1744914330.60501590590160.394984094104
1857324793.3326662721938.6673337279
1957314561.622064807281169.37793519272
2050404533.12851224384506.871487756159
2161025071.639113708661030.36088629134
2249044721.39212103277182.607878967227
2353694890.17048531479478.829514685211
2455785325.82994007546252.170059924540
2546194230.40830805652388.591691943481
2647314368.85530073241362.144699267589
2750114497.17879707036513.821202929645
2852994842.94469926759456.055300732411
2941464217.27650366205-71.2765036620552
3046254701.28065769032-76.2806576903159
3147364490.84655988755245.153440112451
3242194451.71475549308-232.714755493083
3351164979.58710512688136.412894873123
3442054608.06360878893-403.063608788932
3541214702.37421025375-581.374210253755
3651035116.75716135237-13.7571613523704
3743004053.25028482651246.749715173488
3845784223.61203299549354.387967004513
3938094373.21203299549-564.212032995487
4055264697.70143153067828.298568469335
4142474050.75673226308196.243267736924
4238304524.12263446031-694.122634460309
4343944334.9650403196059.0349596804023
4448264338.38624324924487.613756750759
4544094876.89684471406-467.896844714064
4645694430.90558555893138.094414441074
4741064440.11017237553-334.110172375528
4847944833.21661981209-39.2166198120883
4939143790.98624694829123.013753051715
5037934035.81575793445-242.815757934454
5144054206.69226159651198.307738403492
5240224520.54340830066-498.543408300659
5341003809.76919804690290.230801953095
5447884219.30558925797568.694410742028
5531633966.31848413109-803.318484131095
5635853959.10143522971-374.101435229711
5739034497.61203669453-594.612036694534
5841784072.89728120145105.102718798549
5938634145.93137900422-282.931379004218
6041874539.03782644078-352.037826440778

\begin{tabular}{lllllllll}
\hline
Multiple Linear Regression - Actuals, Interpolation, and Residuals \tabularnewline
Time or Index & Actuals & InterpolationForecast & ResidualsPrediction Error \tabularnewline
1 & 3922 & 4499.61833986833 & -577.618339868325 \tabularnewline
2 & 3759 & 4701.89484353037 & -942.89484353037 \tabularnewline
3 & 4138 & 4862.1330953614 & -724.133095361397 \tabularnewline
4 & 4634 & 5207.89899755863 & -573.89899755863 \tabularnewline
5 & 3996 & 4571.59255012207 & -575.592550122068 \tabularnewline
6 & 4308 & 5044.9584523193 & -736.958452319301 \tabularnewline
7 & 4143 & 4813.24785085448 & -670.247850854479 \tabularnewline
8 & 4429 & 4816.66905378412 & -387.669053784123 \tabularnewline
9 & 5219 & 5323.26489975586 & -104.264899755863 \tabularnewline
10 & 4929 & 4951.74140341792 & -22.7414034179176 \tabularnewline
11 & 5755 & 5035.41375305171 & 719.586246948289 \tabularnewline
12 & 5592 & 5439.1584523193 & 152.841547680700 \tabularnewline
13 & 4163 & 4343.73682030036 & -180.736820300360 \tabularnewline
14 & 4962 & 4492.82206480728 & 469.177935192721 \tabularnewline
15 & 5208 & 4631.78381297625 & 576.216187023748 \tabularnewline
16 & 4755 & 4966.91146334246 & -211.911463342458 \tabularnewline
17 & 4491 & 4330.60501590590 & 160.394984094104 \tabularnewline
18 & 5732 & 4793.3326662721 & 938.6673337279 \tabularnewline
19 & 5731 & 4561.62206480728 & 1169.37793519272 \tabularnewline
20 & 5040 & 4533.12851224384 & 506.871487756159 \tabularnewline
21 & 6102 & 5071.63911370866 & 1030.36088629134 \tabularnewline
22 & 4904 & 4721.39212103277 & 182.607878967227 \tabularnewline
23 & 5369 & 4890.17048531479 & 478.829514685211 \tabularnewline
24 & 5578 & 5325.82994007546 & 252.170059924540 \tabularnewline
25 & 4619 & 4230.40830805652 & 388.591691943481 \tabularnewline
26 & 4731 & 4368.85530073241 & 362.144699267589 \tabularnewline
27 & 5011 & 4497.17879707036 & 513.821202929645 \tabularnewline
28 & 5299 & 4842.94469926759 & 456.055300732411 \tabularnewline
29 & 4146 & 4217.27650366205 & -71.2765036620552 \tabularnewline
30 & 4625 & 4701.28065769032 & -76.2806576903159 \tabularnewline
31 & 4736 & 4490.84655988755 & 245.153440112451 \tabularnewline
32 & 4219 & 4451.71475549308 & -232.714755493083 \tabularnewline
33 & 5116 & 4979.58710512688 & 136.412894873123 \tabularnewline
34 & 4205 & 4608.06360878893 & -403.063608788932 \tabularnewline
35 & 4121 & 4702.37421025375 & -581.374210253755 \tabularnewline
36 & 5103 & 5116.75716135237 & -13.7571613523704 \tabularnewline
37 & 4300 & 4053.25028482651 & 246.749715173488 \tabularnewline
38 & 4578 & 4223.61203299549 & 354.387967004513 \tabularnewline
39 & 3809 & 4373.21203299549 & -564.212032995487 \tabularnewline
40 & 5526 & 4697.70143153067 & 828.298568469335 \tabularnewline
41 & 4247 & 4050.75673226308 & 196.243267736924 \tabularnewline
42 & 3830 & 4524.12263446031 & -694.122634460309 \tabularnewline
43 & 4394 & 4334.96504031960 & 59.0349596804023 \tabularnewline
44 & 4826 & 4338.38624324924 & 487.613756750759 \tabularnewline
45 & 4409 & 4876.89684471406 & -467.896844714064 \tabularnewline
46 & 4569 & 4430.90558555893 & 138.094414441074 \tabularnewline
47 & 4106 & 4440.11017237553 & -334.110172375528 \tabularnewline
48 & 4794 & 4833.21661981209 & -39.2166198120883 \tabularnewline
49 & 3914 & 3790.98624694829 & 123.013753051715 \tabularnewline
50 & 3793 & 4035.81575793445 & -242.815757934454 \tabularnewline
51 & 4405 & 4206.69226159651 & 198.307738403492 \tabularnewline
52 & 4022 & 4520.54340830066 & -498.543408300659 \tabularnewline
53 & 4100 & 3809.76919804690 & 290.230801953095 \tabularnewline
54 & 4788 & 4219.30558925797 & 568.694410742028 \tabularnewline
55 & 3163 & 3966.31848413109 & -803.318484131095 \tabularnewline
56 & 3585 & 3959.10143522971 & -374.101435229711 \tabularnewline
57 & 3903 & 4497.61203669453 & -594.612036694534 \tabularnewline
58 & 4178 & 4072.89728120145 & 105.102718798549 \tabularnewline
59 & 3863 & 4145.93137900422 & -282.931379004218 \tabularnewline
60 & 4187 & 4539.03782644078 & -352.037826440778 \tabularnewline
\hline
\end{tabular}
%Source: https://freestatistics.org/blog/index.php?pk=58899&T=4

[TABLE]
[ROW][C]Multiple Linear Regression - Actuals, Interpolation, and Residuals[/C][/ROW]
[ROW][C]Time or Index[/C][C]Actuals[/C][C]InterpolationForecast[/C][C]ResidualsPrediction Error[/C][/ROW]
[ROW][C]1[/C][C]3922[/C][C]4499.61833986833[/C][C]-577.618339868325[/C][/ROW]
[ROW][C]2[/C][C]3759[/C][C]4701.89484353037[/C][C]-942.89484353037[/C][/ROW]
[ROW][C]3[/C][C]4138[/C][C]4862.1330953614[/C][C]-724.133095361397[/C][/ROW]
[ROW][C]4[/C][C]4634[/C][C]5207.89899755863[/C][C]-573.89899755863[/C][/ROW]
[ROW][C]5[/C][C]3996[/C][C]4571.59255012207[/C][C]-575.592550122068[/C][/ROW]
[ROW][C]6[/C][C]4308[/C][C]5044.9584523193[/C][C]-736.958452319301[/C][/ROW]
[ROW][C]7[/C][C]4143[/C][C]4813.24785085448[/C][C]-670.247850854479[/C][/ROW]
[ROW][C]8[/C][C]4429[/C][C]4816.66905378412[/C][C]-387.669053784123[/C][/ROW]
[ROW][C]9[/C][C]5219[/C][C]5323.26489975586[/C][C]-104.264899755863[/C][/ROW]
[ROW][C]10[/C][C]4929[/C][C]4951.74140341792[/C][C]-22.7414034179176[/C][/ROW]
[ROW][C]11[/C][C]5755[/C][C]5035.41375305171[/C][C]719.586246948289[/C][/ROW]
[ROW][C]12[/C][C]5592[/C][C]5439.1584523193[/C][C]152.841547680700[/C][/ROW]
[ROW][C]13[/C][C]4163[/C][C]4343.73682030036[/C][C]-180.736820300360[/C][/ROW]
[ROW][C]14[/C][C]4962[/C][C]4492.82206480728[/C][C]469.177935192721[/C][/ROW]
[ROW][C]15[/C][C]5208[/C][C]4631.78381297625[/C][C]576.216187023748[/C][/ROW]
[ROW][C]16[/C][C]4755[/C][C]4966.91146334246[/C][C]-211.911463342458[/C][/ROW]
[ROW][C]17[/C][C]4491[/C][C]4330.60501590590[/C][C]160.394984094104[/C][/ROW]
[ROW][C]18[/C][C]5732[/C][C]4793.3326662721[/C][C]938.6673337279[/C][/ROW]
[ROW][C]19[/C][C]5731[/C][C]4561.62206480728[/C][C]1169.37793519272[/C][/ROW]
[ROW][C]20[/C][C]5040[/C][C]4533.12851224384[/C][C]506.871487756159[/C][/ROW]
[ROW][C]21[/C][C]6102[/C][C]5071.63911370866[/C][C]1030.36088629134[/C][/ROW]
[ROW][C]22[/C][C]4904[/C][C]4721.39212103277[/C][C]182.607878967227[/C][/ROW]
[ROW][C]23[/C][C]5369[/C][C]4890.17048531479[/C][C]478.829514685211[/C][/ROW]
[ROW][C]24[/C][C]5578[/C][C]5325.82994007546[/C][C]252.170059924540[/C][/ROW]
[ROW][C]25[/C][C]4619[/C][C]4230.40830805652[/C][C]388.591691943481[/C][/ROW]
[ROW][C]26[/C][C]4731[/C][C]4368.85530073241[/C][C]362.144699267589[/C][/ROW]
[ROW][C]27[/C][C]5011[/C][C]4497.17879707036[/C][C]513.821202929645[/C][/ROW]
[ROW][C]28[/C][C]5299[/C][C]4842.94469926759[/C][C]456.055300732411[/C][/ROW]
[ROW][C]29[/C][C]4146[/C][C]4217.27650366205[/C][C]-71.2765036620552[/C][/ROW]
[ROW][C]30[/C][C]4625[/C][C]4701.28065769032[/C][C]-76.2806576903159[/C][/ROW]
[ROW][C]31[/C][C]4736[/C][C]4490.84655988755[/C][C]245.153440112451[/C][/ROW]
[ROW][C]32[/C][C]4219[/C][C]4451.71475549308[/C][C]-232.714755493083[/C][/ROW]
[ROW][C]33[/C][C]5116[/C][C]4979.58710512688[/C][C]136.412894873123[/C][/ROW]
[ROW][C]34[/C][C]4205[/C][C]4608.06360878893[/C][C]-403.063608788932[/C][/ROW]
[ROW][C]35[/C][C]4121[/C][C]4702.37421025375[/C][C]-581.374210253755[/C][/ROW]
[ROW][C]36[/C][C]5103[/C][C]5116.75716135237[/C][C]-13.7571613523704[/C][/ROW]
[ROW][C]37[/C][C]4300[/C][C]4053.25028482651[/C][C]246.749715173488[/C][/ROW]
[ROW][C]38[/C][C]4578[/C][C]4223.61203299549[/C][C]354.387967004513[/C][/ROW]
[ROW][C]39[/C][C]3809[/C][C]4373.21203299549[/C][C]-564.212032995487[/C][/ROW]
[ROW][C]40[/C][C]5526[/C][C]4697.70143153067[/C][C]828.298568469335[/C][/ROW]
[ROW][C]41[/C][C]4247[/C][C]4050.75673226308[/C][C]196.243267736924[/C][/ROW]
[ROW][C]42[/C][C]3830[/C][C]4524.12263446031[/C][C]-694.122634460309[/C][/ROW]
[ROW][C]43[/C][C]4394[/C][C]4334.96504031960[/C][C]59.0349596804023[/C][/ROW]
[ROW][C]44[/C][C]4826[/C][C]4338.38624324924[/C][C]487.613756750759[/C][/ROW]
[ROW][C]45[/C][C]4409[/C][C]4876.89684471406[/C][C]-467.896844714064[/C][/ROW]
[ROW][C]46[/C][C]4569[/C][C]4430.90558555893[/C][C]138.094414441074[/C][/ROW]
[ROW][C]47[/C][C]4106[/C][C]4440.11017237553[/C][C]-334.110172375528[/C][/ROW]
[ROW][C]48[/C][C]4794[/C][C]4833.21661981209[/C][C]-39.2166198120883[/C][/ROW]
[ROW][C]49[/C][C]3914[/C][C]3790.98624694829[/C][C]123.013753051715[/C][/ROW]
[ROW][C]50[/C][C]3793[/C][C]4035.81575793445[/C][C]-242.815757934454[/C][/ROW]
[ROW][C]51[/C][C]4405[/C][C]4206.69226159651[/C][C]198.307738403492[/C][/ROW]
[ROW][C]52[/C][C]4022[/C][C]4520.54340830066[/C][C]-498.543408300659[/C][/ROW]
[ROW][C]53[/C][C]4100[/C][C]3809.76919804690[/C][C]290.230801953095[/C][/ROW]
[ROW][C]54[/C][C]4788[/C][C]4219.30558925797[/C][C]568.694410742028[/C][/ROW]
[ROW][C]55[/C][C]3163[/C][C]3966.31848413109[/C][C]-803.318484131095[/C][/ROW]
[ROW][C]56[/C][C]3585[/C][C]3959.10143522971[/C][C]-374.101435229711[/C][/ROW]
[ROW][C]57[/C][C]3903[/C][C]4497.61203669453[/C][C]-594.612036694534[/C][/ROW]
[ROW][C]58[/C][C]4178[/C][C]4072.89728120145[/C][C]105.102718798549[/C][/ROW]
[ROW][C]59[/C][C]3863[/C][C]4145.93137900422[/C][C]-282.931379004218[/C][/ROW]
[ROW][C]60[/C][C]4187[/C][C]4539.03782644078[/C][C]-352.037826440778[/C][/ROW]
[/TABLE]
Source: https://freestatistics.org/blog/index.php?pk=58899&T=4

Globally Unique Identifier (entire table): ba.freestatistics.org/blog/index.php?pk=58899&T=4

As an alternative you can also use a QR Code:  

The GUIDs for individual cells are displayed in the table below:

Multiple Linear Regression - Actuals, Interpolation, and Residuals
Time or IndexActualsInterpolationForecastResidualsPrediction Error
139224499.61833986833-577.618339868325
237594701.89484353037-942.89484353037
341384862.1330953614-724.133095361397
446345207.89899755863-573.89899755863
539964571.59255012207-575.592550122068
643085044.9584523193-736.958452319301
741434813.24785085448-670.247850854479
844294816.66905378412-387.669053784123
952195323.26489975586-104.264899755863
1049294951.74140341792-22.7414034179176
1157555035.41375305171719.586246948289
1255925439.1584523193152.841547680700
1341634343.73682030036-180.736820300360
1449624492.82206480728469.177935192721
1552084631.78381297625576.216187023748
1647554966.91146334246-211.911463342458
1744914330.60501590590160.394984094104
1857324793.3326662721938.6673337279
1957314561.622064807281169.37793519272
2050404533.12851224384506.871487756159
2161025071.639113708661030.36088629134
2249044721.39212103277182.607878967227
2353694890.17048531479478.829514685211
2455785325.82994007546252.170059924540
2546194230.40830805652388.591691943481
2647314368.85530073241362.144699267589
2750114497.17879707036513.821202929645
2852994842.94469926759456.055300732411
2941464217.27650366205-71.2765036620552
3046254701.28065769032-76.2806576903159
3147364490.84655988755245.153440112451
3242194451.71475549308-232.714755493083
3351164979.58710512688136.412894873123
3442054608.06360878893-403.063608788932
3541214702.37421025375-581.374210253755
3651035116.75716135237-13.7571613523704
3743004053.25028482651246.749715173488
3845784223.61203299549354.387967004513
3938094373.21203299549-564.212032995487
4055264697.70143153067828.298568469335
4142474050.75673226308196.243267736924
4238304524.12263446031-694.122634460309
4343944334.9650403196059.0349596804023
4448264338.38624324924487.613756750759
4544094876.89684471406-467.896844714064
4645694430.90558555893138.094414441074
4741064440.11017237553-334.110172375528
4847944833.21661981209-39.2166198120883
4939143790.98624694829123.013753051715
5037934035.81575793445-242.815757934454
5144054206.69226159651198.307738403492
5240224520.54340830066-498.543408300659
5341003809.76919804690290.230801953095
5447884219.30558925797568.694410742028
5531633966.31848413109-803.318484131095
5635853959.10143522971-374.101435229711
5739034497.61203669453-594.612036694534
5841784072.89728120145105.102718798549
5938634145.93137900422-282.931379004218
6041874539.03782644078-352.037826440778


Goldfeld-Quandt test for Heteroskedasticity
p-valuesAlternative Hypothesis
breakpoint indexgreater2-sidedless
170.5093303835065950.981339232986810.490669616493405
180.4924215993582760.9848431987165510.507578400641724
190.498576290012670.997152580025340.50142370998733
200.4596843584410680.9193687168821370.540315641558932
210.4047905207283040.8095810414566080.595209479271696
220.4660344888561630.9320689777123260.533965511143837
230.4660968460860620.9321936921721240.533903153913938
240.3655368238754650.731073647750930.634463176124535
250.3186441036299150.637288207259830.681355896370085
260.2309325822300310.4618651644600620.769067417769969
270.1915420351133320.3830840702266630.808457964886668
280.1344564921122660.2689129842245310.865543507887734
290.1284419189456680.2568838378913360.871558081054332
300.1282430087690580.2564860175381170.871756991230942
310.1026660906669170.2053321813338340.897333909333083
320.1106965678025160.2213931356050320.889303432197484
330.1280363085226170.2560726170452340.871963691477383
340.1629040017391440.3258080034782890.837095998260856
350.4104987777570350.8209975555140710.589501222242965
360.3499716799166730.6999433598333460.650028320083327
370.2577101738669780.5154203477339550.742289826133022
380.2064820926523340.4129641853046690.793517907347666
390.247766634589950.49553326917990.75223336541005
400.5374547754662130.9250904490675730.462545224533787
410.4666477947820010.9332955895640010.533352205217999
420.8569663422014110.2860673155971780.143033657798589
430.8176256969883860.3647486060232290.182374303011614

\begin{tabular}{lllllllll}
\hline
Goldfeld-Quandt test for Heteroskedasticity \tabularnewline
p-values & Alternative Hypothesis \tabularnewline
breakpoint index & greater & 2-sided & less \tabularnewline
17 & 0.509330383506595 & 0.98133923298681 & 0.490669616493405 \tabularnewline
18 & 0.492421599358276 & 0.984843198716551 & 0.507578400641724 \tabularnewline
19 & 0.49857629001267 & 0.99715258002534 & 0.50142370998733 \tabularnewline
20 & 0.459684358441068 & 0.919368716882137 & 0.540315641558932 \tabularnewline
21 & 0.404790520728304 & 0.809581041456608 & 0.595209479271696 \tabularnewline
22 & 0.466034488856163 & 0.932068977712326 & 0.533965511143837 \tabularnewline
23 & 0.466096846086062 & 0.932193692172124 & 0.533903153913938 \tabularnewline
24 & 0.365536823875465 & 0.73107364775093 & 0.634463176124535 \tabularnewline
25 & 0.318644103629915 & 0.63728820725983 & 0.681355896370085 \tabularnewline
26 & 0.230932582230031 & 0.461865164460062 & 0.769067417769969 \tabularnewline
27 & 0.191542035113332 & 0.383084070226663 & 0.808457964886668 \tabularnewline
28 & 0.134456492112266 & 0.268912984224531 & 0.865543507887734 \tabularnewline
29 & 0.128441918945668 & 0.256883837891336 & 0.871558081054332 \tabularnewline
30 & 0.128243008769058 & 0.256486017538117 & 0.871756991230942 \tabularnewline
31 & 0.102666090666917 & 0.205332181333834 & 0.897333909333083 \tabularnewline
32 & 0.110696567802516 & 0.221393135605032 & 0.889303432197484 \tabularnewline
33 & 0.128036308522617 & 0.256072617045234 & 0.871963691477383 \tabularnewline
34 & 0.162904001739144 & 0.325808003478289 & 0.837095998260856 \tabularnewline
35 & 0.410498777757035 & 0.820997555514071 & 0.589501222242965 \tabularnewline
36 & 0.349971679916673 & 0.699943359833346 & 0.650028320083327 \tabularnewline
37 & 0.257710173866978 & 0.515420347733955 & 0.742289826133022 \tabularnewline
38 & 0.206482092652334 & 0.412964185304669 & 0.793517907347666 \tabularnewline
39 & 0.24776663458995 & 0.4955332691799 & 0.75223336541005 \tabularnewline
40 & 0.537454775466213 & 0.925090449067573 & 0.462545224533787 \tabularnewline
41 & 0.466647794782001 & 0.933295589564001 & 0.533352205217999 \tabularnewline
42 & 0.856966342201411 & 0.286067315597178 & 0.143033657798589 \tabularnewline
43 & 0.817625696988386 & 0.364748606023229 & 0.182374303011614 \tabularnewline
\hline
\end{tabular}
%Source: https://freestatistics.org/blog/index.php?pk=58899&T=5

[TABLE]
[ROW][C]Goldfeld-Quandt test for Heteroskedasticity[/C][/ROW]
[ROW][C]p-values[/C][C]Alternative Hypothesis[/C][/ROW]
[ROW][C]breakpoint index[/C][C]greater[/C][C]2-sided[/C][C]less[/C][/ROW]
[ROW][C]17[/C][C]0.509330383506595[/C][C]0.98133923298681[/C][C]0.490669616493405[/C][/ROW]
[ROW][C]18[/C][C]0.492421599358276[/C][C]0.984843198716551[/C][C]0.507578400641724[/C][/ROW]
[ROW][C]19[/C][C]0.49857629001267[/C][C]0.99715258002534[/C][C]0.50142370998733[/C][/ROW]
[ROW][C]20[/C][C]0.459684358441068[/C][C]0.919368716882137[/C][C]0.540315641558932[/C][/ROW]
[ROW][C]21[/C][C]0.404790520728304[/C][C]0.809581041456608[/C][C]0.595209479271696[/C][/ROW]
[ROW][C]22[/C][C]0.466034488856163[/C][C]0.932068977712326[/C][C]0.533965511143837[/C][/ROW]
[ROW][C]23[/C][C]0.466096846086062[/C][C]0.932193692172124[/C][C]0.533903153913938[/C][/ROW]
[ROW][C]24[/C][C]0.365536823875465[/C][C]0.73107364775093[/C][C]0.634463176124535[/C][/ROW]
[ROW][C]25[/C][C]0.318644103629915[/C][C]0.63728820725983[/C][C]0.681355896370085[/C][/ROW]
[ROW][C]26[/C][C]0.230932582230031[/C][C]0.461865164460062[/C][C]0.769067417769969[/C][/ROW]
[ROW][C]27[/C][C]0.191542035113332[/C][C]0.383084070226663[/C][C]0.808457964886668[/C][/ROW]
[ROW][C]28[/C][C]0.134456492112266[/C][C]0.268912984224531[/C][C]0.865543507887734[/C][/ROW]
[ROW][C]29[/C][C]0.128441918945668[/C][C]0.256883837891336[/C][C]0.871558081054332[/C][/ROW]
[ROW][C]30[/C][C]0.128243008769058[/C][C]0.256486017538117[/C][C]0.871756991230942[/C][/ROW]
[ROW][C]31[/C][C]0.102666090666917[/C][C]0.205332181333834[/C][C]0.897333909333083[/C][/ROW]
[ROW][C]32[/C][C]0.110696567802516[/C][C]0.221393135605032[/C][C]0.889303432197484[/C][/ROW]
[ROW][C]33[/C][C]0.128036308522617[/C][C]0.256072617045234[/C][C]0.871963691477383[/C][/ROW]
[ROW][C]34[/C][C]0.162904001739144[/C][C]0.325808003478289[/C][C]0.837095998260856[/C][/ROW]
[ROW][C]35[/C][C]0.410498777757035[/C][C]0.820997555514071[/C][C]0.589501222242965[/C][/ROW]
[ROW][C]36[/C][C]0.349971679916673[/C][C]0.699943359833346[/C][C]0.650028320083327[/C][/ROW]
[ROW][C]37[/C][C]0.257710173866978[/C][C]0.515420347733955[/C][C]0.742289826133022[/C][/ROW]
[ROW][C]38[/C][C]0.206482092652334[/C][C]0.412964185304669[/C][C]0.793517907347666[/C][/ROW]
[ROW][C]39[/C][C]0.24776663458995[/C][C]0.4955332691799[/C][C]0.75223336541005[/C][/ROW]
[ROW][C]40[/C][C]0.537454775466213[/C][C]0.925090449067573[/C][C]0.462545224533787[/C][/ROW]
[ROW][C]41[/C][C]0.466647794782001[/C][C]0.933295589564001[/C][C]0.533352205217999[/C][/ROW]
[ROW][C]42[/C][C]0.856966342201411[/C][C]0.286067315597178[/C][C]0.143033657798589[/C][/ROW]
[ROW][C]43[/C][C]0.817625696988386[/C][C]0.364748606023229[/C][C]0.182374303011614[/C][/ROW]
[/TABLE]
Source: https://freestatistics.org/blog/index.php?pk=58899&T=5

Globally Unique Identifier (entire table): ba.freestatistics.org/blog/index.php?pk=58899&T=5

As an alternative you can also use a QR Code:  

The GUIDs for individual cells are displayed in the table below:

Goldfeld-Quandt test for Heteroskedasticity
p-valuesAlternative Hypothesis
breakpoint indexgreater2-sidedless
170.5093303835065950.981339232986810.490669616493405
180.4924215993582760.9848431987165510.507578400641724
190.498576290012670.997152580025340.50142370998733
200.4596843584410680.9193687168821370.540315641558932
210.4047905207283040.8095810414566080.595209479271696
220.4660344888561630.9320689777123260.533965511143837
230.4660968460860620.9321936921721240.533903153913938
240.3655368238754650.731073647750930.634463176124535
250.3186441036299150.637288207259830.681355896370085
260.2309325822300310.4618651644600620.769067417769969
270.1915420351133320.3830840702266630.808457964886668
280.1344564921122660.2689129842245310.865543507887734
290.1284419189456680.2568838378913360.871558081054332
300.1282430087690580.2564860175381170.871756991230942
310.1026660906669170.2053321813338340.897333909333083
320.1106965678025160.2213931356050320.889303432197484
330.1280363085226170.2560726170452340.871963691477383
340.1629040017391440.3258080034782890.837095998260856
350.4104987777570350.8209975555140710.589501222242965
360.3499716799166730.6999433598333460.650028320083327
370.2577101738669780.5154203477339550.742289826133022
380.2064820926523340.4129641853046690.793517907347666
390.247766634589950.49553326917990.75223336541005
400.5374547754662130.9250904490675730.462545224533787
410.4666477947820010.9332955895640010.533352205217999
420.8569663422014110.2860673155971780.143033657798589
430.8176256969883860.3647486060232290.182374303011614


Meta Analysis of Goldfeld-Quandt test for Heteroskedasticity
Description# significant tests% significant testsOK/NOK
1% type I error level00OK
5% type I error level00OK
10% type I error level00OK

\begin{tabular}{lllllllll}
\hline
Meta Analysis of Goldfeld-Quandt test for Heteroskedasticity \tabularnewline
Description & # significant tests & % significant tests & OK/NOK \tabularnewline
1% type I error level & 0 & 0 & OK \tabularnewline
5% type I error level & 0 & 0 & OK \tabularnewline
10% type I error level & 0 & 0 & OK \tabularnewline
\hline
\end{tabular}
%Source: https://freestatistics.org/blog/index.php?pk=58899&T=6

[TABLE]
[ROW][C]Meta Analysis of Goldfeld-Quandt test for Heteroskedasticity[/C][/ROW]
[ROW][C]Description[/C][C]# significant tests[/C][C]% significant tests[/C][C]OK/NOK[/C][/ROW]
[ROW][C]1% type I error level[/C][C]0[/C][C]0[/C][C]OK[/C][/ROW]
[ROW][C]5% type I error level[/C][C]0[/C][C]0[/C][C]OK[/C][/ROW]
[ROW][C]10% type I error level[/C][C]0[/C][C]0[/C][C]OK[/C][/ROW]
[/TABLE]
Source: https://freestatistics.org/blog/index.php?pk=58899&T=6

Globally Unique Identifier (entire table): ba.freestatistics.org/blog/index.php?pk=58899&T=6

As an alternative you can also use a QR Code:  

The GUIDs for individual cells are displayed in the table below:

Meta Analysis of Goldfeld-Quandt test for Heteroskedasticity
Description# significant tests% significant testsOK/NOK
1% type I error level00OK
5% type I error level00OK
10% type I error level00OK


Parameters (Session):
par1 = 1 ; par2 = Include Monthly Dummies ; par3 = Linear Trend ;
Parameters (R input):
par1 = 1 ; par2 = Include Monthly Dummies ; par3 = Linear Trend ;
R code (references can be found in the software module):
library(lattice)
library(lmtest)
n25 <- 25 #minimum number of obs. for Goldfeld-Quandt test
par1 <- as.numeric(par1)
x <- t(y)
k <- length(x[1,])
n <- length(x[,1])
x1 <- cbind(x[,par1], x[,1:k!=par1])
mycolnames <- c(colnames(x)[par1], colnames(x)[1:k!=par1])
colnames(x1) <- mycolnames #colnames(x)[par1]
x <- x1
if (par3 == 'First Differences'){
x2 <- array(0, dim=c(n-1,k), dimnames=list(1:(n-1), paste('(1-B)',colnames(x),sep='')))
for (i in 1:n-1) {
for (j in 1:k) {
x2[i,j] <- x[i+1,j] - x[i,j]
}
}
x <- x2
}
if (par2 == 'Include Monthly Dummies'){
x2 <- array(0, dim=c(n,11), dimnames=list(1:n, paste('M', seq(1:11), sep ='')))
for (i in 1:11){
x2[seq(i,n,12),i] <- 1
}
x <- cbind(x, x2)
}
if (par2 == 'Include Quarterly Dummies'){
x2 <- array(0, dim=c(n,3), dimnames=list(1:n, paste('Q', seq(1:3), sep ='')))
for (i in 1:3){
x2[seq(i,n,4),i] <- 1
}
x <- cbind(x, x2)
}
k <- length(x[1,])
if (par3 == 'Linear Trend'){
x <- cbind(x, c(1:n))
colnames(x)[k+1] <- 't'
}
x
k <- length(x[1,])
df <- as.data.frame(x)
(mylm <- lm(df))
(mysum <- summary(mylm))
if (n > n25) {
kp3 <- k + 3
nmkm3 <- n - k - 3
gqarr <- array(NA, dim=c(nmkm3-kp3+1,3))
numgqtests <- 0
numsignificant1 <- 0
numsignificant5 <- 0
numsignificant10 <- 0
for (mypoint in kp3:nmkm3) {
j <- 0
numgqtests <- numgqtests + 1
for (myalt in c('greater', 'two.sided', 'less')) {
j <- j + 1
gqarr[mypoint-kp3+1,j] <- gqtest(mylm, point=mypoint, alternative=myalt)$p.value
}
if (gqarr[mypoint-kp3+1,2] < 0.01) numsignificant1 <- numsignificant1 + 1
if (gqarr[mypoint-kp3+1,2] < 0.05) numsignificant5 <- numsignificant5 + 1
if (gqarr[mypoint-kp3+1,2] < 0.10) numsignificant10 <- numsignificant10 + 1
}
gqarr
}
bitmap(file='test0.png')
plot(x[,1], type='l', main='Actuals and Interpolation', ylab='value of Actuals and Interpolation (dots)', xlab='time or index')
points(x[,1]-mysum$resid)
grid()
dev.off()
bitmap(file='test1.png')
plot(mysum$resid, type='b', pch=19, main='Residuals', ylab='value of Residuals', xlab='time or index')
grid()
dev.off()
bitmap(file='test2.png')
hist(mysum$resid, main='Residual Histogram', xlab='values of Residuals')
grid()
dev.off()
bitmap(file='test3.png')
densityplot(~mysum$resid,col='black',main='Residual Density Plot', xlab='values of Residuals')
dev.off()
bitmap(file='test4.png')
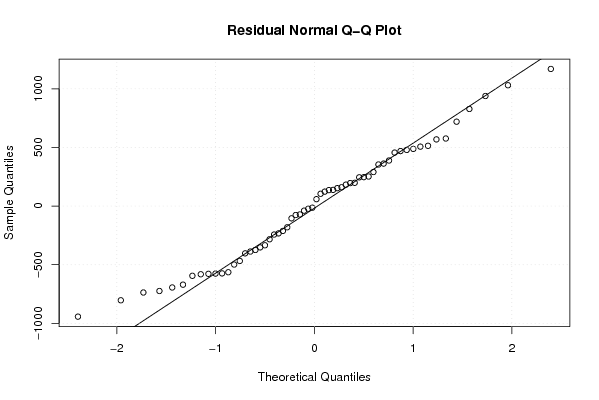
qqnorm(mysum$resid, main='Residual Normal Q-Q Plot')
qqline(mysum$resid)
grid()
dev.off()
(myerror <- as.ts(mysum$resid))
bitmap(file='test5.png')
dum <- cbind(lag(myerror,k=1),myerror)
dum
dum1 <- dum[2:length(myerror),]
dum1
z <- as.data.frame(dum1)
z
plot(z,main=paste('Residual Lag plot, lowess, and regression line'), ylab='values of Residuals', xlab='lagged values of Residuals')
lines(lowess(z))
abline(lm(z))
grid()
dev.off()
bitmap(file='test6.png')
acf(mysum$resid, lag.max=length(mysum$resid)/2, main='Residual Autocorrelation Function')
grid()
dev.off()
bitmap(file='test7.png')
pacf(mysum$resid, lag.max=length(mysum$resid)/2, main='Residual Partial Autocorrelation Function')
grid()
dev.off()
bitmap(file='test8.png')
opar <- par(mfrow = c(2,2), oma = c(0, 0, 1.1, 0))
plot(mylm, las = 1, sub='Residual Diagnostics')
par(opar)
dev.off()
if (n > n25) {
bitmap(file='test9.png')
plot(kp3:nmkm3,gqarr[,2], main='Goldfeld-Quandt test',ylab='2-sided p-value',xlab='breakpoint')
grid()
dev.off()
}
load(file='createtable')
a<-table.start()
a<-table.row.start(a)
a<-table.element(a, 'Multiple Linear Regression - Estimated Regression Equation', 1, TRUE)
a<-table.row.end(a)
myeq <- colnames(x)[1]
myeq <- paste(myeq, '[t] = ', sep='')
for (i in 1:k){
if (mysum$coefficients[i,1] > 0) myeq <- paste(myeq, '+', '')
myeq <- paste(myeq, mysum$coefficients[i,1], sep=' ')
if (rownames(mysum$coefficients)[i] != '(Intercept)') {
myeq <- paste(myeq, rownames(mysum$coefficients)[i], sep='')
if (rownames(mysum$coefficients)[i] != 't') myeq <- paste(myeq, '[t]', sep='')
}
}
myeq <- paste(myeq, ' + e[t]')
a<-table.row.start(a)
a<-table.element(a, myeq)
a<-table.row.end(a)
a<-table.end(a)
table.save(a,file='mytable1.tab')
a<-table.start()
a<-table.row.start(a)
a<-table.element(a,hyperlink('ols1.htm','Multiple Linear Regression - Ordinary Least Squares',''), 6, TRUE)
a<-table.row.end(a)
a<-table.row.start(a)
a<-table.element(a,'Variable',header=TRUE)
a<-table.element(a,'Parameter',header=TRUE)
a<-table.element(a,'S.D.',header=TRUE)
a<-table.element(a,'T-STAT
H0: parameter = 0',header=TRUE)
a<-table.element(a,'2-tail p-value',header=TRUE)
a<-table.element(a,'1-tail p-value',header=TRUE)
a<-table.row.end(a)
for (i in 1:k){
a<-table.row.start(a)
a<-table.element(a,rownames(mysum$coefficients)[i],header=TRUE)
a<-table.element(a,mysum$coefficients[i,1])
a<-table.element(a, round(mysum$coefficients[i,2],6))
a<-table.element(a, round(mysum$coefficients[i,3],4))
a<-table.element(a, round(mysum$coefficients[i,4],6))
a<-table.element(a, round(mysum$coefficients[i,4]/2,6))
a<-table.row.end(a)
}
a<-table.end(a)
table.save(a,file='mytable2.tab')
a<-table.start()
a<-table.row.start(a)
a<-table.element(a, 'Multiple Linear Regression - Regression Statistics', 2, TRUE)
a<-table.row.end(a)
a<-table.row.start(a)
a<-table.element(a, 'Multiple R',1,TRUE)
a<-table.element(a, sqrt(mysum$r.squared))
a<-table.row.end(a)
a<-table.row.start(a)
a<-table.element(a, 'R-squared',1,TRUE)
a<-table.element(a, mysum$r.squared)
a<-table.row.end(a)
a<-table.row.start(a)
a<-table.element(a, 'Adjusted R-squared',1,TRUE)
a<-table.element(a, mysum$adj.r.squared)
a<-table.row.end(a)
a<-table.row.start(a)
a<-table.element(a, 'F-TEST (value)',1,TRUE)
a<-table.element(a, mysum$fstatistic[1])
a<-table.row.end(a)
a<-table.row.start(a)
a<-table.element(a, 'F-TEST (DF numerator)',1,TRUE)
a<-table.element(a, mysum$fstatistic[2])
a<-table.row.end(a)
a<-table.row.start(a)
a<-table.element(a, 'F-TEST (DF denominator)',1,TRUE)
a<-table.element(a, mysum$fstatistic[3])
a<-table.row.end(a)
a<-table.row.start(a)
a<-table.element(a, 'p-value',1,TRUE)
a<-table.element(a, 1-pf(mysum$fstatistic[1],mysum$fstatistic[2],mysum$fstatistic[3]))
a<-table.row.end(a)
a<-table.row.start(a)
a<-table.element(a, 'Multiple Linear Regression - Residual Statistics', 2, TRUE)
a<-table.row.end(a)
a<-table.row.start(a)
a<-table.element(a, 'Residual Standard Deviation',1,TRUE)
a<-table.element(a, mysum$sigma)
a<-table.row.end(a)
a<-table.row.start(a)
a<-table.element(a, 'Sum Squared Residuals',1,TRUE)
a<-table.element(a, sum(myerror*myerror))
a<-table.row.end(a)
a<-table.end(a)
table.save(a,file='mytable3.tab')
a<-table.start()
a<-table.row.start(a)
a<-table.element(a, 'Multiple Linear Regression - Actuals, Interpolation, and Residuals', 4, TRUE)
a<-table.row.end(a)
a<-table.row.start(a)
a<-table.element(a, 'Time or Index', 1, TRUE)
a<-table.element(a, 'Actuals', 1, TRUE)
a<-table.element(a, 'Interpolation
Forecast', 1, TRUE)
a<-table.element(a, 'Residuals
Prediction Error', 1, TRUE)
a<-table.row.end(a)
for (i in 1:n) {
a<-table.row.start(a)
a<-table.element(a,i, 1, TRUE)
a<-table.element(a,x[i])
a<-table.element(a,x[i]-mysum$resid[i])
a<-table.element(a,mysum$resid[i])
a<-table.row.end(a)
}
a<-table.end(a)
table.save(a,file='mytable4.tab')
if (n > n25) {
a<-table.start()
a<-table.row.start(a)
a<-table.element(a,'Goldfeld-Quandt test for Heteroskedasticity',4,TRUE)
a<-table.row.end(a)
a<-table.row.start(a)
a<-table.element(a,'p-values',header=TRUE)
a<-table.element(a,'Alternative Hypothesis',3,header=TRUE)
a<-table.row.end(a)
a<-table.row.start(a)
a<-table.element(a,'breakpoint index',header=TRUE)
a<-table.element(a,'greater',header=TRUE)
a<-table.element(a,'2-sided',header=TRUE)
a<-table.element(a,'less',header=TRUE)
a<-table.row.end(a)
for (mypoint in kp3:nmkm3) {
a<-table.row.start(a)
a<-table.element(a,mypoint,header=TRUE)
a<-table.element(a,gqarr[mypoint-kp3+1,1])
a<-table.element(a,gqarr[mypoint-kp3+1,2])
a<-table.element(a,gqarr[mypoint-kp3+1,3])
a<-table.row.end(a)
}
a<-table.end(a)
table.save(a,file='mytable5.tab')
a<-table.start()
a<-table.row.start(a)
a<-table.element(a,'Meta Analysis of Goldfeld-Quandt test for Heteroskedasticity',4,TRUE)
a<-table.row.end(a)
a<-table.row.start(a)
a<-table.element(a,'Description',header=TRUE)
a<-table.element(a,'# significant tests',header=TRUE)
a<-table.element(a,'% significant tests',header=TRUE)
a<-table.element(a,'OK/NOK',header=TRUE)
a<-table.row.end(a)
a<-table.row.start(a)
a<-table.element(a,'1% type I error level',header=TRUE)
a<-table.element(a,numsignificant1)
a<-table.element(a,numsignificant1/numgqtests)
if (numsignificant1/numgqtests < 0.01) dum <- 'OK' else dum <- 'NOK'
a<-table.element(a,dum)
a<-table.row.end(a)
a<-table.row.start(a)
a<-table.element(a,'5% type I error level',header=TRUE)
a<-table.element(a,numsignificant5)
a<-table.element(a,numsignificant5/numgqtests)
if (numsignificant5/numgqtests < 0.05) dum <- 'OK' else dum <- 'NOK'
a<-table.element(a,dum)
a<-table.row.end(a)
a<-table.row.start(a)
a<-table.element(a,'10% type I error level',header=TRUE)
a<-table.element(a,numsignificant10)
a<-table.element(a,numsignificant10/numgqtests)
if (numsignificant10/numgqtests < 0.1) dum <- 'OK' else dum <- 'NOK'
a<-table.element(a,dum)
a<-table.row.end(a)
a<-table.end(a)
table.save(a,file='mytable6.tab')
}