Free Statistics

of Irreproducible Research!

Author's title

Author*The author of this computation has been verified*
R Software Modulerwasp_multipleregression.wasp
Title produced by softwareMultiple Regression
Date of computationMon, 23 Nov 2009 12:54:10 -0700
Cite this page as followsStatistical Computations at FreeStatistics.org, Office for Research Development and Education, URL https://freestatistics.org/blog/index.php?v=date/2009/Nov/23/t1259007072iovw3pi8a7h6ngs.htm/, Retrieved Fri, 03 May 2024 06:29:45 +0000
Statistical Computations at FreeStatistics.org, Office for Research Development and Education, URL https://freestatistics.org/blog/index.php?pk=58895, Retrieved Fri, 03 May 2024 06:29:45 +0000
QR Codes:

Original text written by user:
IsPrivate?No (this computation is public)
User-defined keywords
Estimated Impact203
Family? (F = Feedback message, R = changed R code, M = changed R Module, P = changed Parameters, D = changed Data)
-       [Multiple Regression] [] [2009-11-23 19:54:10] [208e60166df5802f3c494097313a670f] [Current]
Feedback Forum

Post a new message
Dataseries X:
93.3	121.8
97.3	127.6
127	129.9
111.7	128
96.4	123.5
133	124
72.2	127.4
95.8	127.6
124.1	128.4
127.6	131.4
110.7	135.1
104.6	134
112.7	144.5
115.3	147.3
139.4	150.9
119	148.7
97.4	141.4
154	138.9
81.5	139.8
88.8	145.6
127.7	147.9
105.1	148.5
114.9	151.1
106.4	157.5
104.5	167.5
121.6	172.3
141.4	173.5
99	187.5
126.7	205.5
134.1	195.1
81.3	204.5
88.6	204.5
132.7	201.7
132.9	207
134.4	206.6
103.7	210.6
119.7	211.1
115	215
132.9	223.9
108.5	238.2
113.9	238.9
142	229.6
97.7	232.2
92.2	222.1
128.8	221.6
134.9	227.3
128.2	221
114.8	213.6
117.9	243.4
119.1	253.8
120.7	265.3
129.1	268.2
117.6	268.5
129.2	266.9
100	268.4
87	250.8
128	231.2
127.7	192
93.4	171.4
84.1	160
71.7	148.1


Summary of computational transaction
Raw Inputview raw input (R code)
Raw Outputview raw output of R engine
Computing time3 seconds
R Server'Gwilym Jenkins' @ 72.249.127.135

\begin{tabular}{lllllllll}
\hline
Summary of computational transaction \tabularnewline
Raw Input & view raw input (R code)  \tabularnewline
Raw Output & view raw output of R engine  \tabularnewline
Computing time & 3 seconds \tabularnewline
R Server & 'Gwilym Jenkins' @ 72.249.127.135 \tabularnewline
\hline
\end{tabular}
%Source: https://freestatistics.org/blog/index.php?pk=58895&T=0

[TABLE]
[ROW][C]Summary of computational transaction[/C][/ROW]
[ROW][C]Raw Input[/C][C]view raw input (R code) [/C][/ROW]
[ROW][C]Raw Output[/C][C]view raw output of R engine [/C][/ROW]
[ROW][C]Computing time[/C][C]3 seconds[/C][/ROW]
[ROW][C]R Server[/C][C]'Gwilym Jenkins' @ 72.249.127.135[/C][/ROW]
[/TABLE]
Source: https://freestatistics.org/blog/index.php?pk=58895&T=0

Globally Unique Identifier (entire table): ba.freestatistics.org/blog/index.php?pk=58895&T=0

As an alternative you can also use a QR Code:  

The GUIDs for individual cells are displayed in the table below:

Summary of computational transaction
Raw Inputview raw input (R code)
Raw Outputview raw output of R engine
Computing time3 seconds
R Server'Gwilym Jenkins' @ 72.249.127.135


Multiple Linear Regression - Estimated Regression Equation
IPtran[t] = + 76.2878881544539 + 0.259021168205223IGPic[t] -1.42618565989672M1[t] + 3.59316284151128M2[t] + 21.314459070658M3[t] + 1.61647699326119M4[t] -1.29060083467887M5[t] + 28.5023504634329M6[t] -23.8138522411022M7[t] -18.2237877168161M8[t] + 21.1078487635521M9[t] + 20.2881455653972M10[t] + 12.5819471261346M11[t] -0.525912654275461t + e[t]

\begin{tabular}{lllllllll}
\hline
Multiple Linear Regression - Estimated Regression Equation \tabularnewline
IPtran[t] =  +  76.2878881544539 +  0.259021168205223IGPic[t] -1.42618565989672M1[t] +  3.59316284151128M2[t] +  21.314459070658M3[t] +  1.61647699326119M4[t] -1.29060083467887M5[t] +  28.5023504634329M6[t] -23.8138522411022M7[t] -18.2237877168161M8[t] +  21.1078487635521M9[t] +  20.2881455653972M10[t] +  12.5819471261346M11[t] -0.525912654275461t  + e[t] \tabularnewline
\hline
\end{tabular}
%Source: https://freestatistics.org/blog/index.php?pk=58895&T=1

[TABLE]
[ROW][C]Multiple Linear Regression - Estimated Regression Equation[/C][/ROW]
[ROW][C]IPtran[t] =  +  76.2878881544539 +  0.259021168205223IGPic[t] -1.42618565989672M1[t] +  3.59316284151128M2[t] +  21.314459070658M3[t] +  1.61647699326119M4[t] -1.29060083467887M5[t] +  28.5023504634329M6[t] -23.8138522411022M7[t] -18.2237877168161M8[t] +  21.1078487635521M9[t] +  20.2881455653972M10[t] +  12.5819471261346M11[t] -0.525912654275461t  + e[t][/C][/ROW]
[/TABLE]
Source: https://freestatistics.org/blog/index.php?pk=58895&T=1

Globally Unique Identifier (entire table): ba.freestatistics.org/blog/index.php?pk=58895&T=1

As an alternative you can also use a QR Code:  

The GUIDs for individual cells are displayed in the table below:

Multiple Linear Regression - Estimated Regression Equation
IPtran[t] = + 76.2878881544539 + 0.259021168205223IGPic[t] -1.42618565989672M1[t] + 3.59316284151128M2[t] + 21.314459070658M3[t] + 1.61647699326119M4[t] -1.29060083467887M5[t] + 28.5023504634329M6[t] -23.8138522411022M7[t] -18.2237877168161M8[t] + 21.1078487635521M9[t] + 20.2881455653972M10[t] + 12.5819471261346M11[t] -0.525912654275461t + e[t]


Multiple Linear Regression - Ordinary Least Squares
VariableParameterS.D.T-STATH0: parameter = 02-tail p-value1-tail p-value
(Intercept)76.28788815445397.05215710.817700
IGPic0.2590211682052230.0528424.90181.2e-056e-06
M1-1.426185659896725.87495-0.24280.809250.404625
M23.593162841511286.3567850.56520.5745930.287297
M321.3144590706586.3950243.3330.0016820.000841
M41.616476993261196.4370860.25110.8028160.401408
M5-1.290600834678876.418071-0.20110.8414970.420749
M628.50235046343296.3133194.51464.2e-052.1e-05
M7-23.81385224110226.326095-3.76440.0004630.000232
M8-18.22378771681616.242291-2.91940.0053690.002684
M921.10784876355216.1809283.4150.0013240.000662
M1020.28814556539726.1325653.30830.0018060.000903
M1112.58194712613466.1095282.05940.045020.02251
t-0.5259126542754610.13915-3.77950.0004420.000221

\begin{tabular}{lllllllll}
\hline
Multiple Linear Regression - Ordinary Least Squares \tabularnewline
Variable & Parameter & S.D. & T-STATH0: parameter = 0 & 2-tail p-value & 1-tail p-value \tabularnewline
(Intercept) & 76.2878881544539 & 7.052157 & 10.8177 & 0 & 0 \tabularnewline
IGPic & 0.259021168205223 & 0.052842 & 4.9018 & 1.2e-05 & 6e-06 \tabularnewline
M1 & -1.42618565989672 & 5.87495 & -0.2428 & 0.80925 & 0.404625 \tabularnewline
M2 & 3.59316284151128 & 6.356785 & 0.5652 & 0.574593 & 0.287297 \tabularnewline
M3 & 21.314459070658 & 6.395024 & 3.333 & 0.001682 & 0.000841 \tabularnewline
M4 & 1.61647699326119 & 6.437086 & 0.2511 & 0.802816 & 0.401408 \tabularnewline
M5 & -1.29060083467887 & 6.418071 & -0.2011 & 0.841497 & 0.420749 \tabularnewline
M6 & 28.5023504634329 & 6.313319 & 4.5146 & 4.2e-05 & 2.1e-05 \tabularnewline
M7 & -23.8138522411022 & 6.326095 & -3.7644 & 0.000463 & 0.000232 \tabularnewline
M8 & -18.2237877168161 & 6.242291 & -2.9194 & 0.005369 & 0.002684 \tabularnewline
M9 & 21.1078487635521 & 6.180928 & 3.415 & 0.001324 & 0.000662 \tabularnewline
M10 & 20.2881455653972 & 6.132565 & 3.3083 & 0.001806 & 0.000903 \tabularnewline
M11 & 12.5819471261346 & 6.109528 & 2.0594 & 0.04502 & 0.02251 \tabularnewline
t & -0.525912654275461 & 0.13915 & -3.7795 & 0.000442 & 0.000221 \tabularnewline
\hline
\end{tabular}
%Source: https://freestatistics.org/blog/index.php?pk=58895&T=2

[TABLE]
[ROW][C]Multiple Linear Regression - Ordinary Least Squares[/C][/ROW]
[ROW][C]Variable[/C][C]Parameter[/C][C]S.D.[/C][C]T-STATH0: parameter = 0[/C][C]2-tail p-value[/C][C]1-tail p-value[/C][/ROW]
[ROW][C](Intercept)[/C][C]76.2878881544539[/C][C]7.052157[/C][C]10.8177[/C][C]0[/C][C]0[/C][/ROW]
[ROW][C]IGPic[/C][C]0.259021168205223[/C][C]0.052842[/C][C]4.9018[/C][C]1.2e-05[/C][C]6e-06[/C][/ROW]
[ROW][C]M1[/C][C]-1.42618565989672[/C][C]5.87495[/C][C]-0.2428[/C][C]0.80925[/C][C]0.404625[/C][/ROW]
[ROW][C]M2[/C][C]3.59316284151128[/C][C]6.356785[/C][C]0.5652[/C][C]0.574593[/C][C]0.287297[/C][/ROW]
[ROW][C]M3[/C][C]21.314459070658[/C][C]6.395024[/C][C]3.333[/C][C]0.001682[/C][C]0.000841[/C][/ROW]
[ROW][C]M4[/C][C]1.61647699326119[/C][C]6.437086[/C][C]0.2511[/C][C]0.802816[/C][C]0.401408[/C][/ROW]
[ROW][C]M5[/C][C]-1.29060083467887[/C][C]6.418071[/C][C]-0.2011[/C][C]0.841497[/C][C]0.420749[/C][/ROW]
[ROW][C]M6[/C][C]28.5023504634329[/C][C]6.313319[/C][C]4.5146[/C][C]4.2e-05[/C][C]2.1e-05[/C][/ROW]
[ROW][C]M7[/C][C]-23.8138522411022[/C][C]6.326095[/C][C]-3.7644[/C][C]0.000463[/C][C]0.000232[/C][/ROW]
[ROW][C]M8[/C][C]-18.2237877168161[/C][C]6.242291[/C][C]-2.9194[/C][C]0.005369[/C][C]0.002684[/C][/ROW]
[ROW][C]M9[/C][C]21.1078487635521[/C][C]6.180928[/C][C]3.415[/C][C]0.001324[/C][C]0.000662[/C][/ROW]
[ROW][C]M10[/C][C]20.2881455653972[/C][C]6.132565[/C][C]3.3083[/C][C]0.001806[/C][C]0.000903[/C][/ROW]
[ROW][C]M11[/C][C]12.5819471261346[/C][C]6.109528[/C][C]2.0594[/C][C]0.04502[/C][C]0.02251[/C][/ROW]
[ROW][C]t[/C][C]-0.525912654275461[/C][C]0.13915[/C][C]-3.7795[/C][C]0.000442[/C][C]0.000221[/C][/ROW]
[/TABLE]
Source: https://freestatistics.org/blog/index.php?pk=58895&T=2

Globally Unique Identifier (entire table): ba.freestatistics.org/blog/index.php?pk=58895&T=2

As an alternative you can also use a QR Code:  

The GUIDs for individual cells are displayed in the table below:

Multiple Linear Regression - Ordinary Least Squares
VariableParameterS.D.T-STATH0: parameter = 02-tail p-value1-tail p-value
(Intercept)76.28788815445397.05215710.817700
IGPic0.2590211682052230.0528424.90181.2e-056e-06
M1-1.426185659896725.87495-0.24280.809250.404625
M23.593162841511286.3567850.56520.5745930.287297
M321.3144590706586.3950243.3330.0016820.000841
M41.616476993261196.4370860.25110.8028160.401408
M5-1.290600834678876.418071-0.20110.8414970.420749
M628.50235046343296.3133194.51464.2e-052.1e-05
M7-23.81385224110226.326095-3.76440.0004630.000232
M8-18.22378771681616.242291-2.91940.0053690.002684
M921.10784876355216.1809283.4150.0013240.000662
M1020.28814556539726.1325653.30830.0018060.000903
M1112.58194712613466.1095282.05940.045020.02251
t-0.5259126542754610.13915-3.77950.0004420.000221


Multiple Linear Regression - Regression Statistics
Multiple R0.88943138357706
R-squared0.791088186091805
Adjusted R-squared0.73330406735124
F-TEST (value)13.690408425948
F-TEST (DF numerator)13
F-TEST (DF denominator)47
p-value7.45647987798748e-12
Multiple Linear Regression - Residual Statistics
Residual Standard Deviation9.65309347975947
Sum Squared Residuals4379.56404526181

\begin{tabular}{lllllllll}
\hline
Multiple Linear Regression - Regression Statistics \tabularnewline
Multiple R & 0.88943138357706 \tabularnewline
R-squared & 0.791088186091805 \tabularnewline
Adjusted R-squared & 0.73330406735124 \tabularnewline
F-TEST (value) & 13.690408425948 \tabularnewline
F-TEST (DF numerator) & 13 \tabularnewline
F-TEST (DF denominator) & 47 \tabularnewline
p-value & 7.45647987798748e-12 \tabularnewline
Multiple Linear Regression - Residual Statistics \tabularnewline
Residual Standard Deviation & 9.65309347975947 \tabularnewline
Sum Squared Residuals & 4379.56404526181 \tabularnewline
\hline
\end{tabular}
%Source: https://freestatistics.org/blog/index.php?pk=58895&T=3

[TABLE]
[ROW][C]Multiple Linear Regression - Regression Statistics[/C][/ROW]
[ROW][C]Multiple R[/C][C]0.88943138357706[/C][/ROW]
[ROW][C]R-squared[/C][C]0.791088186091805[/C][/ROW]
[ROW][C]Adjusted R-squared[/C][C]0.73330406735124[/C][/ROW]
[ROW][C]F-TEST (value)[/C][C]13.690408425948[/C][/ROW]
[ROW][C]F-TEST (DF numerator)[/C][C]13[/C][/ROW]
[ROW][C]F-TEST (DF denominator)[/C][C]47[/C][/ROW]
[ROW][C]p-value[/C][C]7.45647987798748e-12[/C][/ROW]
[ROW][C]Multiple Linear Regression - Residual Statistics[/C][/ROW]
[ROW][C]Residual Standard Deviation[/C][C]9.65309347975947[/C][/ROW]
[ROW][C]Sum Squared Residuals[/C][C]4379.56404526181[/C][/ROW]
[/TABLE]
Source: https://freestatistics.org/blog/index.php?pk=58895&T=3

Globally Unique Identifier (entire table): ba.freestatistics.org/blog/index.php?pk=58895&T=3

As an alternative you can also use a QR Code:  

The GUIDs for individual cells are displayed in the table below:

Multiple Linear Regression - Regression Statistics
Multiple R0.88943138357706
R-squared0.791088186091805
Adjusted R-squared0.73330406735124
F-TEST (value)13.690408425948
F-TEST (DF numerator)13
F-TEST (DF denominator)47
p-value7.45647987798748e-12
Multiple Linear Regression - Residual Statistics
Residual Standard Deviation9.65309347975947
Sum Squared Residuals4379.56404526181


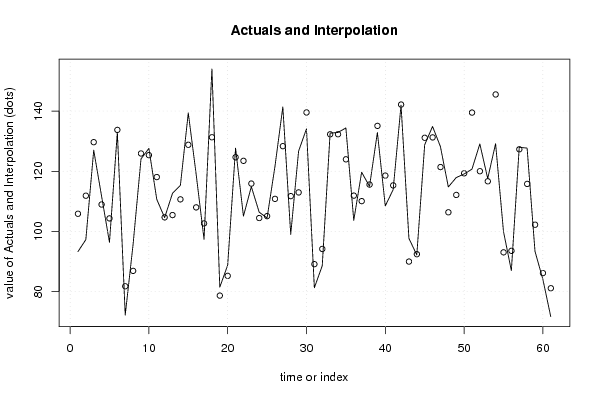
Multiple Linear Regression - Actuals, Interpolation, and Residuals
Time or IndexActualsInterpolationForecastResidualsPrediction Error
193.3105.884568127678-12.5845681276778
297.3111.880326750401-14.5803267504007
3127129.671459012144-2.671459012144
4111.7108.9554240608822.74457593911827
596.4104.356838321743-7.9568383217427
6133133.753387549682-0.753387549681674
772.281.7919441627688-9.59194416276883
895.886.90790026642058.89209973357947
9124.1125.920841027077-1.82084102707739
10127.6125.3522886792632.24771132073725
11110.7118.078555908084-7.37855590808402
12104.6104.685772842648-0.0857728426482145
13112.7105.4533967946317.24660320536917
14115.3110.6720919127384.62790808726197
15139.4128.79995169314810.6000483068519
16119108.00621039142410.9937896085757
1797.4102.682365381311-5.28236538131067
18154131.30185110463422.6981488953661
1981.578.6928547972082.80714520279194
2088.885.2593294428093.54067055719098
21127.7124.6608019557743.03919804422629
22105.1123.470598804267-18.3705988042665
23114.9115.911942748062-1.01194274806205
24106.4104.4618184441651.93818155583461
25104.5105.099931812045-0.599931812045432
26121.6110.83666926656310.7633307334369
27141.4128.34287824328113.0571217567194
2899111.745279866481-12.7452798664814
29126.7112.9746704119613.7253295880401
30134.1139.547888906462-5.44788890646194
3181.389.1405725287804-7.84057252878043
3288.694.2047243987911-5.60472439879111
33132.7132.2851889539090.414811046090823
34132.9132.3123852929670.587614707033468
35134.4123.97666573214610.4233342678536
36103.7111.904890624557-8.20489062455719
37119.7110.0823028944889.6176971055124
38115115.585921297621-0.585921297620538
39132.9135.086593269518-2.18659326951830
40108.5118.566701243181-10.0667012431807
41113.9115.315025578709-1.41502557870882
42142142.173167358237-0.173167358236589
4397.790.00450703675967.69549296324043
4492.292.4525451078975-0.252545107897483
45128.8131.128758349888-2.32875834988755
46134.9131.2595631562273.64043684377297
47128.2121.3956187029966.80438129700393
48114.8106.3710022778678.42899772213267
49117.9112.1377347762115.76226522378923
50119.1119.324990772678-0.224990772677658
51120.7139.499117781909-18.799117781909
52129.1120.0263844380329.07361556196816
53117.6116.6711003062780.928899693722106
54129.2145.523705080986-16.3237050809859
5510093.07012147448316.9298785255169
568793.5755007840819-6.57550078408186
57128127.3044097133520.695590286647829
58127.7115.80516406727711.8948359327229
5993.4102.237216908711-8.83721690871148
6084.186.1765158107619-2.07651581076187
6171.781.1420655949475-9.44206559494751

\begin{tabular}{lllllllll}
\hline
Multiple Linear Regression - Actuals, Interpolation, and Residuals \tabularnewline
Time or Index & Actuals & InterpolationForecast & ResidualsPrediction Error \tabularnewline
1 & 93.3 & 105.884568127678 & -12.5845681276778 \tabularnewline
2 & 97.3 & 111.880326750401 & -14.5803267504007 \tabularnewline
3 & 127 & 129.671459012144 & -2.671459012144 \tabularnewline
4 & 111.7 & 108.955424060882 & 2.74457593911827 \tabularnewline
5 & 96.4 & 104.356838321743 & -7.9568383217427 \tabularnewline
6 & 133 & 133.753387549682 & -0.753387549681674 \tabularnewline
7 & 72.2 & 81.7919441627688 & -9.59194416276883 \tabularnewline
8 & 95.8 & 86.9079002664205 & 8.89209973357947 \tabularnewline
9 & 124.1 & 125.920841027077 & -1.82084102707739 \tabularnewline
10 & 127.6 & 125.352288679263 & 2.24771132073725 \tabularnewline
11 & 110.7 & 118.078555908084 & -7.37855590808402 \tabularnewline
12 & 104.6 & 104.685772842648 & -0.0857728426482145 \tabularnewline
13 & 112.7 & 105.453396794631 & 7.24660320536917 \tabularnewline
14 & 115.3 & 110.672091912738 & 4.62790808726197 \tabularnewline
15 & 139.4 & 128.799951693148 & 10.6000483068519 \tabularnewline
16 & 119 & 108.006210391424 & 10.9937896085757 \tabularnewline
17 & 97.4 & 102.682365381311 & -5.28236538131067 \tabularnewline
18 & 154 & 131.301851104634 & 22.6981488953661 \tabularnewline
19 & 81.5 & 78.692854797208 & 2.80714520279194 \tabularnewline
20 & 88.8 & 85.259329442809 & 3.54067055719098 \tabularnewline
21 & 127.7 & 124.660801955774 & 3.03919804422629 \tabularnewline
22 & 105.1 & 123.470598804267 & -18.3705988042665 \tabularnewline
23 & 114.9 & 115.911942748062 & -1.01194274806205 \tabularnewline
24 & 106.4 & 104.461818444165 & 1.93818155583461 \tabularnewline
25 & 104.5 & 105.099931812045 & -0.599931812045432 \tabularnewline
26 & 121.6 & 110.836669266563 & 10.7633307334369 \tabularnewline
27 & 141.4 & 128.342878243281 & 13.0571217567194 \tabularnewline
28 & 99 & 111.745279866481 & -12.7452798664814 \tabularnewline
29 & 126.7 & 112.97467041196 & 13.7253295880401 \tabularnewline
30 & 134.1 & 139.547888906462 & -5.44788890646194 \tabularnewline
31 & 81.3 & 89.1405725287804 & -7.84057252878043 \tabularnewline
32 & 88.6 & 94.2047243987911 & -5.60472439879111 \tabularnewline
33 & 132.7 & 132.285188953909 & 0.414811046090823 \tabularnewline
34 & 132.9 & 132.312385292967 & 0.587614707033468 \tabularnewline
35 & 134.4 & 123.976665732146 & 10.4233342678536 \tabularnewline
36 & 103.7 & 111.904890624557 & -8.20489062455719 \tabularnewline
37 & 119.7 & 110.082302894488 & 9.6176971055124 \tabularnewline
38 & 115 & 115.585921297621 & -0.585921297620538 \tabularnewline
39 & 132.9 & 135.086593269518 & -2.18659326951830 \tabularnewline
40 & 108.5 & 118.566701243181 & -10.0667012431807 \tabularnewline
41 & 113.9 & 115.315025578709 & -1.41502557870882 \tabularnewline
42 & 142 & 142.173167358237 & -0.173167358236589 \tabularnewline
43 & 97.7 & 90.0045070367596 & 7.69549296324043 \tabularnewline
44 & 92.2 & 92.4525451078975 & -0.252545107897483 \tabularnewline
45 & 128.8 & 131.128758349888 & -2.32875834988755 \tabularnewline
46 & 134.9 & 131.259563156227 & 3.64043684377297 \tabularnewline
47 & 128.2 & 121.395618702996 & 6.80438129700393 \tabularnewline
48 & 114.8 & 106.371002277867 & 8.42899772213267 \tabularnewline
49 & 117.9 & 112.137734776211 & 5.76226522378923 \tabularnewline
50 & 119.1 & 119.324990772678 & -0.224990772677658 \tabularnewline
51 & 120.7 & 139.499117781909 & -18.799117781909 \tabularnewline
52 & 129.1 & 120.026384438032 & 9.07361556196816 \tabularnewline
53 & 117.6 & 116.671100306278 & 0.928899693722106 \tabularnewline
54 & 129.2 & 145.523705080986 & -16.3237050809859 \tabularnewline
55 & 100 & 93.0701214744831 & 6.9298785255169 \tabularnewline
56 & 87 & 93.5755007840819 & -6.57550078408186 \tabularnewline
57 & 128 & 127.304409713352 & 0.695590286647829 \tabularnewline
58 & 127.7 & 115.805164067277 & 11.8948359327229 \tabularnewline
59 & 93.4 & 102.237216908711 & -8.83721690871148 \tabularnewline
60 & 84.1 & 86.1765158107619 & -2.07651581076187 \tabularnewline
61 & 71.7 & 81.1420655949475 & -9.44206559494751 \tabularnewline
\hline
\end{tabular}
%Source: https://freestatistics.org/blog/index.php?pk=58895&T=4

[TABLE]
[ROW][C]Multiple Linear Regression - Actuals, Interpolation, and Residuals[/C][/ROW]
[ROW][C]Time or Index[/C][C]Actuals[/C][C]InterpolationForecast[/C][C]ResidualsPrediction Error[/C][/ROW]
[ROW][C]1[/C][C]93.3[/C][C]105.884568127678[/C][C]-12.5845681276778[/C][/ROW]
[ROW][C]2[/C][C]97.3[/C][C]111.880326750401[/C][C]-14.5803267504007[/C][/ROW]
[ROW][C]3[/C][C]127[/C][C]129.671459012144[/C][C]-2.671459012144[/C][/ROW]
[ROW][C]4[/C][C]111.7[/C][C]108.955424060882[/C][C]2.74457593911827[/C][/ROW]
[ROW][C]5[/C][C]96.4[/C][C]104.356838321743[/C][C]-7.9568383217427[/C][/ROW]
[ROW][C]6[/C][C]133[/C][C]133.753387549682[/C][C]-0.753387549681674[/C][/ROW]
[ROW][C]7[/C][C]72.2[/C][C]81.7919441627688[/C][C]-9.59194416276883[/C][/ROW]
[ROW][C]8[/C][C]95.8[/C][C]86.9079002664205[/C][C]8.89209973357947[/C][/ROW]
[ROW][C]9[/C][C]124.1[/C][C]125.920841027077[/C][C]-1.82084102707739[/C][/ROW]
[ROW][C]10[/C][C]127.6[/C][C]125.352288679263[/C][C]2.24771132073725[/C][/ROW]
[ROW][C]11[/C][C]110.7[/C][C]118.078555908084[/C][C]-7.37855590808402[/C][/ROW]
[ROW][C]12[/C][C]104.6[/C][C]104.685772842648[/C][C]-0.0857728426482145[/C][/ROW]
[ROW][C]13[/C][C]112.7[/C][C]105.453396794631[/C][C]7.24660320536917[/C][/ROW]
[ROW][C]14[/C][C]115.3[/C][C]110.672091912738[/C][C]4.62790808726197[/C][/ROW]
[ROW][C]15[/C][C]139.4[/C][C]128.799951693148[/C][C]10.6000483068519[/C][/ROW]
[ROW][C]16[/C][C]119[/C][C]108.006210391424[/C][C]10.9937896085757[/C][/ROW]
[ROW][C]17[/C][C]97.4[/C][C]102.682365381311[/C][C]-5.28236538131067[/C][/ROW]
[ROW][C]18[/C][C]154[/C][C]131.301851104634[/C][C]22.6981488953661[/C][/ROW]
[ROW][C]19[/C][C]81.5[/C][C]78.692854797208[/C][C]2.80714520279194[/C][/ROW]
[ROW][C]20[/C][C]88.8[/C][C]85.259329442809[/C][C]3.54067055719098[/C][/ROW]
[ROW][C]21[/C][C]127.7[/C][C]124.660801955774[/C][C]3.03919804422629[/C][/ROW]
[ROW][C]22[/C][C]105.1[/C][C]123.470598804267[/C][C]-18.3705988042665[/C][/ROW]
[ROW][C]23[/C][C]114.9[/C][C]115.911942748062[/C][C]-1.01194274806205[/C][/ROW]
[ROW][C]24[/C][C]106.4[/C][C]104.461818444165[/C][C]1.93818155583461[/C][/ROW]
[ROW][C]25[/C][C]104.5[/C][C]105.099931812045[/C][C]-0.599931812045432[/C][/ROW]
[ROW][C]26[/C][C]121.6[/C][C]110.836669266563[/C][C]10.7633307334369[/C][/ROW]
[ROW][C]27[/C][C]141.4[/C][C]128.342878243281[/C][C]13.0571217567194[/C][/ROW]
[ROW][C]28[/C][C]99[/C][C]111.745279866481[/C][C]-12.7452798664814[/C][/ROW]
[ROW][C]29[/C][C]126.7[/C][C]112.97467041196[/C][C]13.7253295880401[/C][/ROW]
[ROW][C]30[/C][C]134.1[/C][C]139.547888906462[/C][C]-5.44788890646194[/C][/ROW]
[ROW][C]31[/C][C]81.3[/C][C]89.1405725287804[/C][C]-7.84057252878043[/C][/ROW]
[ROW][C]32[/C][C]88.6[/C][C]94.2047243987911[/C][C]-5.60472439879111[/C][/ROW]
[ROW][C]33[/C][C]132.7[/C][C]132.285188953909[/C][C]0.414811046090823[/C][/ROW]
[ROW][C]34[/C][C]132.9[/C][C]132.312385292967[/C][C]0.587614707033468[/C][/ROW]
[ROW][C]35[/C][C]134.4[/C][C]123.976665732146[/C][C]10.4233342678536[/C][/ROW]
[ROW][C]36[/C][C]103.7[/C][C]111.904890624557[/C][C]-8.20489062455719[/C][/ROW]
[ROW][C]37[/C][C]119.7[/C][C]110.082302894488[/C][C]9.6176971055124[/C][/ROW]
[ROW][C]38[/C][C]115[/C][C]115.585921297621[/C][C]-0.585921297620538[/C][/ROW]
[ROW][C]39[/C][C]132.9[/C][C]135.086593269518[/C][C]-2.18659326951830[/C][/ROW]
[ROW][C]40[/C][C]108.5[/C][C]118.566701243181[/C][C]-10.0667012431807[/C][/ROW]
[ROW][C]41[/C][C]113.9[/C][C]115.315025578709[/C][C]-1.41502557870882[/C][/ROW]
[ROW][C]42[/C][C]142[/C][C]142.173167358237[/C][C]-0.173167358236589[/C][/ROW]
[ROW][C]43[/C][C]97.7[/C][C]90.0045070367596[/C][C]7.69549296324043[/C][/ROW]
[ROW][C]44[/C][C]92.2[/C][C]92.4525451078975[/C][C]-0.252545107897483[/C][/ROW]
[ROW][C]45[/C][C]128.8[/C][C]131.128758349888[/C][C]-2.32875834988755[/C][/ROW]
[ROW][C]46[/C][C]134.9[/C][C]131.259563156227[/C][C]3.64043684377297[/C][/ROW]
[ROW][C]47[/C][C]128.2[/C][C]121.395618702996[/C][C]6.80438129700393[/C][/ROW]
[ROW][C]48[/C][C]114.8[/C][C]106.371002277867[/C][C]8.42899772213267[/C][/ROW]
[ROW][C]49[/C][C]117.9[/C][C]112.137734776211[/C][C]5.76226522378923[/C][/ROW]
[ROW][C]50[/C][C]119.1[/C][C]119.324990772678[/C][C]-0.224990772677658[/C][/ROW]
[ROW][C]51[/C][C]120.7[/C][C]139.499117781909[/C][C]-18.799117781909[/C][/ROW]
[ROW][C]52[/C][C]129.1[/C][C]120.026384438032[/C][C]9.07361556196816[/C][/ROW]
[ROW][C]53[/C][C]117.6[/C][C]116.671100306278[/C][C]0.928899693722106[/C][/ROW]
[ROW][C]54[/C][C]129.2[/C][C]145.523705080986[/C][C]-16.3237050809859[/C][/ROW]
[ROW][C]55[/C][C]100[/C][C]93.0701214744831[/C][C]6.9298785255169[/C][/ROW]
[ROW][C]56[/C][C]87[/C][C]93.5755007840819[/C][C]-6.57550078408186[/C][/ROW]
[ROW][C]57[/C][C]128[/C][C]127.304409713352[/C][C]0.695590286647829[/C][/ROW]
[ROW][C]58[/C][C]127.7[/C][C]115.805164067277[/C][C]11.8948359327229[/C][/ROW]
[ROW][C]59[/C][C]93.4[/C][C]102.237216908711[/C][C]-8.83721690871148[/C][/ROW]
[ROW][C]60[/C][C]84.1[/C][C]86.1765158107619[/C][C]-2.07651581076187[/C][/ROW]
[ROW][C]61[/C][C]71.7[/C][C]81.1420655949475[/C][C]-9.44206559494751[/C][/ROW]
[/TABLE]
Source: https://freestatistics.org/blog/index.php?pk=58895&T=4

Globally Unique Identifier (entire table): ba.freestatistics.org/blog/index.php?pk=58895&T=4

As an alternative you can also use a QR Code:  

The GUIDs for individual cells are displayed in the table below:

Multiple Linear Regression - Actuals, Interpolation, and Residuals
Time or IndexActualsInterpolationForecastResidualsPrediction Error
193.3105.884568127678-12.5845681276778
297.3111.880326750401-14.5803267504007
3127129.671459012144-2.671459012144
4111.7108.9554240608822.74457593911827
596.4104.356838321743-7.9568383217427
6133133.753387549682-0.753387549681674
772.281.7919441627688-9.59194416276883
895.886.90790026642058.89209973357947
9124.1125.920841027077-1.82084102707739
10127.6125.3522886792632.24771132073725
11110.7118.078555908084-7.37855590808402
12104.6104.685772842648-0.0857728426482145
13112.7105.4533967946317.24660320536917
14115.3110.6720919127384.62790808726197
15139.4128.79995169314810.6000483068519
16119108.00621039142410.9937896085757
1797.4102.682365381311-5.28236538131067
18154131.30185110463422.6981488953661
1981.578.6928547972082.80714520279194
2088.885.2593294428093.54067055719098
21127.7124.6608019557743.03919804422629
22105.1123.470598804267-18.3705988042665
23114.9115.911942748062-1.01194274806205
24106.4104.4618184441651.93818155583461
25104.5105.099931812045-0.599931812045432
26121.6110.83666926656310.7633307334369
27141.4128.34287824328113.0571217567194
2899111.745279866481-12.7452798664814
29126.7112.9746704119613.7253295880401
30134.1139.547888906462-5.44788890646194
3181.389.1405725287804-7.84057252878043
3288.694.2047243987911-5.60472439879111
33132.7132.2851889539090.414811046090823
34132.9132.3123852929670.587614707033468
35134.4123.97666573214610.4233342678536
36103.7111.904890624557-8.20489062455719
37119.7110.0823028944889.6176971055124
38115115.585921297621-0.585921297620538
39132.9135.086593269518-2.18659326951830
40108.5118.566701243181-10.0667012431807
41113.9115.315025578709-1.41502557870882
42142142.173167358237-0.173167358236589
4397.790.00450703675967.69549296324043
4492.292.4525451078975-0.252545107897483
45128.8131.128758349888-2.32875834988755
46134.9131.2595631562273.64043684377297
47128.2121.3956187029966.80438129700393
48114.8106.3710022778678.42899772213267
49117.9112.1377347762115.76226522378923
50119.1119.324990772678-0.224990772677658
51120.7139.499117781909-18.799117781909
52129.1120.0263844380329.07361556196816
53117.6116.6711003062780.928899693722106
54129.2145.523705080986-16.3237050809859
5510093.07012147448316.9298785255169
568793.5755007840819-6.57550078408186
57128127.3044097133520.695590286647829
58127.7115.80516406727711.8948359327229
5993.4102.237216908711-8.83721690871148
6084.186.1765158107619-2.07651581076187
6171.781.1420655949475-9.44206559494751


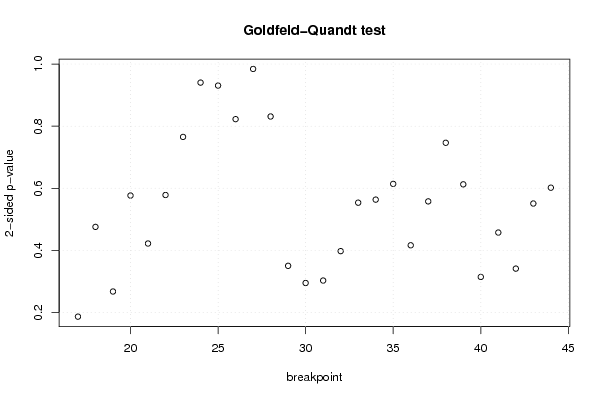
Goldfeld-Quandt test for Heteroskedasticity
p-valuesAlternative Hypothesis
breakpoint indexgreater2-sidedless
170.09323588576541410.1864717715308280.906764114234586
180.2378394015976380.4756788031952770.762160598402362
190.1337240174122480.2674480348244970.866275982587752
200.2882829524130810.5765659048261630.711717047586919
210.2110493745917280.4220987491834550.788950625408272
220.7108381191101620.5783237617796770.289161880889838
230.6172898809163660.7654202381672690.382710119083634
240.52979854401620.94040291196760.4702014559838
250.4654227072264490.9308454144528990.534577292773551
260.4113540508758740.8227081017517480.588645949124126
270.5077972459836280.9844055080327440.492202754016372
280.5843730291476030.8312539417047940.415626970852397
290.8248972396761560.3502055206476870.175102760323844
300.8525414636093290.2949170727813430.147458536390671
310.8486047757496250.302790448500750.151395224250375
320.8012236427033240.3975527145933530.198776357296676
330.7232065102422370.5535869795155250.276793489757763
340.718265170012320.5634696599753590.281734829987680
350.6929492640007540.6141014719984920.307050735999246
360.7918210799196880.4163578401606230.208178920080312
370.7210984739535590.5578030520928820.278901526046441
380.6267433824665180.7465132350669640.373256617533482
390.6936586677854340.6126826644291330.306341332214566
400.8427923469352390.3144153061295220.157207653064761
410.7712985550839650.457402889832070.228701444916035
420.829387138800780.3412257223984390.170612861199220
430.7245603750896120.5508792498207770.275439624910388
440.6990441247324090.6019117505351820.300955875267591

\begin{tabular}{lllllllll}
\hline
Goldfeld-Quandt test for Heteroskedasticity \tabularnewline
p-values & Alternative Hypothesis \tabularnewline
breakpoint index & greater & 2-sided & less \tabularnewline
17 & 0.0932358857654141 & 0.186471771530828 & 0.906764114234586 \tabularnewline
18 & 0.237839401597638 & 0.475678803195277 & 0.762160598402362 \tabularnewline
19 & 0.133724017412248 & 0.267448034824497 & 0.866275982587752 \tabularnewline
20 & 0.288282952413081 & 0.576565904826163 & 0.711717047586919 \tabularnewline
21 & 0.211049374591728 & 0.422098749183455 & 0.788950625408272 \tabularnewline
22 & 0.710838119110162 & 0.578323761779677 & 0.289161880889838 \tabularnewline
23 & 0.617289880916366 & 0.765420238167269 & 0.382710119083634 \tabularnewline
24 & 0.5297985440162 & 0.9404029119676 & 0.4702014559838 \tabularnewline
25 & 0.465422707226449 & 0.930845414452899 & 0.534577292773551 \tabularnewline
26 & 0.411354050875874 & 0.822708101751748 & 0.588645949124126 \tabularnewline
27 & 0.507797245983628 & 0.984405508032744 & 0.492202754016372 \tabularnewline
28 & 0.584373029147603 & 0.831253941704794 & 0.415626970852397 \tabularnewline
29 & 0.824897239676156 & 0.350205520647687 & 0.175102760323844 \tabularnewline
30 & 0.852541463609329 & 0.294917072781343 & 0.147458536390671 \tabularnewline
31 & 0.848604775749625 & 0.30279044850075 & 0.151395224250375 \tabularnewline
32 & 0.801223642703324 & 0.397552714593353 & 0.198776357296676 \tabularnewline
33 & 0.723206510242237 & 0.553586979515525 & 0.276793489757763 \tabularnewline
34 & 0.71826517001232 & 0.563469659975359 & 0.281734829987680 \tabularnewline
35 & 0.692949264000754 & 0.614101471998492 & 0.307050735999246 \tabularnewline
36 & 0.791821079919688 & 0.416357840160623 & 0.208178920080312 \tabularnewline
37 & 0.721098473953559 & 0.557803052092882 & 0.278901526046441 \tabularnewline
38 & 0.626743382466518 & 0.746513235066964 & 0.373256617533482 \tabularnewline
39 & 0.693658667785434 & 0.612682664429133 & 0.306341332214566 \tabularnewline
40 & 0.842792346935239 & 0.314415306129522 & 0.157207653064761 \tabularnewline
41 & 0.771298555083965 & 0.45740288983207 & 0.228701444916035 \tabularnewline
42 & 0.82938713880078 & 0.341225722398439 & 0.170612861199220 \tabularnewline
43 & 0.724560375089612 & 0.550879249820777 & 0.275439624910388 \tabularnewline
44 & 0.699044124732409 & 0.601911750535182 & 0.300955875267591 \tabularnewline
\hline
\end{tabular}
%Source: https://freestatistics.org/blog/index.php?pk=58895&T=5

[TABLE]
[ROW][C]Goldfeld-Quandt test for Heteroskedasticity[/C][/ROW]
[ROW][C]p-values[/C][C]Alternative Hypothesis[/C][/ROW]
[ROW][C]breakpoint index[/C][C]greater[/C][C]2-sided[/C][C]less[/C][/ROW]
[ROW][C]17[/C][C]0.0932358857654141[/C][C]0.186471771530828[/C][C]0.906764114234586[/C][/ROW]
[ROW][C]18[/C][C]0.237839401597638[/C][C]0.475678803195277[/C][C]0.762160598402362[/C][/ROW]
[ROW][C]19[/C][C]0.133724017412248[/C][C]0.267448034824497[/C][C]0.866275982587752[/C][/ROW]
[ROW][C]20[/C][C]0.288282952413081[/C][C]0.576565904826163[/C][C]0.711717047586919[/C][/ROW]
[ROW][C]21[/C][C]0.211049374591728[/C][C]0.422098749183455[/C][C]0.788950625408272[/C][/ROW]
[ROW][C]22[/C][C]0.710838119110162[/C][C]0.578323761779677[/C][C]0.289161880889838[/C][/ROW]
[ROW][C]23[/C][C]0.617289880916366[/C][C]0.765420238167269[/C][C]0.382710119083634[/C][/ROW]
[ROW][C]24[/C][C]0.5297985440162[/C][C]0.9404029119676[/C][C]0.4702014559838[/C][/ROW]
[ROW][C]25[/C][C]0.465422707226449[/C][C]0.930845414452899[/C][C]0.534577292773551[/C][/ROW]
[ROW][C]26[/C][C]0.411354050875874[/C][C]0.822708101751748[/C][C]0.588645949124126[/C][/ROW]
[ROW][C]27[/C][C]0.507797245983628[/C][C]0.984405508032744[/C][C]0.492202754016372[/C][/ROW]
[ROW][C]28[/C][C]0.584373029147603[/C][C]0.831253941704794[/C][C]0.415626970852397[/C][/ROW]
[ROW][C]29[/C][C]0.824897239676156[/C][C]0.350205520647687[/C][C]0.175102760323844[/C][/ROW]
[ROW][C]30[/C][C]0.852541463609329[/C][C]0.294917072781343[/C][C]0.147458536390671[/C][/ROW]
[ROW][C]31[/C][C]0.848604775749625[/C][C]0.30279044850075[/C][C]0.151395224250375[/C][/ROW]
[ROW][C]32[/C][C]0.801223642703324[/C][C]0.397552714593353[/C][C]0.198776357296676[/C][/ROW]
[ROW][C]33[/C][C]0.723206510242237[/C][C]0.553586979515525[/C][C]0.276793489757763[/C][/ROW]
[ROW][C]34[/C][C]0.71826517001232[/C][C]0.563469659975359[/C][C]0.281734829987680[/C][/ROW]
[ROW][C]35[/C][C]0.692949264000754[/C][C]0.614101471998492[/C][C]0.307050735999246[/C][/ROW]
[ROW][C]36[/C][C]0.791821079919688[/C][C]0.416357840160623[/C][C]0.208178920080312[/C][/ROW]
[ROW][C]37[/C][C]0.721098473953559[/C][C]0.557803052092882[/C][C]0.278901526046441[/C][/ROW]
[ROW][C]38[/C][C]0.626743382466518[/C][C]0.746513235066964[/C][C]0.373256617533482[/C][/ROW]
[ROW][C]39[/C][C]0.693658667785434[/C][C]0.612682664429133[/C][C]0.306341332214566[/C][/ROW]
[ROW][C]40[/C][C]0.842792346935239[/C][C]0.314415306129522[/C][C]0.157207653064761[/C][/ROW]
[ROW][C]41[/C][C]0.771298555083965[/C][C]0.45740288983207[/C][C]0.228701444916035[/C][/ROW]
[ROW][C]42[/C][C]0.82938713880078[/C][C]0.341225722398439[/C][C]0.170612861199220[/C][/ROW]
[ROW][C]43[/C][C]0.724560375089612[/C][C]0.550879249820777[/C][C]0.275439624910388[/C][/ROW]
[ROW][C]44[/C][C]0.699044124732409[/C][C]0.601911750535182[/C][C]0.300955875267591[/C][/ROW]
[/TABLE]
Source: https://freestatistics.org/blog/index.php?pk=58895&T=5

Globally Unique Identifier (entire table): ba.freestatistics.org/blog/index.php?pk=58895&T=5

As an alternative you can also use a QR Code:  

The GUIDs for individual cells are displayed in the table below:

Goldfeld-Quandt test for Heteroskedasticity
p-valuesAlternative Hypothesis
breakpoint indexgreater2-sidedless
170.09323588576541410.1864717715308280.906764114234586
180.2378394015976380.4756788031952770.762160598402362
190.1337240174122480.2674480348244970.866275982587752
200.2882829524130810.5765659048261630.711717047586919
210.2110493745917280.4220987491834550.788950625408272
220.7108381191101620.5783237617796770.289161880889838
230.6172898809163660.7654202381672690.382710119083634
240.52979854401620.94040291196760.4702014559838
250.4654227072264490.9308454144528990.534577292773551
260.4113540508758740.8227081017517480.588645949124126
270.5077972459836280.9844055080327440.492202754016372
280.5843730291476030.8312539417047940.415626970852397
290.8248972396761560.3502055206476870.175102760323844
300.8525414636093290.2949170727813430.147458536390671
310.8486047757496250.302790448500750.151395224250375
320.8012236427033240.3975527145933530.198776357296676
330.7232065102422370.5535869795155250.276793489757763
340.718265170012320.5634696599753590.281734829987680
350.6929492640007540.6141014719984920.307050735999246
360.7918210799196880.4163578401606230.208178920080312
370.7210984739535590.5578030520928820.278901526046441
380.6267433824665180.7465132350669640.373256617533482
390.6936586677854340.6126826644291330.306341332214566
400.8427923469352390.3144153061295220.157207653064761
410.7712985550839650.457402889832070.228701444916035
420.829387138800780.3412257223984390.170612861199220
430.7245603750896120.5508792498207770.275439624910388
440.6990441247324090.6019117505351820.300955875267591


Meta Analysis of Goldfeld-Quandt test for Heteroskedasticity
Description# significant tests% significant testsOK/NOK
1% type I error level00OK
5% type I error level00OK
10% type I error level00OK

\begin{tabular}{lllllllll}
\hline
Meta Analysis of Goldfeld-Quandt test for Heteroskedasticity \tabularnewline
Description & # significant tests & % significant tests & OK/NOK \tabularnewline
1% type I error level & 0 & 0 & OK \tabularnewline
5% type I error level & 0 & 0 & OK \tabularnewline
10% type I error level & 0 & 0 & OK \tabularnewline
\hline
\end{tabular}
%Source: https://freestatistics.org/blog/index.php?pk=58895&T=6

[TABLE]
[ROW][C]Meta Analysis of Goldfeld-Quandt test for Heteroskedasticity[/C][/ROW]
[ROW][C]Description[/C][C]# significant tests[/C][C]% significant tests[/C][C]OK/NOK[/C][/ROW]
[ROW][C]1% type I error level[/C][C]0[/C][C]0[/C][C]OK[/C][/ROW]
[ROW][C]5% type I error level[/C][C]0[/C][C]0[/C][C]OK[/C][/ROW]
[ROW][C]10% type I error level[/C][C]0[/C][C]0[/C][C]OK[/C][/ROW]
[/TABLE]
Source: https://freestatistics.org/blog/index.php?pk=58895&T=6

Globally Unique Identifier (entire table): ba.freestatistics.org/blog/index.php?pk=58895&T=6

As an alternative you can also use a QR Code:  

The GUIDs for individual cells are displayed in the table below:

Meta Analysis of Goldfeld-Quandt test for Heteroskedasticity
Description# significant tests% significant testsOK/NOK
1% type I error level00OK
5% type I error level00OK
10% type I error level00OK


Parameters (Session):
par1 = 1 ; par2 = Include Monthly Dummies ; par3 = Linear Trend ;
Parameters (R input):
par1 = 1 ; par2 = Include Monthly Dummies ; par3 = Linear Trend ;
R code (references can be found in the software module):
library(lattice)
library(lmtest)
n25 <- 25 #minimum number of obs. for Goldfeld-Quandt test
par1 <- as.numeric(par1)
x <- t(y)
k <- length(x[1,])
n <- length(x[,1])
x1 <- cbind(x[,par1], x[,1:k!=par1])
mycolnames <- c(colnames(x)[par1], colnames(x)[1:k!=par1])
colnames(x1) <- mycolnames #colnames(x)[par1]
x <- x1
if (par3 == 'First Differences'){
x2 <- array(0, dim=c(n-1,k), dimnames=list(1:(n-1), paste('(1-B)',colnames(x),sep='')))
for (i in 1:n-1) {
for (j in 1:k) {
x2[i,j] <- x[i+1,j] - x[i,j]
}
}
x <- x2
}
if (par2 == 'Include Monthly Dummies'){
x2 <- array(0, dim=c(n,11), dimnames=list(1:n, paste('M', seq(1:11), sep ='')))
for (i in 1:11){
x2[seq(i,n,12),i] <- 1
}
x <- cbind(x, x2)
}
if (par2 == 'Include Quarterly Dummies'){
x2 <- array(0, dim=c(n,3), dimnames=list(1:n, paste('Q', seq(1:3), sep ='')))
for (i in 1:3){
x2[seq(i,n,4),i] <- 1
}
x <- cbind(x, x2)
}
k <- length(x[1,])
if (par3 == 'Linear Trend'){
x <- cbind(x, c(1:n))
colnames(x)[k+1] <- 't'
}
x
k <- length(x[1,])
df <- as.data.frame(x)
(mylm <- lm(df))
(mysum <- summary(mylm))
if (n > n25) {
kp3 <- k + 3
nmkm3 <- n - k - 3
gqarr <- array(NA, dim=c(nmkm3-kp3+1,3))
numgqtests <- 0
numsignificant1 <- 0
numsignificant5 <- 0
numsignificant10 <- 0
for (mypoint in kp3:nmkm3) {
j <- 0
numgqtests <- numgqtests + 1
for (myalt in c('greater', 'two.sided', 'less')) {
j <- j + 1
gqarr[mypoint-kp3+1,j] <- gqtest(mylm, point=mypoint, alternative=myalt)$p.value
}
if (gqarr[mypoint-kp3+1,2] < 0.01) numsignificant1 <- numsignificant1 + 1
if (gqarr[mypoint-kp3+1,2] < 0.05) numsignificant5 <- numsignificant5 + 1
if (gqarr[mypoint-kp3+1,2] < 0.10) numsignificant10 <- numsignificant10 + 1
}
gqarr
}
bitmap(file='test0.png')
plot(x[,1], type='l', main='Actuals and Interpolation', ylab='value of Actuals and Interpolation (dots)', xlab='time or index')
points(x[,1]-mysum$resid)
grid()
dev.off()
bitmap(file='test1.png')
plot(mysum$resid, type='b', pch=19, main='Residuals', ylab='value of Residuals', xlab='time or index')
grid()
dev.off()
bitmap(file='test2.png')
hist(mysum$resid, main='Residual Histogram', xlab='values of Residuals')
grid()
dev.off()
bitmap(file='test3.png')
densityplot(~mysum$resid,col='black',main='Residual Density Plot', xlab='values of Residuals')
dev.off()
bitmap(file='test4.png')
qqnorm(mysum$resid, main='Residual Normal Q-Q Plot')
qqline(mysum$resid)
grid()
dev.off()
(myerror <- as.ts(mysum$resid))
bitmap(file='test5.png')
dum <- cbind(lag(myerror,k=1),myerror)
dum
dum1 <- dum[2:length(myerror),]
dum1
z <- as.data.frame(dum1)
z
plot(z,main=paste('Residual Lag plot, lowess, and regression line'), ylab='values of Residuals', xlab='lagged values of Residuals')
lines(lowess(z))
abline(lm(z))
grid()
dev.off()
bitmap(file='test6.png')
acf(mysum$resid, lag.max=length(mysum$resid)/2, main='Residual Autocorrelation Function')
grid()
dev.off()
bitmap(file='test7.png')
pacf(mysum$resid, lag.max=length(mysum$resid)/2, main='Residual Partial Autocorrelation Function')
grid()
dev.off()
bitmap(file='test8.png')
opar <- par(mfrow = c(2,2), oma = c(0, 0, 1.1, 0))
plot(mylm, las = 1, sub='Residual Diagnostics')
par(opar)
dev.off()
if (n > n25) {
bitmap(file='test9.png')
plot(kp3:nmkm3,gqarr[,2], main='Goldfeld-Quandt test',ylab='2-sided p-value',xlab='breakpoint')
grid()
dev.off()
}
load(file='createtable')
a<-table.start()
a<-table.row.start(a)
a<-table.element(a, 'Multiple Linear Regression - Estimated Regression Equation', 1, TRUE)
a<-table.row.end(a)
myeq <- colnames(x)[1]
myeq <- paste(myeq, '[t] = ', sep='')
for (i in 1:k){
if (mysum$coefficients[i,1] > 0) myeq <- paste(myeq, '+', '')
myeq <- paste(myeq, mysum$coefficients[i,1], sep=' ')
if (rownames(mysum$coefficients)[i] != '(Intercept)') {
myeq <- paste(myeq, rownames(mysum$coefficients)[i], sep='')
if (rownames(mysum$coefficients)[i] != 't') myeq <- paste(myeq, '[t]', sep='')
}
}
myeq <- paste(myeq, ' + e[t]')
a<-table.row.start(a)
a<-table.element(a, myeq)
a<-table.row.end(a)
a<-table.end(a)
table.save(a,file='mytable1.tab')
a<-table.start()
a<-table.row.start(a)
a<-table.element(a,hyperlink('ols1.htm','Multiple Linear Regression - Ordinary Least Squares',''), 6, TRUE)
a<-table.row.end(a)
a<-table.row.start(a)
a<-table.element(a,'Variable',header=TRUE)
a<-table.element(a,'Parameter',header=TRUE)
a<-table.element(a,'S.D.',header=TRUE)
a<-table.element(a,'T-STAT
H0: parameter = 0',header=TRUE)
a<-table.element(a,'2-tail p-value',header=TRUE)
a<-table.element(a,'1-tail p-value',header=TRUE)
a<-table.row.end(a)
for (i in 1:k){
a<-table.row.start(a)
a<-table.element(a,rownames(mysum$coefficients)[i],header=TRUE)
a<-table.element(a,mysum$coefficients[i,1])
a<-table.element(a, round(mysum$coefficients[i,2],6))
a<-table.element(a, round(mysum$coefficients[i,3],4))
a<-table.element(a, round(mysum$coefficients[i,4],6))
a<-table.element(a, round(mysum$coefficients[i,4]/2,6))
a<-table.row.end(a)
}
a<-table.end(a)
table.save(a,file='mytable2.tab')
a<-table.start()
a<-table.row.start(a)
a<-table.element(a, 'Multiple Linear Regression - Regression Statistics', 2, TRUE)
a<-table.row.end(a)
a<-table.row.start(a)
a<-table.element(a, 'Multiple R',1,TRUE)
a<-table.element(a, sqrt(mysum$r.squared))
a<-table.row.end(a)
a<-table.row.start(a)
a<-table.element(a, 'R-squared',1,TRUE)
a<-table.element(a, mysum$r.squared)
a<-table.row.end(a)
a<-table.row.start(a)
a<-table.element(a, 'Adjusted R-squared',1,TRUE)
a<-table.element(a, mysum$adj.r.squared)
a<-table.row.end(a)
a<-table.row.start(a)
a<-table.element(a, 'F-TEST (value)',1,TRUE)
a<-table.element(a, mysum$fstatistic[1])
a<-table.row.end(a)
a<-table.row.start(a)
a<-table.element(a, 'F-TEST (DF numerator)',1,TRUE)
a<-table.element(a, mysum$fstatistic[2])
a<-table.row.end(a)
a<-table.row.start(a)
a<-table.element(a, 'F-TEST (DF denominator)',1,TRUE)
a<-table.element(a, mysum$fstatistic[3])
a<-table.row.end(a)
a<-table.row.start(a)
a<-table.element(a, 'p-value',1,TRUE)
a<-table.element(a, 1-pf(mysum$fstatistic[1],mysum$fstatistic[2],mysum$fstatistic[3]))
a<-table.row.end(a)
a<-table.row.start(a)
a<-table.element(a, 'Multiple Linear Regression - Residual Statistics', 2, TRUE)
a<-table.row.end(a)
a<-table.row.start(a)
a<-table.element(a, 'Residual Standard Deviation',1,TRUE)
a<-table.element(a, mysum$sigma)
a<-table.row.end(a)
a<-table.row.start(a)
a<-table.element(a, 'Sum Squared Residuals',1,TRUE)
a<-table.element(a, sum(myerror*myerror))
a<-table.row.end(a)
a<-table.end(a)
table.save(a,file='mytable3.tab')
a<-table.start()
a<-table.row.start(a)
a<-table.element(a, 'Multiple Linear Regression - Actuals, Interpolation, and Residuals', 4, TRUE)
a<-table.row.end(a)
a<-table.row.start(a)
a<-table.element(a, 'Time or Index', 1, TRUE)
a<-table.element(a, 'Actuals', 1, TRUE)
a<-table.element(a, 'Interpolation
Forecast', 1, TRUE)
a<-table.element(a, 'Residuals
Prediction Error', 1, TRUE)
a<-table.row.end(a)
for (i in 1:n) {
a<-table.row.start(a)
a<-table.element(a,i, 1, TRUE)
a<-table.element(a,x[i])
a<-table.element(a,x[i]-mysum$resid[i])
a<-table.element(a,mysum$resid[i])
a<-table.row.end(a)
}
a<-table.end(a)
table.save(a,file='mytable4.tab')
if (n > n25) {
a<-table.start()
a<-table.row.start(a)
a<-table.element(a,'Goldfeld-Quandt test for Heteroskedasticity',4,TRUE)
a<-table.row.end(a)
a<-table.row.start(a)
a<-table.element(a,'p-values',header=TRUE)
a<-table.element(a,'Alternative Hypothesis',3,header=TRUE)
a<-table.row.end(a)
a<-table.row.start(a)
a<-table.element(a,'breakpoint index',header=TRUE)
a<-table.element(a,'greater',header=TRUE)
a<-table.element(a,'2-sided',header=TRUE)
a<-table.element(a,'less',header=TRUE)
a<-table.row.end(a)
for (mypoint in kp3:nmkm3) {
a<-table.row.start(a)
a<-table.element(a,mypoint,header=TRUE)
a<-table.element(a,gqarr[mypoint-kp3+1,1])
a<-table.element(a,gqarr[mypoint-kp3+1,2])
a<-table.element(a,gqarr[mypoint-kp3+1,3])
a<-table.row.end(a)
}
a<-table.end(a)
table.save(a,file='mytable5.tab')
a<-table.start()
a<-table.row.start(a)
a<-table.element(a,'Meta Analysis of Goldfeld-Quandt test for Heteroskedasticity',4,TRUE)
a<-table.row.end(a)
a<-table.row.start(a)
a<-table.element(a,'Description',header=TRUE)
a<-table.element(a,'# significant tests',header=TRUE)
a<-table.element(a,'% significant tests',header=TRUE)
a<-table.element(a,'OK/NOK',header=TRUE)
a<-table.row.end(a)
a<-table.row.start(a)
a<-table.element(a,'1% type I error level',header=TRUE)
a<-table.element(a,numsignificant1)
a<-table.element(a,numsignificant1/numgqtests)
if (numsignificant1/numgqtests < 0.01) dum <- 'OK' else dum <- 'NOK'
a<-table.element(a,dum)
a<-table.row.end(a)
a<-table.row.start(a)
a<-table.element(a,'5% type I error level',header=TRUE)
a<-table.element(a,numsignificant5)
a<-table.element(a,numsignificant5/numgqtests)
if (numsignificant5/numgqtests < 0.05) dum <- 'OK' else dum <- 'NOK'
a<-table.element(a,dum)
a<-table.row.end(a)
a<-table.row.start(a)
a<-table.element(a,'10% type I error level',header=TRUE)
a<-table.element(a,numsignificant10)
a<-table.element(a,numsignificant10/numgqtests)
if (numsignificant10/numgqtests < 0.1) dum <- 'OK' else dum <- 'NOK'
a<-table.element(a,dum)
a<-table.row.end(a)
a<-table.end(a)
table.save(a,file='mytable6.tab')
}