| Multiple Linear Regression - Estimated Regression Equation |
| nwwmb[t] = + 18592.6614036799 + 5070.20661526654dummy_variable[t] + 1.09315352748084`y[t-1]`[t] -0.141678933809927`y[t-4] `[t] -1113.51362844413M1[t] -4788.11504224625M2[t] -8151.06975649466M3[t] -5304.29940467738M4[t] -9150.79794834342M5[t] -5800.60338064344M6[t] + 17130.3065854846M7[t] -3934.41364080719M8[t] -8074.2150653462M9[t] -13077.5188296226M10[t] -8827.75850794206M11[t] -95.0676676861505t + e[t] |
| Multiple Linear Regression - Ordinary Least Squares | |||||
| Variable | Parameter | S.D. | T-STAT H0: parameter = 0 | 2-tail p-value | 1-tail p-value |
| (Intercept) | 18592.6614036799 | 12851.143247 | 1.4468 | 0.155753 | 0.077876 |
| dummy_variable | 5070.20661526654 | 2020.757669 | 2.5091 | 0.016258 | 0.008129 |
| `y[t-1]` | 1.09315352748084 | 0.076589 | 14.273 | 0 | 0 |
| `y[t-4] ` | -0.141678933809927 | 0.091655 | -1.5458 | 0.130032 | 0.065016 |
| M1 | -1113.51362844413 | 2361.601036 | -0.4715 | 0.63984 | 0.31992 |
| M2 | -4788.11504224625 | 2525.289385 | -1.8961 | 0.065191 | 0.032596 |
| M3 | -8151.06975649466 | 2721.215839 | -2.9954 | 0.004688 | 0.002344 |
| M4 | -5304.29940467738 | 2510.866985 | -2.1125 | 0.040931 | 0.020466 |
| M5 | -9150.79794834342 | 2418.510059 | -3.7837 | 0.000507 | 0.000254 |
| M6 | -5800.60338064344 | 2358.64987 | -2.4593 | 0.018342 | 0.009171 |
| M7 | 17130.3065854846 | 2373.894636 | 7.2161 | 0 | 0 |
| M8 | -3934.41364080719 | 3023.927286 | -1.3011 | 0.200671 | 0.100336 |
| M9 | -8074.2150653462 | 3649.0272 | -2.2127 | 0.032689 | 0.016344 |
| M10 | -13077.5188296226 | 3826.149902 | -3.4179 | 0.001463 | 0.000731 |
| M11 | -8827.75850794206 | 2525.452699 | -3.4955 | 0.001173 | 0.000586 |
| t | -95.0676676861505 | 54.948861 | -1.7301 | 0.09132 | 0.04566 |
| Multiple Linear Regression - Regression Statistics | |
| Multiple R | 0.986524164699137 |
| R-squared | 0.97322992753533 |
| Adjusted R-squared | 0.963191150361078 |
| F-TEST (value) | 96.9470594517807 |
| F-TEST (DF numerator) | 15 |
| F-TEST (DF denominator) | 40 |
| p-value | 0 |
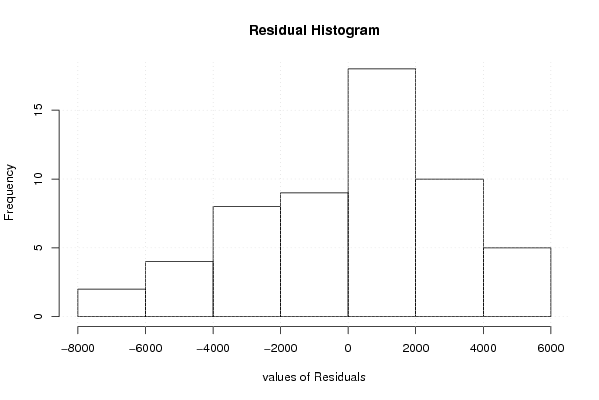
| Multiple Linear Regression - Residual Statistics | |
| Residual Standard Deviation | 3478.32596296376 |
| Sum Squared Residuals | 483950060.185111 |
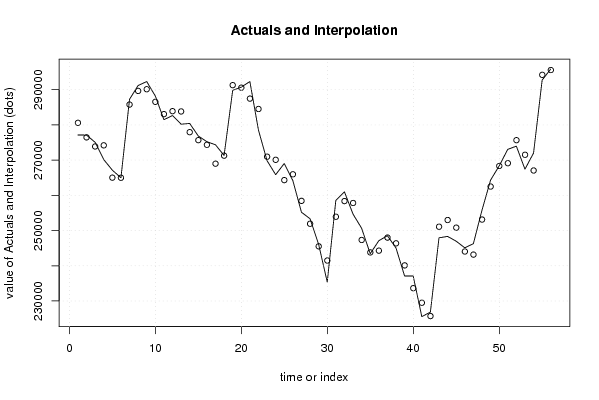
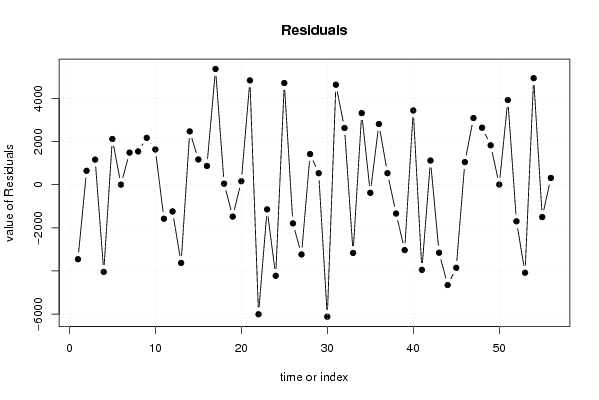
| Multiple Linear Regression - Actuals, Interpolation, and Residuals | |||
| Time or Index | Actuals | Interpolation Forecast | Residuals Prediction Error |
| 1 | 277128 | 280582.376909595 | -3454.37690959532 |
| 2 | 277103 | 276456.773006343 | 646.226993656633 |
| 3 | 275037 | 273871.791410584 | 1165.20858941606 |
| 4 | 270150 | 274191.057176221 | -4041.057176221 |
| 5 | 267140 | 265018.750996978 | 2121.24900302167 |
| 6 | 264993 | 264987.02775262 | 5.97224737992656 |
| 7 | 287259 | 285768.578104812 | 1490.42189518815 |
| 8 | 291186 | 289641.331603252 | 1544.66839674845 |
| 9 | 292300 | 290125.730004212 | 2174.26999578847 |
| 10 | 288186 | 286549.316272753 | 1636.68372724742 |
| 11 | 281477 | 283052.152174479 | -1575.15217447895 |
| 12 | 282656 | 283894.502825794 | -1238.50282579428 |
| 13 | 280190 | 283816.919206300 | -3626.91920629965 |
| 14 | 280408 | 277934.400659738 | 2473.59934026233 |
| 15 | 276836 | 275665.209713725 | 1170.79028627528 |
| 16 | 275216 | 274345.128534732 | 870.871465267632 |
| 17 | 274352 | 268982.033859637 | 5369.96614036351 |
| 18 | 271311 | 271261.790104336 | 49.2098956636920 |
| 19 | 289802 | 291279.429677278 | -1477.42967727796 |
| 20 | 290726 | 290562.663532720 | 163.336467279566 |
| 21 | 292300 | 287460.278898699 | 4839.72110130066 |
| 22 | 278506 | 284513.376756708 | -6007.37675670765 |
| 23 | 269826 | 270969.324487552 | -1143.32448755191 |
| 24 | 265861 | 270082.531374434 | -4221.53137443373 |
| 25 | 269034 | 264316.593700025 | 4717.40629997492 |
| 26 | 264176 | 265969.819974208 | -1793.81997420765 |
| 27 | 255198 | 258431.030901241 | -3233.03090124131 |
| 28 | 253353 | 251930.158188206 | 1422.84181179422 |
| 29 | 246057 | 245522.176461673 | 534.823538327469 |
| 30 | 235372 | 241489.931485635 | -6117.93148563475 |
| 31 | 258556 | 253917.421810689 | 4638.57818931071 |
| 32 | 260993 | 258362.702930707 | 2630.29706929339 |
| 33 | 254663 | 257825.538486029 | -3162.53848602947 |
| 34 | 250643 | 247321.344632872 | 3321.65536712773 |
| 35 | 243422 | 243796.875704944 | -374.875704944312 |
| 36 | 247105 | 244290.633361566 | 2814.36663843374 |
| 37 | 248541 | 248004.964158165 | 536.03584183524 |
| 38 | 245039 | 246374.612856055 | -1335.61285605488 |
| 39 | 237080 | 240111.430401924 | -3031.43040192388 |
| 40 | 237085 | 233640.920647613 | 3444.07935238698 |
| 41 | 225554 | 229501.369254947 | -3947.36925494718 |
| 42 | 226839 | 225717.709071048 | 1121.29092895169 |
| 43 | 247934 | 251085.876286496 | -3151.87628649625 |
| 44 | 248333 | 252985.453660058 | -4652.45366005771 |
| 45 | 246969 | 250820.452611060 | -3851.45261105966 |
| 46 | 245098 | 244048.962337668 | 1049.03766233249 |
| 47 | 246263 | 243169.647633025 | 3093.35236697518 |
| 48 | 255765 | 253119.332438206 | 2645.66756179425 |
| 49 | 264319 | 262491.146025915 | 1827.85397408481 |
| 50 | 268347 | 268337.393503656 | 9.6064963435664 |
| 51 | 273046 | 269117.537572526 | 3928.46242747385 |
| 52 | 273963 | 275659.735453228 | -1696.73545322784 |
| 53 | 267430 | 271508.669426765 | -4078.66942676547 |
| 54 | 271993 | 267051.541586361 | 4941.45841363944 |
| 55 | 292710 | 294209.694120725 | -1499.69412072466 |
| 56 | 295881 | 295566.848273264 | 314.151726736299 |
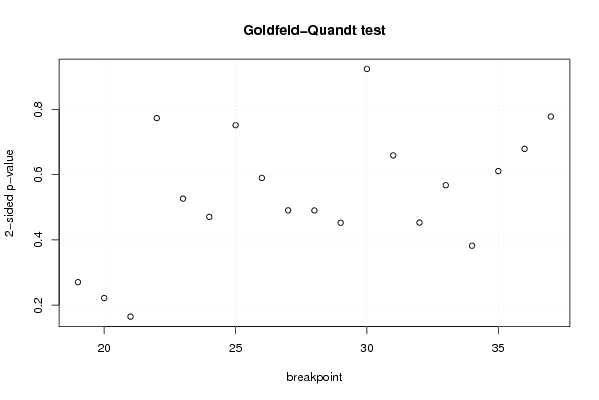
| Goldfeld-Quandt test for Heteroskedasticity | |||
| p-values | Alternative Hypothesis | ||
| breakpoint index | greater | 2-sided | less |
| 19 | 0.135343432794227 | 0.270686865588453 | 0.864656567205773 |
| 20 | 0.110975922411538 | 0.221951844823075 | 0.889024077588462 |
| 21 | 0.0825155023692401 | 0.165031004738480 | 0.91748449763076 |
| 22 | 0.386627057180675 | 0.77325411436135 | 0.613372942819325 |
| 23 | 0.263281862975112 | 0.526563725950223 | 0.736718137024888 |
| 24 | 0.235362827671022 | 0.470725655342044 | 0.764637172328978 |
| 25 | 0.37579505156672 | 0.75159010313344 | 0.62420494843328 |
| 26 | 0.294975428542361 | 0.589950857084722 | 0.705024571457639 |
| 27 | 0.245351382569773 | 0.490702765139547 | 0.754648617430226 |
| 28 | 0.245186372332541 | 0.490372744665082 | 0.754813627667459 |
| 29 | 0.226305856352048 | 0.452611712704097 | 0.773694143647952 |
| 30 | 0.461959417757368 | 0.923918835514736 | 0.538040582242632 |
| 31 | 0.670496432393479 | 0.659007135213042 | 0.329503567606521 |
| 32 | 0.773409489222659 | 0.453181021554682 | 0.226590510777341 |
| 33 | 0.716165992785455 | 0.567668014429091 | 0.283834007214545 |
| 34 | 0.808794749983291 | 0.382410500033418 | 0.191205250016709 |
| 35 | 0.694522403401937 | 0.610955193196126 | 0.305477596598063 |
| 36 | 0.660456613446626 | 0.679086773106747 | 0.339543386553374 |
| 37 | 0.610924057351535 | 0.778151885296929 | 0.389075942648465 |
| Meta Analysis of Goldfeld-Quandt test for Heteroskedasticity | |||
| Description | # significant tests | % significant tests | OK/NOK |
| 1% type I error level | 0 | 0 | OK |
| 5% type I error level | 0 | 0 | OK |
| 10% type I error level | 0 | 0 | OK |