| Multiple Linear Regression - Estimated Regression Equation |
| EUDO[t] = + 0.962415386308849 + 1.98712515138476e-05UITV[t] -0.0531840779040217M1[t] -0.0467402096762419M2[t] -0.0135028975421446M3[t] + 0.0282457901815517M4[t] + 0.0168342620170412M5[t] + 0.0210981792690236M6[t] -0.0605419433507508M7[t] -0.0384205855434918M8[t] -0.0389194261214411M9[t] -0.0459060463579918M10[t] -0.0156144435369607M11[t] + e[t] |
| Multiple Linear Regression - Ordinary Least Squares | |||||
| Variable | Parameter | S.D. | T-STAT H0: parameter = 0 | 2-tail p-value | 1-tail p-value |
| (Intercept) | 0.962415386308849 | 0.125251 | 7.6839 | 0 | 0 |
| UITV | 1.98712515138476e-05 | 7e-06 | 2.7376 | 0.009111 | 0.004556 |
| M1 | -0.0531840779040217 | 0.055948 | -0.9506 | 0.347382 | 0.173691 |
| M2 | -0.0467402096762419 | 0.056097 | -0.8332 | 0.409561 | 0.20478 |
| M3 | -0.0135028975421446 | 0.055636 | -0.2427 | 0.809447 | 0.404724 |
| M4 | 0.0282457901815517 | 0.053881 | 0.5242 | 0.602944 | 0.301472 |
| M5 | 0.0168342620170412 | 0.054685 | 0.3078 | 0.759764 | 0.379882 |
| M6 | 0.0210981792690236 | 0.054356 | 0.3881 | 0.699914 | 0.349957 |
| M7 | -0.0605419433507508 | 0.065578 | -0.9232 | 0.361303 | 0.180651 |
| M8 | -0.0384205855434918 | 0.059074 | -0.6504 | 0.519076 | 0.259538 |
| M9 | -0.0389194261214411 | 0.058203 | -0.6687 | 0.507445 | 0.253723 |
| M10 | -0.0459060463579918 | 0.058888 | -0.7796 | 0.440132 | 0.220066 |
| M11 | -0.0156144435369607 | 0.05642 | -0.2768 | 0.78336 | 0.39168 |
| Multiple Linear Regression - Regression Statistics | |
| Multiple R | 0.472525101596154 |
| R-squared | 0.223279971638456 |
| Adjusted R-squared | -0.00405271958931319 |
| F-TEST (value) | 0.98217273737699 |
| F-TEST (DF numerator) | 12 |
| F-TEST (DF denominator) | 41 |
| p-value | 0.48127171157826 |
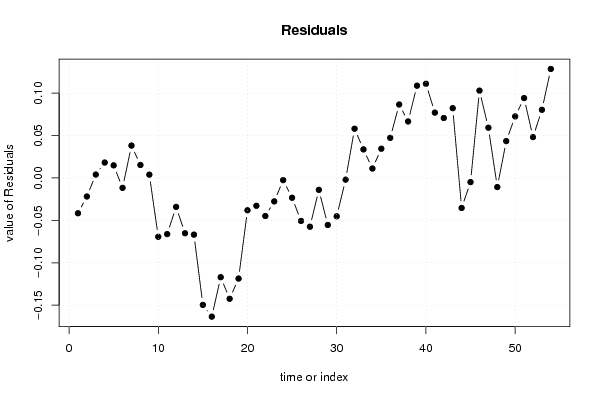
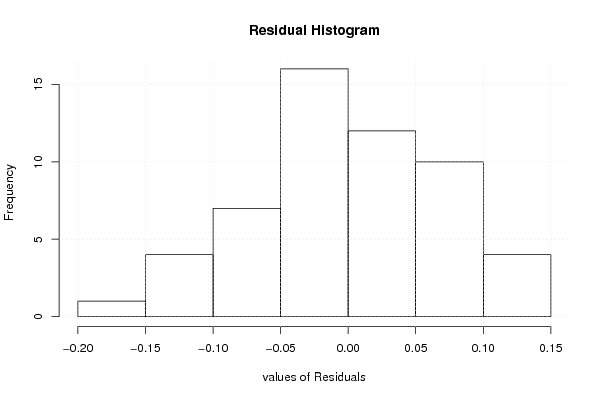
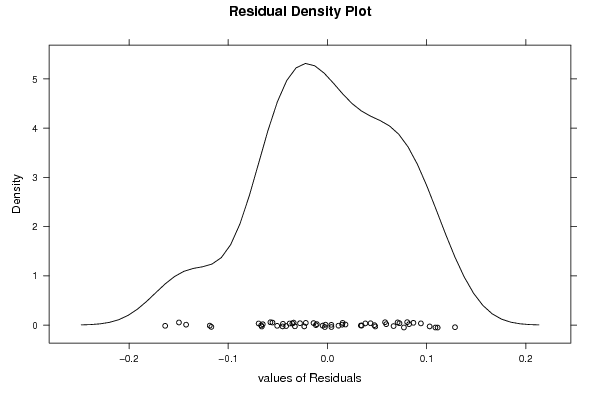
| Multiple Linear Regression - Residual Statistics | |
| Residual Standard Deviation | 0.0791341574222953 |
| Sum Squared Residuals | 0.256750809708401 |
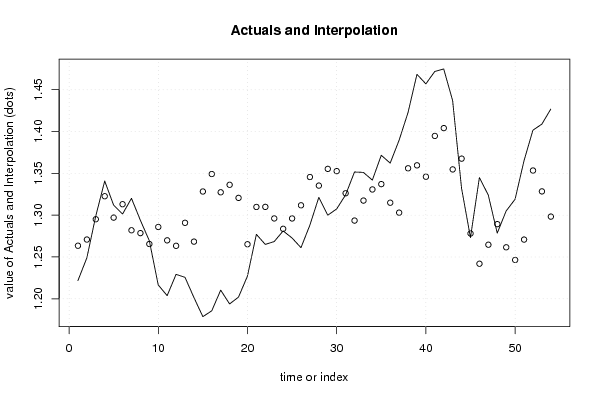
| Multiple Linear Regression - Actuals, Interpolation, and Residuals | |||
| Time or Index | Actuals | Interpolation Forecast | Residuals Prediction Error |
| 1 | 1.2218 | 1.26340059838643 | -0.0416005983864301 |
| 2 | 1.249 | 1.27081418368809 | -0.0218141836880902 |
| 3 | 1.2991 | 1.29507763863853 | 0.00402236136146588 |
| 4 | 1.3408 | 1.32259851027832 | 0.0182014897216845 |
| 5 | 1.3119 | 1.29701480553413 | 0.0148851944658712 |
| 6 | 1.3014 | 1.31305045218291 | -0.0116504521829146 |
| 7 | 1.3201 | 1.28188132128316 | 0.0382186787168384 |
| 8 | 1.2938 | 1.27847209514543 | 0.0153279048545709 |
| 9 | 1.2694 | 1.26546827598982 | 0.00393172401018444 |
| 10 | 1.2165 | 1.28584635621298 | -0.0693463562129846 |
| 11 | 1.2037 | 1.26986973700917 | -0.0661697370091729 |
| 12 | 1.2292 | 1.26329792823092 | -0.0340979282309227 |
| 13 | 1.2256 | 1.29080106709888 | -0.065201067098879 |
| 14 | 1.2015 | 1.26832034162310 | -0.0668203416231023 |
| 15 | 1.1786 | 1.32825666729121 | -0.149656667291205 |
| 16 | 1.1856 | 1.34914451517566 | -0.163544515175664 |
| 17 | 1.2103 | 1.32730455421669 | -0.117004554216687 |
| 18 | 1.1938 | 1.33626404820139 | -0.142464048201391 |
| 19 | 1.202 | 1.3206084033585 | -0.118608403358499 |
| 20 | 1.2271 | 1.26518418925812 | -0.0380841892581193 |
| 21 | 1.277 | 1.30978315399085 | -0.0327831539908471 |
| 22 | 1.265 | 1.30986871216807 | -0.0448687121680749 |
| 23 | 1.2684 | 1.29603620100261 | -0.0276362010026074 |
| 24 | 1.2811 | 1.2836421155308 | -0.00254211553079997 |
| 25 | 1.2727 | 1.29601727062126 | -0.023317270621264 |
| 26 | 1.2611 | 1.31175094893177 | -0.0506509489317674 |
| 27 | 1.2881 | 1.34556651448492 | -0.0574665144849179 |
| 28 | 1.3213 | 1.33529623999566 | -0.0139962399956642 |
| 29 | 1.2999 | 1.35529718622424 | -0.0553971862242437 |
| 30 | 1.3074 | 1.35260417832123 | -0.0452041783212281 |
| 31 | 1.3242 | 1.32613658552965 | -0.00193658552965142 |
| 32 | 1.3516 | 1.29349277416475 | 0.0581072258352534 |
| 33 | 1.3511 | 1.31740576607156 | 0.033694233928441 |
| 34 | 1.3419 | 1.33071365500610 | 0.0111863449938992 |
| 35 | 1.3716 | 1.33707629675416 | 0.0345237032458432 |
| 36 | 1.3622 | 1.31483998040754 | 0.0473600195924595 |
| 37 | 1.3896 | 1.30295233739960 | 0.0866476626004032 |
| 38 | 1.4227 | 1.35602211017947 | 0.0666778898205315 |
| 39 | 1.4684 | 1.35953799142430 | 0.108862008575696 |
| 40 | 1.457 | 1.34590748830406 | 0.111092511695941 |
| 41 | 1.4718 | 1.39468796810014 | 0.0771120318998562 |
| 42 | 1.4748 | 1.40407071974209 | 0.0707292802579069 |
| 43 | 1.437 | 1.35467368982869 | 0.0823263101713121 |
| 44 | 1.3322 | 1.36755094143171 | -0.035350941431705 |
| 45 | 1.2732 | 1.27804280394778 | -0.00484280394777827 |
| 46 | 1.3449 | 1.24187127661284 | 0.103028723387160 |
| 47 | 1.3239 | 1.26461776523406 | 0.0592822347659371 |
| 48 | 1.2785 | 1.28921997583074 | -0.0107199758307369 |
| 49 | 1.305 | 1.26152872649383 | 0.0434712735061698 |
| 50 | 1.319 | 1.24639241557757 | 0.0726075844224284 |
| 51 | 1.365 | 1.27076118816104 | 0.0942388118389612 |
| 52 | 1.4016 | 1.35335324624630 | 0.0482467537537027 |
| 53 | 1.4088 | 1.32839548592480 | 0.080404514075203 |
| 54 | 1.4268 | 1.29821060155237 | 0.128589398447627 |
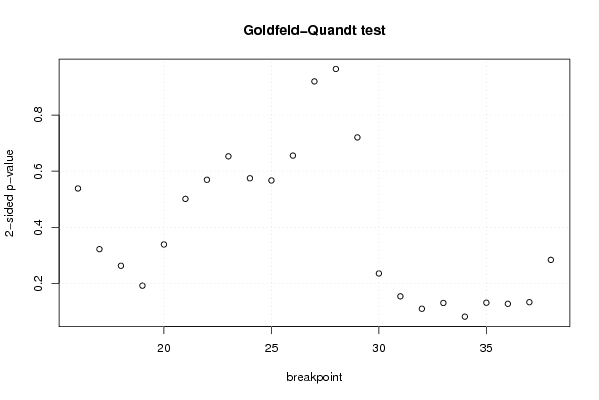
| Goldfeld-Quandt test for Heteroskedasticity | |||
| p-values | Alternative Hypothesis | ||
| breakpoint index | greater | 2-sided | less |
| 16 | 0.269195697074848 | 0.538391394149696 | 0.730804302925152 |
| 17 | 0.160905952853980 | 0.321811905707959 | 0.83909404714602 |
| 18 | 0.131334507196459 | 0.262669014392918 | 0.86866549280354 |
| 19 | 0.0958009791514056 | 0.191601958302811 | 0.904199020848594 |
| 20 | 0.169314141351803 | 0.338628282703607 | 0.830685858648197 |
| 21 | 0.250636497009908 | 0.501272994019816 | 0.749363502990092 |
| 22 | 0.284674260570710 | 0.569348521141419 | 0.71532573942929 |
| 23 | 0.326504718608931 | 0.653009437217861 | 0.67349528139107 |
| 24 | 0.287356282389451 | 0.574712564778903 | 0.712643717610549 |
| 25 | 0.283465194589195 | 0.56693038917839 | 0.716534805410805 |
| 26 | 0.327799092047586 | 0.655598184095172 | 0.672200907952414 |
| 27 | 0.460098698656640 | 0.920197397313279 | 0.53990130134336 |
| 28 | 0.482319397964011 | 0.964638795928023 | 0.517680602035989 |
| 29 | 0.639774860492202 | 0.720450279015595 | 0.360225139507797 |
| 30 | 0.882348232882573 | 0.235303534234853 | 0.117651767117427 |
| 31 | 0.923187585753263 | 0.153624828493475 | 0.0768124142467374 |
| 32 | 0.945314394976446 | 0.109371210047109 | 0.0546856050235543 |
| 33 | 0.934999090540105 | 0.130001818919791 | 0.0650009094598955 |
| 34 | 0.959414510633047 | 0.0811709787339058 | 0.0405854893669529 |
| 35 | 0.93458378903104 | 0.130832421937919 | 0.0654162109689593 |
| 36 | 0.936522027138534 | 0.126955945722932 | 0.063477972861466 |
| 37 | 0.93361910330927 | 0.13276179338146 | 0.06638089669073 |
| 38 | 0.858159719819853 | 0.283680560360295 | 0.141840280180147 |
| Meta Analysis of Goldfeld-Quandt test for Heteroskedasticity | |||
| Description | # significant tests | % significant tests | OK/NOK |
| 1% type I error level | 0 | 0 | OK |
| 5% type I error level | 0 | 0 | OK |
| 10% type I error level | 1 | 0.0434782608695652 | OK |