Free Statistics

of Irreproducible Research!

Author's title

Author*The author of this computation has been verified*
R Software Modulerwasp_multipleregression.wasp
Title produced by softwareMultiple Regression
Date of computationSun, 22 Nov 2009 12:23:46 -0700
Cite this page as followsStatistical Computations at FreeStatistics.org, Office for Research Development and Education, URL https://freestatistics.org/blog/index.php?v=date/2009/Nov/22/t1258917879pt25dq99subbrnd.htm/, Retrieved Sat, 27 Apr 2024 22:45:37 +0000
Statistical Computations at FreeStatistics.org, Office for Research Development and Education, URL https://freestatistics.org/blog/index.php?pk=58682, Retrieved Sat, 27 Apr 2024 22:45:37 +0000
QR Codes:

Original text written by user:
IsPrivate?No (this computation is public)
User-defined keywords
Estimated Impact136
Family? (F = Feedback message, R = changed R code, M = changed R Module, P = changed Parameters, D = changed Data)
-       [Multiple Regression] [Derde verfijning] [2009-11-22 19:23:46] [4c76f32a7a0cc9034048c3cdcdaf547e] [Current]
Feedback Forum

Post a new message
Dataseries X:
17823.2 1.2218 
17872 1.249 
17420.4 1.2991 
16704.4 1.3408 
15991.2 1.3119 
16583.6 1.3014 
19123.5 1.3201 
17838.7 1.2938 
17209.4 1.2694 
18586.5 1.2165 
16258.1 1.2037 
15141.6 1.2292 
19202.1 1.2256 
17746.5 1.2015 
19090.1 1.1786 
18040.3 1.1856 
17515.5 1.2103 
17751.8 1.1938 
21072.4 1.202 
17170 1.2271 
19439.5 1.277 
19795.4 1.265 
17574.9 1.2684 
16165.4 1.2811 
19464.6 1.2727 
19932.1 1.2611 
19961.2 1.2881 
17343.4 1.3213 
18924.2 1.2999 
18574.1 1.3074 
21350.6 1.3242 
18594.6 1.3516 
19823.1 1.3511 
20844.4 1.3419 
19640.2 1.3716 
17735.4 1.3622 
19813.6 1.3896 
22160 1.4227 
20664.3 1.4684 
17877.4 1.457 
20906.5 1.4718 
21164.1 1.4748 
22786.7 1.437 
22321.5 1.3322 
17842.2 1.2732 
16373.5 1.3449 
15993.8 1.3239 
16446.1 1.2785 
17729 1.305 
16643 1.319 
16196.7 1.365 
18252.1 1.4016 
17570.4 1.4088 
15836.8 1.4268


Summary of computational transaction
Raw Inputview raw input (R code)
Raw Outputview raw output of R engine
Computing time4 seconds
R Server'Gwilym Jenkins' @ 72.249.127.135

\begin{tabular}{lllllllll}
\hline
Summary of computational transaction \tabularnewline
Raw Input & view raw input (R code)  \tabularnewline
Raw Output & view raw output of R engine  \tabularnewline
Computing time & 4 seconds \tabularnewline
R Server & 'Gwilym Jenkins' @ 72.249.127.135 \tabularnewline
\hline
\end{tabular}
%Source: https://freestatistics.org/blog/index.php?pk=58682&T=0

[TABLE]
[ROW][C]Summary of computational transaction[/C][/ROW]
[ROW][C]Raw Input[/C][C]view raw input (R code) [/C][/ROW]
[ROW][C]Raw Output[/C][C]view raw output of R engine [/C][/ROW]
[ROW][C]Computing time[/C][C]4 seconds[/C][/ROW]
[ROW][C]R Server[/C][C]'Gwilym Jenkins' @ 72.249.127.135[/C][/ROW]
[/TABLE]
Source: https://freestatistics.org/blog/index.php?pk=58682&T=0

Globally Unique Identifier (entire table): ba.freestatistics.org/blog/index.php?pk=58682&T=0

As an alternative you can also use a QR Code:  

The GUIDs for individual cells are displayed in the table below:

Summary of computational transaction
Raw Inputview raw input (R code)
Raw Outputview raw output of R engine
Computing time4 seconds
R Server'Gwilym Jenkins' @ 72.249.127.135


Multiple Linear Regression - Estimated Regression Equation
EUDO[t] = + 0.962415386308849 + 1.98712515138476e-05UITV[t] -0.0531840779040217M1[t] -0.0467402096762419M2[t] -0.0135028975421446M3[t] + 0.0282457901815517M4[t] + 0.0168342620170412M5[t] + 0.0210981792690236M6[t] -0.0605419433507508M7[t] -0.0384205855434918M8[t] -0.0389194261214411M9[t] -0.0459060463579918M10[t] -0.0156144435369607M11[t] + e[t]

\begin{tabular}{lllllllll}
\hline
Multiple Linear Regression - Estimated Regression Equation \tabularnewline
EUDO[t] =  +  0.962415386308849 +  1.98712515138476e-05UITV[t] -0.0531840779040217M1[t] -0.0467402096762419M2[t] -0.0135028975421446M3[t] +  0.0282457901815517M4[t] +  0.0168342620170412M5[t] +  0.0210981792690236M6[t] -0.0605419433507508M7[t] -0.0384205855434918M8[t] -0.0389194261214411M9[t] -0.0459060463579918M10[t] -0.0156144435369607M11[t]  + e[t] \tabularnewline
\hline
\end{tabular}
%Source: https://freestatistics.org/blog/index.php?pk=58682&T=1

[TABLE]
[ROW][C]Multiple Linear Regression - Estimated Regression Equation[/C][/ROW]
[ROW][C]EUDO[t] =  +  0.962415386308849 +  1.98712515138476e-05UITV[t] -0.0531840779040217M1[t] -0.0467402096762419M2[t] -0.0135028975421446M3[t] +  0.0282457901815517M4[t] +  0.0168342620170412M5[t] +  0.0210981792690236M6[t] -0.0605419433507508M7[t] -0.0384205855434918M8[t] -0.0389194261214411M9[t] -0.0459060463579918M10[t] -0.0156144435369607M11[t]  + e[t][/C][/ROW]
[/TABLE]
Source: https://freestatistics.org/blog/index.php?pk=58682&T=1

Globally Unique Identifier (entire table): ba.freestatistics.org/blog/index.php?pk=58682&T=1

As an alternative you can also use a QR Code:  

The GUIDs for individual cells are displayed in the table below:

Multiple Linear Regression - Estimated Regression Equation
EUDO[t] = + 0.962415386308849 + 1.98712515138476e-05UITV[t] -0.0531840779040217M1[t] -0.0467402096762419M2[t] -0.0135028975421446M3[t] + 0.0282457901815517M4[t] + 0.0168342620170412M5[t] + 0.0210981792690236M6[t] -0.0605419433507508M7[t] -0.0384205855434918M8[t] -0.0389194261214411M9[t] -0.0459060463579918M10[t] -0.0156144435369607M11[t] + e[t]


Multiple Linear Regression - Ordinary Least Squares
VariableParameterS.D.T-STATH0: parameter = 02-tail p-value1-tail p-value
(Intercept)0.9624153863088490.1252517.683900
UITV1.98712515138476e-057e-062.73760.0091110.004556
M1-0.05318407790402170.055948-0.95060.3473820.173691
M2-0.04674020967624190.056097-0.83320.4095610.20478
M3-0.01350289754214460.055636-0.24270.8094470.404724
M40.02824579018155170.0538810.52420.6029440.301472
M50.01683426201704120.0546850.30780.7597640.379882
M60.02109817926902360.0543560.38810.6999140.349957
M7-0.06054194335075080.065578-0.92320.3613030.180651
M8-0.03842058554349180.059074-0.65040.5190760.259538
M9-0.03891942612144110.058203-0.66870.5074450.253723
M10-0.04590604635799180.058888-0.77960.4401320.220066
M11-0.01561444353696070.05642-0.27680.783360.39168

\begin{tabular}{lllllllll}
\hline
Multiple Linear Regression - Ordinary Least Squares \tabularnewline
Variable & Parameter & S.D. & T-STATH0: parameter = 0 & 2-tail p-value & 1-tail p-value \tabularnewline
(Intercept) & 0.962415386308849 & 0.125251 & 7.6839 & 0 & 0 \tabularnewline
UITV & 1.98712515138476e-05 & 7e-06 & 2.7376 & 0.009111 & 0.004556 \tabularnewline
M1 & -0.0531840779040217 & 0.055948 & -0.9506 & 0.347382 & 0.173691 \tabularnewline
M2 & -0.0467402096762419 & 0.056097 & -0.8332 & 0.409561 & 0.20478 \tabularnewline
M3 & -0.0135028975421446 & 0.055636 & -0.2427 & 0.809447 & 0.404724 \tabularnewline
M4 & 0.0282457901815517 & 0.053881 & 0.5242 & 0.602944 & 0.301472 \tabularnewline
M5 & 0.0168342620170412 & 0.054685 & 0.3078 & 0.759764 & 0.379882 \tabularnewline
M6 & 0.0210981792690236 & 0.054356 & 0.3881 & 0.699914 & 0.349957 \tabularnewline
M7 & -0.0605419433507508 & 0.065578 & -0.9232 & 0.361303 & 0.180651 \tabularnewline
M8 & -0.0384205855434918 & 0.059074 & -0.6504 & 0.519076 & 0.259538 \tabularnewline
M9 & -0.0389194261214411 & 0.058203 & -0.6687 & 0.507445 & 0.253723 \tabularnewline
M10 & -0.0459060463579918 & 0.058888 & -0.7796 & 0.440132 & 0.220066 \tabularnewline
M11 & -0.0156144435369607 & 0.05642 & -0.2768 & 0.78336 & 0.39168 \tabularnewline
\hline
\end{tabular}
%Source: https://freestatistics.org/blog/index.php?pk=58682&T=2

[TABLE]
[ROW][C]Multiple Linear Regression - Ordinary Least Squares[/C][/ROW]
[ROW][C]Variable[/C][C]Parameter[/C][C]S.D.[/C][C]T-STATH0: parameter = 0[/C][C]2-tail p-value[/C][C]1-tail p-value[/C][/ROW]
[ROW][C](Intercept)[/C][C]0.962415386308849[/C][C]0.125251[/C][C]7.6839[/C][C]0[/C][C]0[/C][/ROW]
[ROW][C]UITV[/C][C]1.98712515138476e-05[/C][C]7e-06[/C][C]2.7376[/C][C]0.009111[/C][C]0.004556[/C][/ROW]
[ROW][C]M1[/C][C]-0.0531840779040217[/C][C]0.055948[/C][C]-0.9506[/C][C]0.347382[/C][C]0.173691[/C][/ROW]
[ROW][C]M2[/C][C]-0.0467402096762419[/C][C]0.056097[/C][C]-0.8332[/C][C]0.409561[/C][C]0.20478[/C][/ROW]
[ROW][C]M3[/C][C]-0.0135028975421446[/C][C]0.055636[/C][C]-0.2427[/C][C]0.809447[/C][C]0.404724[/C][/ROW]
[ROW][C]M4[/C][C]0.0282457901815517[/C][C]0.053881[/C][C]0.5242[/C][C]0.602944[/C][C]0.301472[/C][/ROW]
[ROW][C]M5[/C][C]0.0168342620170412[/C][C]0.054685[/C][C]0.3078[/C][C]0.759764[/C][C]0.379882[/C][/ROW]
[ROW][C]M6[/C][C]0.0210981792690236[/C][C]0.054356[/C][C]0.3881[/C][C]0.699914[/C][C]0.349957[/C][/ROW]
[ROW][C]M7[/C][C]-0.0605419433507508[/C][C]0.065578[/C][C]-0.9232[/C][C]0.361303[/C][C]0.180651[/C][/ROW]
[ROW][C]M8[/C][C]-0.0384205855434918[/C][C]0.059074[/C][C]-0.6504[/C][C]0.519076[/C][C]0.259538[/C][/ROW]
[ROW][C]M9[/C][C]-0.0389194261214411[/C][C]0.058203[/C][C]-0.6687[/C][C]0.507445[/C][C]0.253723[/C][/ROW]
[ROW][C]M10[/C][C]-0.0459060463579918[/C][C]0.058888[/C][C]-0.7796[/C][C]0.440132[/C][C]0.220066[/C][/ROW]
[ROW][C]M11[/C][C]-0.0156144435369607[/C][C]0.05642[/C][C]-0.2768[/C][C]0.78336[/C][C]0.39168[/C][/ROW]
[/TABLE]
Source: https://freestatistics.org/blog/index.php?pk=58682&T=2

Globally Unique Identifier (entire table): ba.freestatistics.org/blog/index.php?pk=58682&T=2

As an alternative you can also use a QR Code:  

The GUIDs for individual cells are displayed in the table below:

Multiple Linear Regression - Ordinary Least Squares
VariableParameterS.D.T-STATH0: parameter = 02-tail p-value1-tail p-value
(Intercept)0.9624153863088490.1252517.683900
UITV1.98712515138476e-057e-062.73760.0091110.004556
M1-0.05318407790402170.055948-0.95060.3473820.173691
M2-0.04674020967624190.056097-0.83320.4095610.20478
M3-0.01350289754214460.055636-0.24270.8094470.404724
M40.02824579018155170.0538810.52420.6029440.301472
M50.01683426201704120.0546850.30780.7597640.379882
M60.02109817926902360.0543560.38810.6999140.349957
M7-0.06054194335075080.065578-0.92320.3613030.180651
M8-0.03842058554349180.059074-0.65040.5190760.259538
M9-0.03891942612144110.058203-0.66870.5074450.253723
M10-0.04590604635799180.058888-0.77960.4401320.220066
M11-0.01561444353696070.05642-0.27680.783360.39168


Multiple Linear Regression - Regression Statistics
Multiple R0.472525101596154
R-squared0.223279971638456
Adjusted R-squared-0.00405271958931319
F-TEST (value)0.98217273737699
F-TEST (DF numerator)12
F-TEST (DF denominator)41
p-value0.48127171157826
Multiple Linear Regression - Residual Statistics
Residual Standard Deviation0.0791341574222953
Sum Squared Residuals0.256750809708401

\begin{tabular}{lllllllll}
\hline
Multiple Linear Regression - Regression Statistics \tabularnewline
Multiple R & 0.472525101596154 \tabularnewline
R-squared & 0.223279971638456 \tabularnewline
Adjusted R-squared & -0.00405271958931319 \tabularnewline
F-TEST (value) & 0.98217273737699 \tabularnewline
F-TEST (DF numerator) & 12 \tabularnewline
F-TEST (DF denominator) & 41 \tabularnewline
p-value & 0.48127171157826 \tabularnewline
Multiple Linear Regression - Residual Statistics \tabularnewline
Residual Standard Deviation & 0.0791341574222953 \tabularnewline
Sum Squared Residuals & 0.256750809708401 \tabularnewline
\hline
\end{tabular}
%Source: https://freestatistics.org/blog/index.php?pk=58682&T=3

[TABLE]
[ROW][C]Multiple Linear Regression - Regression Statistics[/C][/ROW]
[ROW][C]Multiple R[/C][C]0.472525101596154[/C][/ROW]
[ROW][C]R-squared[/C][C]0.223279971638456[/C][/ROW]
[ROW][C]Adjusted R-squared[/C][C]-0.00405271958931319[/C][/ROW]
[ROW][C]F-TEST (value)[/C][C]0.98217273737699[/C][/ROW]
[ROW][C]F-TEST (DF numerator)[/C][C]12[/C][/ROW]
[ROW][C]F-TEST (DF denominator)[/C][C]41[/C][/ROW]
[ROW][C]p-value[/C][C]0.48127171157826[/C][/ROW]
[ROW][C]Multiple Linear Regression - Residual Statistics[/C][/ROW]
[ROW][C]Residual Standard Deviation[/C][C]0.0791341574222953[/C][/ROW]
[ROW][C]Sum Squared Residuals[/C][C]0.256750809708401[/C][/ROW]
[/TABLE]
Source: https://freestatistics.org/blog/index.php?pk=58682&T=3

Globally Unique Identifier (entire table): ba.freestatistics.org/blog/index.php?pk=58682&T=3

As an alternative you can also use a QR Code:  

The GUIDs for individual cells are displayed in the table below:

Multiple Linear Regression - Regression Statistics
Multiple R0.472525101596154
R-squared0.223279971638456
Adjusted R-squared-0.00405271958931319
F-TEST (value)0.98217273737699
F-TEST (DF numerator)12
F-TEST (DF denominator)41
p-value0.48127171157826
Multiple Linear Regression - Residual Statistics
Residual Standard Deviation0.0791341574222953
Sum Squared Residuals0.256750809708401


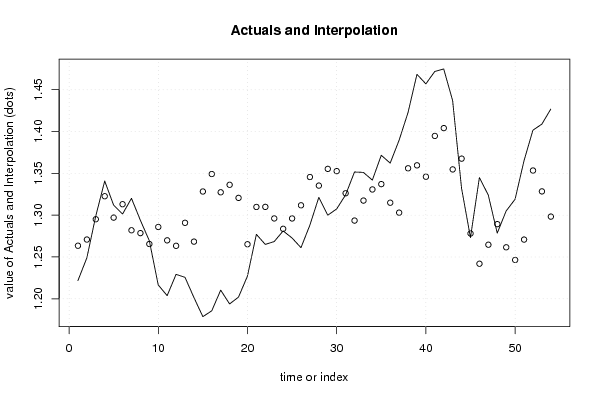
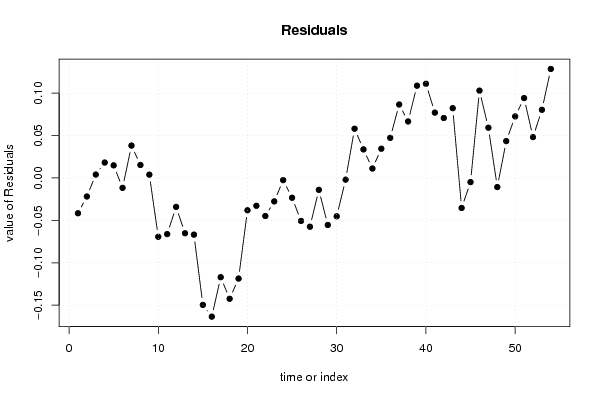
Multiple Linear Regression - Actuals, Interpolation, and Residuals
Time or IndexActualsInterpolationForecastResidualsPrediction Error
11.22181.26340059838643-0.0416005983864301
21.2491.27081418368809-0.0218141836880902
31.29911.295077638638530.00402236136146588
41.34081.322598510278320.0182014897216845
51.31191.297014805534130.0148851944658712
61.30141.31305045218291-0.0116504521829146
71.32011.281881321283160.0382186787168384
81.29381.278472095145430.0153279048545709
91.26941.265468275989820.00393172401018444
101.21651.28584635621298-0.0693463562129846
111.20371.26986973700917-0.0661697370091729
121.22921.26329792823092-0.0340979282309227
131.22561.29080106709888-0.065201067098879
141.20151.26832034162310-0.0668203416231023
151.17861.32825666729121-0.149656667291205
161.18561.34914451517566-0.163544515175664
171.21031.32730455421669-0.117004554216687
181.19381.33626404820139-0.142464048201391
191.2021.3206084033585-0.118608403358499
201.22711.26518418925812-0.0380841892581193
211.2771.30978315399085-0.0327831539908471
221.2651.30986871216807-0.0448687121680749
231.26841.29603620100261-0.0276362010026074
241.28111.2836421155308-0.00254211553079997
251.27271.29601727062126-0.023317270621264
261.26111.31175094893177-0.0506509489317674
271.28811.34556651448492-0.0574665144849179
281.32131.33529623999566-0.0139962399956642
291.29991.35529718622424-0.0553971862242437
301.30741.35260417832123-0.0452041783212281
311.32421.32613658552965-0.00193658552965142
321.35161.293492774164750.0581072258352534
331.35111.317405766071560.033694233928441
341.34191.330713655006100.0111863449938992
351.37161.337076296754160.0345237032458432
361.36221.314839980407540.0473600195924595
371.38961.302952337399600.0866476626004032
381.42271.356022110179470.0666778898205315
391.46841.359537991424300.108862008575696
401.4571.345907488304060.111092511695941
411.47181.394687968100140.0771120318998562
421.47481.404070719742090.0707292802579069
431.4371.354673689828690.0823263101713121
441.33221.36755094143171-0.035350941431705
451.27321.27804280394778-0.00484280394777827
461.34491.241871276612840.103028723387160
471.32391.264617765234060.0592822347659371
481.27851.28921997583074-0.0107199758307369
491.3051.261528726493830.0434712735061698
501.3191.246392415577570.0726075844224284
511.3651.270761188161040.0942388118389612
521.40161.353353246246300.0482467537537027
531.40881.328395485924800.080404514075203
541.42681.298210601552370.128589398447627

\begin{tabular}{lllllllll}
\hline
Multiple Linear Regression - Actuals, Interpolation, and Residuals \tabularnewline
Time or Index & Actuals & InterpolationForecast & ResidualsPrediction Error \tabularnewline
1 & 1.2218 & 1.26340059838643 & -0.0416005983864301 \tabularnewline
2 & 1.249 & 1.27081418368809 & -0.0218141836880902 \tabularnewline
3 & 1.2991 & 1.29507763863853 & 0.00402236136146588 \tabularnewline
4 & 1.3408 & 1.32259851027832 & 0.0182014897216845 \tabularnewline
5 & 1.3119 & 1.29701480553413 & 0.0148851944658712 \tabularnewline
6 & 1.3014 & 1.31305045218291 & -0.0116504521829146 \tabularnewline
7 & 1.3201 & 1.28188132128316 & 0.0382186787168384 \tabularnewline
8 & 1.2938 & 1.27847209514543 & 0.0153279048545709 \tabularnewline
9 & 1.2694 & 1.26546827598982 & 0.00393172401018444 \tabularnewline
10 & 1.2165 & 1.28584635621298 & -0.0693463562129846 \tabularnewline
11 & 1.2037 & 1.26986973700917 & -0.0661697370091729 \tabularnewline
12 & 1.2292 & 1.26329792823092 & -0.0340979282309227 \tabularnewline
13 & 1.2256 & 1.29080106709888 & -0.065201067098879 \tabularnewline
14 & 1.2015 & 1.26832034162310 & -0.0668203416231023 \tabularnewline
15 & 1.1786 & 1.32825666729121 & -0.149656667291205 \tabularnewline
16 & 1.1856 & 1.34914451517566 & -0.163544515175664 \tabularnewline
17 & 1.2103 & 1.32730455421669 & -0.117004554216687 \tabularnewline
18 & 1.1938 & 1.33626404820139 & -0.142464048201391 \tabularnewline
19 & 1.202 & 1.3206084033585 & -0.118608403358499 \tabularnewline
20 & 1.2271 & 1.26518418925812 & -0.0380841892581193 \tabularnewline
21 & 1.277 & 1.30978315399085 & -0.0327831539908471 \tabularnewline
22 & 1.265 & 1.30986871216807 & -0.0448687121680749 \tabularnewline
23 & 1.2684 & 1.29603620100261 & -0.0276362010026074 \tabularnewline
24 & 1.2811 & 1.2836421155308 & -0.00254211553079997 \tabularnewline
25 & 1.2727 & 1.29601727062126 & -0.023317270621264 \tabularnewline
26 & 1.2611 & 1.31175094893177 & -0.0506509489317674 \tabularnewline
27 & 1.2881 & 1.34556651448492 & -0.0574665144849179 \tabularnewline
28 & 1.3213 & 1.33529623999566 & -0.0139962399956642 \tabularnewline
29 & 1.2999 & 1.35529718622424 & -0.0553971862242437 \tabularnewline
30 & 1.3074 & 1.35260417832123 & -0.0452041783212281 \tabularnewline
31 & 1.3242 & 1.32613658552965 & -0.00193658552965142 \tabularnewline
32 & 1.3516 & 1.29349277416475 & 0.0581072258352534 \tabularnewline
33 & 1.3511 & 1.31740576607156 & 0.033694233928441 \tabularnewline
34 & 1.3419 & 1.33071365500610 & 0.0111863449938992 \tabularnewline
35 & 1.3716 & 1.33707629675416 & 0.0345237032458432 \tabularnewline
36 & 1.3622 & 1.31483998040754 & 0.0473600195924595 \tabularnewline
37 & 1.3896 & 1.30295233739960 & 0.0866476626004032 \tabularnewline
38 & 1.4227 & 1.35602211017947 & 0.0666778898205315 \tabularnewline
39 & 1.4684 & 1.35953799142430 & 0.108862008575696 \tabularnewline
40 & 1.457 & 1.34590748830406 & 0.111092511695941 \tabularnewline
41 & 1.4718 & 1.39468796810014 & 0.0771120318998562 \tabularnewline
42 & 1.4748 & 1.40407071974209 & 0.0707292802579069 \tabularnewline
43 & 1.437 & 1.35467368982869 & 0.0823263101713121 \tabularnewline
44 & 1.3322 & 1.36755094143171 & -0.035350941431705 \tabularnewline
45 & 1.2732 & 1.27804280394778 & -0.00484280394777827 \tabularnewline
46 & 1.3449 & 1.24187127661284 & 0.103028723387160 \tabularnewline
47 & 1.3239 & 1.26461776523406 & 0.0592822347659371 \tabularnewline
48 & 1.2785 & 1.28921997583074 & -0.0107199758307369 \tabularnewline
49 & 1.305 & 1.26152872649383 & 0.0434712735061698 \tabularnewline
50 & 1.319 & 1.24639241557757 & 0.0726075844224284 \tabularnewline
51 & 1.365 & 1.27076118816104 & 0.0942388118389612 \tabularnewline
52 & 1.4016 & 1.35335324624630 & 0.0482467537537027 \tabularnewline
53 & 1.4088 & 1.32839548592480 & 0.080404514075203 \tabularnewline
54 & 1.4268 & 1.29821060155237 & 0.128589398447627 \tabularnewline
\hline
\end{tabular}
%Source: https://freestatistics.org/blog/index.php?pk=58682&T=4

[TABLE]
[ROW][C]Multiple Linear Regression - Actuals, Interpolation, and Residuals[/C][/ROW]
[ROW][C]Time or Index[/C][C]Actuals[/C][C]InterpolationForecast[/C][C]ResidualsPrediction Error[/C][/ROW]
[ROW][C]1[/C][C]1.2218[/C][C]1.26340059838643[/C][C]-0.0416005983864301[/C][/ROW]
[ROW][C]2[/C][C]1.249[/C][C]1.27081418368809[/C][C]-0.0218141836880902[/C][/ROW]
[ROW][C]3[/C][C]1.2991[/C][C]1.29507763863853[/C][C]0.00402236136146588[/C][/ROW]
[ROW][C]4[/C][C]1.3408[/C][C]1.32259851027832[/C][C]0.0182014897216845[/C][/ROW]
[ROW][C]5[/C][C]1.3119[/C][C]1.29701480553413[/C][C]0.0148851944658712[/C][/ROW]
[ROW][C]6[/C][C]1.3014[/C][C]1.31305045218291[/C][C]-0.0116504521829146[/C][/ROW]
[ROW][C]7[/C][C]1.3201[/C][C]1.28188132128316[/C][C]0.0382186787168384[/C][/ROW]
[ROW][C]8[/C][C]1.2938[/C][C]1.27847209514543[/C][C]0.0153279048545709[/C][/ROW]
[ROW][C]9[/C][C]1.2694[/C][C]1.26546827598982[/C][C]0.00393172401018444[/C][/ROW]
[ROW][C]10[/C][C]1.2165[/C][C]1.28584635621298[/C][C]-0.0693463562129846[/C][/ROW]
[ROW][C]11[/C][C]1.2037[/C][C]1.26986973700917[/C][C]-0.0661697370091729[/C][/ROW]
[ROW][C]12[/C][C]1.2292[/C][C]1.26329792823092[/C][C]-0.0340979282309227[/C][/ROW]
[ROW][C]13[/C][C]1.2256[/C][C]1.29080106709888[/C][C]-0.065201067098879[/C][/ROW]
[ROW][C]14[/C][C]1.2015[/C][C]1.26832034162310[/C][C]-0.0668203416231023[/C][/ROW]
[ROW][C]15[/C][C]1.1786[/C][C]1.32825666729121[/C][C]-0.149656667291205[/C][/ROW]
[ROW][C]16[/C][C]1.1856[/C][C]1.34914451517566[/C][C]-0.163544515175664[/C][/ROW]
[ROW][C]17[/C][C]1.2103[/C][C]1.32730455421669[/C][C]-0.117004554216687[/C][/ROW]
[ROW][C]18[/C][C]1.1938[/C][C]1.33626404820139[/C][C]-0.142464048201391[/C][/ROW]
[ROW][C]19[/C][C]1.202[/C][C]1.3206084033585[/C][C]-0.118608403358499[/C][/ROW]
[ROW][C]20[/C][C]1.2271[/C][C]1.26518418925812[/C][C]-0.0380841892581193[/C][/ROW]
[ROW][C]21[/C][C]1.277[/C][C]1.30978315399085[/C][C]-0.0327831539908471[/C][/ROW]
[ROW][C]22[/C][C]1.265[/C][C]1.30986871216807[/C][C]-0.0448687121680749[/C][/ROW]
[ROW][C]23[/C][C]1.2684[/C][C]1.29603620100261[/C][C]-0.0276362010026074[/C][/ROW]
[ROW][C]24[/C][C]1.2811[/C][C]1.2836421155308[/C][C]-0.00254211553079997[/C][/ROW]
[ROW][C]25[/C][C]1.2727[/C][C]1.29601727062126[/C][C]-0.023317270621264[/C][/ROW]
[ROW][C]26[/C][C]1.2611[/C][C]1.31175094893177[/C][C]-0.0506509489317674[/C][/ROW]
[ROW][C]27[/C][C]1.2881[/C][C]1.34556651448492[/C][C]-0.0574665144849179[/C][/ROW]
[ROW][C]28[/C][C]1.3213[/C][C]1.33529623999566[/C][C]-0.0139962399956642[/C][/ROW]
[ROW][C]29[/C][C]1.2999[/C][C]1.35529718622424[/C][C]-0.0553971862242437[/C][/ROW]
[ROW][C]30[/C][C]1.3074[/C][C]1.35260417832123[/C][C]-0.0452041783212281[/C][/ROW]
[ROW][C]31[/C][C]1.3242[/C][C]1.32613658552965[/C][C]-0.00193658552965142[/C][/ROW]
[ROW][C]32[/C][C]1.3516[/C][C]1.29349277416475[/C][C]0.0581072258352534[/C][/ROW]
[ROW][C]33[/C][C]1.3511[/C][C]1.31740576607156[/C][C]0.033694233928441[/C][/ROW]
[ROW][C]34[/C][C]1.3419[/C][C]1.33071365500610[/C][C]0.0111863449938992[/C][/ROW]
[ROW][C]35[/C][C]1.3716[/C][C]1.33707629675416[/C][C]0.0345237032458432[/C][/ROW]
[ROW][C]36[/C][C]1.3622[/C][C]1.31483998040754[/C][C]0.0473600195924595[/C][/ROW]
[ROW][C]37[/C][C]1.3896[/C][C]1.30295233739960[/C][C]0.0866476626004032[/C][/ROW]
[ROW][C]38[/C][C]1.4227[/C][C]1.35602211017947[/C][C]0.0666778898205315[/C][/ROW]
[ROW][C]39[/C][C]1.4684[/C][C]1.35953799142430[/C][C]0.108862008575696[/C][/ROW]
[ROW][C]40[/C][C]1.457[/C][C]1.34590748830406[/C][C]0.111092511695941[/C][/ROW]
[ROW][C]41[/C][C]1.4718[/C][C]1.39468796810014[/C][C]0.0771120318998562[/C][/ROW]
[ROW][C]42[/C][C]1.4748[/C][C]1.40407071974209[/C][C]0.0707292802579069[/C][/ROW]
[ROW][C]43[/C][C]1.437[/C][C]1.35467368982869[/C][C]0.0823263101713121[/C][/ROW]
[ROW][C]44[/C][C]1.3322[/C][C]1.36755094143171[/C][C]-0.035350941431705[/C][/ROW]
[ROW][C]45[/C][C]1.2732[/C][C]1.27804280394778[/C][C]-0.00484280394777827[/C][/ROW]
[ROW][C]46[/C][C]1.3449[/C][C]1.24187127661284[/C][C]0.103028723387160[/C][/ROW]
[ROW][C]47[/C][C]1.3239[/C][C]1.26461776523406[/C][C]0.0592822347659371[/C][/ROW]
[ROW][C]48[/C][C]1.2785[/C][C]1.28921997583074[/C][C]-0.0107199758307369[/C][/ROW]
[ROW][C]49[/C][C]1.305[/C][C]1.26152872649383[/C][C]0.0434712735061698[/C][/ROW]
[ROW][C]50[/C][C]1.319[/C][C]1.24639241557757[/C][C]0.0726075844224284[/C][/ROW]
[ROW][C]51[/C][C]1.365[/C][C]1.27076118816104[/C][C]0.0942388118389612[/C][/ROW]
[ROW][C]52[/C][C]1.4016[/C][C]1.35335324624630[/C][C]0.0482467537537027[/C][/ROW]
[ROW][C]53[/C][C]1.4088[/C][C]1.32839548592480[/C][C]0.080404514075203[/C][/ROW]
[ROW][C]54[/C][C]1.4268[/C][C]1.29821060155237[/C][C]0.128589398447627[/C][/ROW]
[/TABLE]
Source: https://freestatistics.org/blog/index.php?pk=58682&T=4

Globally Unique Identifier (entire table): ba.freestatistics.org/blog/index.php?pk=58682&T=4

As an alternative you can also use a QR Code:  

The GUIDs for individual cells are displayed in the table below:

Multiple Linear Regression - Actuals, Interpolation, and Residuals
Time or IndexActualsInterpolationForecastResidualsPrediction Error
11.22181.26340059838643-0.0416005983864301
21.2491.27081418368809-0.0218141836880902
31.29911.295077638638530.00402236136146588
41.34081.322598510278320.0182014897216845
51.31191.297014805534130.0148851944658712
61.30141.31305045218291-0.0116504521829146
71.32011.281881321283160.0382186787168384
81.29381.278472095145430.0153279048545709
91.26941.265468275989820.00393172401018444
101.21651.28584635621298-0.0693463562129846
111.20371.26986973700917-0.0661697370091729
121.22921.26329792823092-0.0340979282309227
131.22561.29080106709888-0.065201067098879
141.20151.26832034162310-0.0668203416231023
151.17861.32825666729121-0.149656667291205
161.18561.34914451517566-0.163544515175664
171.21031.32730455421669-0.117004554216687
181.19381.33626404820139-0.142464048201391
191.2021.3206084033585-0.118608403358499
201.22711.26518418925812-0.0380841892581193
211.2771.30978315399085-0.0327831539908471
221.2651.30986871216807-0.0448687121680749
231.26841.29603620100261-0.0276362010026074
241.28111.2836421155308-0.00254211553079997
251.27271.29601727062126-0.023317270621264
261.26111.31175094893177-0.0506509489317674
271.28811.34556651448492-0.0574665144849179
281.32131.33529623999566-0.0139962399956642
291.29991.35529718622424-0.0553971862242437
301.30741.35260417832123-0.0452041783212281
311.32421.32613658552965-0.00193658552965142
321.35161.293492774164750.0581072258352534
331.35111.317405766071560.033694233928441
341.34191.330713655006100.0111863449938992
351.37161.337076296754160.0345237032458432
361.36221.314839980407540.0473600195924595
371.38961.302952337399600.0866476626004032
381.42271.356022110179470.0666778898205315
391.46841.359537991424300.108862008575696
401.4571.345907488304060.111092511695941
411.47181.394687968100140.0771120318998562
421.47481.404070719742090.0707292802579069
431.4371.354673689828690.0823263101713121
441.33221.36755094143171-0.035350941431705
451.27321.27804280394778-0.00484280394777827
461.34491.241871276612840.103028723387160
471.32391.264617765234060.0592822347659371
481.27851.28921997583074-0.0107199758307369
491.3051.261528726493830.0434712735061698
501.3191.246392415577570.0726075844224284
511.3651.270761188161040.0942388118389612
521.40161.353353246246300.0482467537537027
531.40881.328395485924800.080404514075203
541.42681.298210601552370.128589398447627


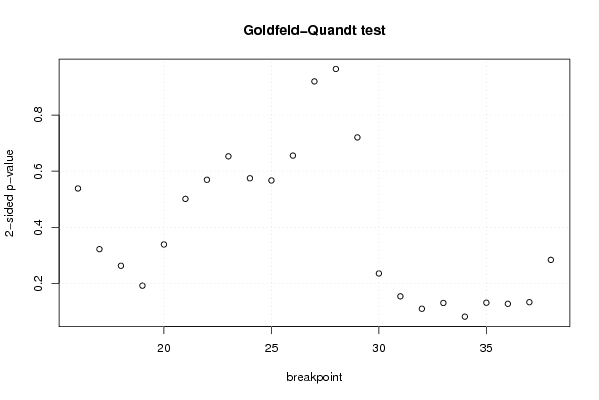
Goldfeld-Quandt test for Heteroskedasticity
p-valuesAlternative Hypothesis
breakpoint indexgreater2-sidedless
160.2691956970748480.5383913941496960.730804302925152
170.1609059528539800.3218119057079590.83909404714602
180.1313345071964590.2626690143929180.86866549280354
190.09580097915140560.1916019583028110.904199020848594
200.1693141413518030.3386282827036070.830685858648197
210.2506364970099080.5012729940198160.749363502990092
220.2846742605707100.5693485211414190.71532573942929
230.3265047186089310.6530094372178610.67349528139107
240.2873562823894510.5747125647789030.712643717610549
250.2834651945891950.566930389178390.716534805410805
260.3277990920475860.6555981840951720.672200907952414
270.4600986986566400.9201973973132790.53990130134336
280.4823193979640110.9646387959280230.517680602035989
290.6397748604922020.7204502790155950.360225139507797
300.8823482328825730.2353035342348530.117651767117427
310.9231875857532630.1536248284934750.0768124142467374
320.9453143949764460.1093712100471090.0546856050235543
330.9349990905401050.1300018189197910.0650009094598955
340.9594145106330470.08117097873390580.0405854893669529
350.934583789031040.1308324219379190.0654162109689593
360.9365220271385340.1269559457229320.063477972861466
370.933619103309270.132761793381460.06638089669073
380.8581597198198530.2836805603602950.141840280180147

\begin{tabular}{lllllllll}
\hline
Goldfeld-Quandt test for Heteroskedasticity \tabularnewline
p-values & Alternative Hypothesis \tabularnewline
breakpoint index & greater & 2-sided & less \tabularnewline
16 & 0.269195697074848 & 0.538391394149696 & 0.730804302925152 \tabularnewline
17 & 0.160905952853980 & 0.321811905707959 & 0.83909404714602 \tabularnewline
18 & 0.131334507196459 & 0.262669014392918 & 0.86866549280354 \tabularnewline
19 & 0.0958009791514056 & 0.191601958302811 & 0.904199020848594 \tabularnewline
20 & 0.169314141351803 & 0.338628282703607 & 0.830685858648197 \tabularnewline
21 & 0.250636497009908 & 0.501272994019816 & 0.749363502990092 \tabularnewline
22 & 0.284674260570710 & 0.569348521141419 & 0.71532573942929 \tabularnewline
23 & 0.326504718608931 & 0.653009437217861 & 0.67349528139107 \tabularnewline
24 & 0.287356282389451 & 0.574712564778903 & 0.712643717610549 \tabularnewline
25 & 0.283465194589195 & 0.56693038917839 & 0.716534805410805 \tabularnewline
26 & 0.327799092047586 & 0.655598184095172 & 0.672200907952414 \tabularnewline
27 & 0.460098698656640 & 0.920197397313279 & 0.53990130134336 \tabularnewline
28 & 0.482319397964011 & 0.964638795928023 & 0.517680602035989 \tabularnewline
29 & 0.639774860492202 & 0.720450279015595 & 0.360225139507797 \tabularnewline
30 & 0.882348232882573 & 0.235303534234853 & 0.117651767117427 \tabularnewline
31 & 0.923187585753263 & 0.153624828493475 & 0.0768124142467374 \tabularnewline
32 & 0.945314394976446 & 0.109371210047109 & 0.0546856050235543 \tabularnewline
33 & 0.934999090540105 & 0.130001818919791 & 0.0650009094598955 \tabularnewline
34 & 0.959414510633047 & 0.0811709787339058 & 0.0405854893669529 \tabularnewline
35 & 0.93458378903104 & 0.130832421937919 & 0.0654162109689593 \tabularnewline
36 & 0.936522027138534 & 0.126955945722932 & 0.063477972861466 \tabularnewline
37 & 0.93361910330927 & 0.13276179338146 & 0.06638089669073 \tabularnewline
38 & 0.858159719819853 & 0.283680560360295 & 0.141840280180147 \tabularnewline
\hline
\end{tabular}
%Source: https://freestatistics.org/blog/index.php?pk=58682&T=5

[TABLE]
[ROW][C]Goldfeld-Quandt test for Heteroskedasticity[/C][/ROW]
[ROW][C]p-values[/C][C]Alternative Hypothesis[/C][/ROW]
[ROW][C]breakpoint index[/C][C]greater[/C][C]2-sided[/C][C]less[/C][/ROW]
[ROW][C]16[/C][C]0.269195697074848[/C][C]0.538391394149696[/C][C]0.730804302925152[/C][/ROW]
[ROW][C]17[/C][C]0.160905952853980[/C][C]0.321811905707959[/C][C]0.83909404714602[/C][/ROW]
[ROW][C]18[/C][C]0.131334507196459[/C][C]0.262669014392918[/C][C]0.86866549280354[/C][/ROW]
[ROW][C]19[/C][C]0.0958009791514056[/C][C]0.191601958302811[/C][C]0.904199020848594[/C][/ROW]
[ROW][C]20[/C][C]0.169314141351803[/C][C]0.338628282703607[/C][C]0.830685858648197[/C][/ROW]
[ROW][C]21[/C][C]0.250636497009908[/C][C]0.501272994019816[/C][C]0.749363502990092[/C][/ROW]
[ROW][C]22[/C][C]0.284674260570710[/C][C]0.569348521141419[/C][C]0.71532573942929[/C][/ROW]
[ROW][C]23[/C][C]0.326504718608931[/C][C]0.653009437217861[/C][C]0.67349528139107[/C][/ROW]
[ROW][C]24[/C][C]0.287356282389451[/C][C]0.574712564778903[/C][C]0.712643717610549[/C][/ROW]
[ROW][C]25[/C][C]0.283465194589195[/C][C]0.56693038917839[/C][C]0.716534805410805[/C][/ROW]
[ROW][C]26[/C][C]0.327799092047586[/C][C]0.655598184095172[/C][C]0.672200907952414[/C][/ROW]
[ROW][C]27[/C][C]0.460098698656640[/C][C]0.920197397313279[/C][C]0.53990130134336[/C][/ROW]
[ROW][C]28[/C][C]0.482319397964011[/C][C]0.964638795928023[/C][C]0.517680602035989[/C][/ROW]
[ROW][C]29[/C][C]0.639774860492202[/C][C]0.720450279015595[/C][C]0.360225139507797[/C][/ROW]
[ROW][C]30[/C][C]0.882348232882573[/C][C]0.235303534234853[/C][C]0.117651767117427[/C][/ROW]
[ROW][C]31[/C][C]0.923187585753263[/C][C]0.153624828493475[/C][C]0.0768124142467374[/C][/ROW]
[ROW][C]32[/C][C]0.945314394976446[/C][C]0.109371210047109[/C][C]0.0546856050235543[/C][/ROW]
[ROW][C]33[/C][C]0.934999090540105[/C][C]0.130001818919791[/C][C]0.0650009094598955[/C][/ROW]
[ROW][C]34[/C][C]0.959414510633047[/C][C]0.0811709787339058[/C][C]0.0405854893669529[/C][/ROW]
[ROW][C]35[/C][C]0.93458378903104[/C][C]0.130832421937919[/C][C]0.0654162109689593[/C][/ROW]
[ROW][C]36[/C][C]0.936522027138534[/C][C]0.126955945722932[/C][C]0.063477972861466[/C][/ROW]
[ROW][C]37[/C][C]0.93361910330927[/C][C]0.13276179338146[/C][C]0.06638089669073[/C][/ROW]
[ROW][C]38[/C][C]0.858159719819853[/C][C]0.283680560360295[/C][C]0.141840280180147[/C][/ROW]
[/TABLE]
Source: https://freestatistics.org/blog/index.php?pk=58682&T=5

Globally Unique Identifier (entire table): ba.freestatistics.org/blog/index.php?pk=58682&T=5

As an alternative you can also use a QR Code:  

The GUIDs for individual cells are displayed in the table below:

Goldfeld-Quandt test for Heteroskedasticity
p-valuesAlternative Hypothesis
breakpoint indexgreater2-sidedless
160.2691956970748480.5383913941496960.730804302925152
170.1609059528539800.3218119057079590.83909404714602
180.1313345071964590.2626690143929180.86866549280354
190.09580097915140560.1916019583028110.904199020848594
200.1693141413518030.3386282827036070.830685858648197
210.2506364970099080.5012729940198160.749363502990092
220.2846742605707100.5693485211414190.71532573942929
230.3265047186089310.6530094372178610.67349528139107
240.2873562823894510.5747125647789030.712643717610549
250.2834651945891950.566930389178390.716534805410805
260.3277990920475860.6555981840951720.672200907952414
270.4600986986566400.9201973973132790.53990130134336
280.4823193979640110.9646387959280230.517680602035989
290.6397748604922020.7204502790155950.360225139507797
300.8823482328825730.2353035342348530.117651767117427
310.9231875857532630.1536248284934750.0768124142467374
320.9453143949764460.1093712100471090.0546856050235543
330.9349990905401050.1300018189197910.0650009094598955
340.9594145106330470.08117097873390580.0405854893669529
350.934583789031040.1308324219379190.0654162109689593
360.9365220271385340.1269559457229320.063477972861466
370.933619103309270.132761793381460.06638089669073
380.8581597198198530.2836805603602950.141840280180147


Meta Analysis of Goldfeld-Quandt test for Heteroskedasticity
Description# significant tests% significant testsOK/NOK
1% type I error level00OK
5% type I error level00OK
10% type I error level10.0434782608695652OK

\begin{tabular}{lllllllll}
\hline
Meta Analysis of Goldfeld-Quandt test for Heteroskedasticity \tabularnewline
Description & # significant tests & % significant tests & OK/NOK \tabularnewline
1% type I error level & 0 & 0 & OK \tabularnewline
5% type I error level & 0 & 0 & OK \tabularnewline
10% type I error level & 1 & 0.0434782608695652 & OK \tabularnewline
\hline
\end{tabular}
%Source: https://freestatistics.org/blog/index.php?pk=58682&T=6

[TABLE]
[ROW][C]Meta Analysis of Goldfeld-Quandt test for Heteroskedasticity[/C][/ROW]
[ROW][C]Description[/C][C]# significant tests[/C][C]% significant tests[/C][C]OK/NOK[/C][/ROW]
[ROW][C]1% type I error level[/C][C]0[/C][C]0[/C][C]OK[/C][/ROW]
[ROW][C]5% type I error level[/C][C]0[/C][C]0[/C][C]OK[/C][/ROW]
[ROW][C]10% type I error level[/C][C]1[/C][C]0.0434782608695652[/C][C]OK[/C][/ROW]
[/TABLE]
Source: https://freestatistics.org/blog/index.php?pk=58682&T=6

Globally Unique Identifier (entire table): ba.freestatistics.org/blog/index.php?pk=58682&T=6

As an alternative you can also use a QR Code:  

The GUIDs for individual cells are displayed in the table below:

Meta Analysis of Goldfeld-Quandt test for Heteroskedasticity
Description# significant tests% significant testsOK/NOK
1% type I error level00OK
5% type I error level00OK
10% type I error level10.0434782608695652OK


Parameters (Session):
par1 = 2 ; par2 = Include Monthly Dummies ; par3 = No Linear Trend ;
Parameters (R input):
par1 = 2 ; par2 = Include Monthly Dummies ; par3 = No Linear Trend ;
R code (references can be found in the software module):
library(lattice)
library(lmtest)
n25 <- 25 #minimum number of obs. for Goldfeld-Quandt test
par1 <- as.numeric(par1)
x <- t(y)
k <- length(x[1,])
n <- length(x[,1])
x1 <- cbind(x[,par1], x[,1:k!=par1])
mycolnames <- c(colnames(x)[par1], colnames(x)[1:k!=par1])
colnames(x1) <- mycolnames #colnames(x)[par1]
x <- x1
if (par3 == 'First Differences'){
x2 <- array(0, dim=c(n-1,k), dimnames=list(1:(n-1), paste('(1-B)',colnames(x),sep='')))
for (i in 1:n-1) {
for (j in 1:k) {
x2[i,j] <- x[i+1,j] - x[i,j]
}
}
x <- x2
}
if (par2 == 'Include Monthly Dummies'){
x2 <- array(0, dim=c(n,11), dimnames=list(1:n, paste('M', seq(1:11), sep ='')))
for (i in 1:11){
x2[seq(i,n,12),i] <- 1
}
x <- cbind(x, x2)
}
if (par2 == 'Include Quarterly Dummies'){
x2 <- array(0, dim=c(n,3), dimnames=list(1:n, paste('Q', seq(1:3), sep ='')))
for (i in 1:3){
x2[seq(i,n,4),i] <- 1
}
x <- cbind(x, x2)
}
k <- length(x[1,])
if (par3 == 'Linear Trend'){
x <- cbind(x, c(1:n))
colnames(x)[k+1] <- 't'
}
x
k <- length(x[1,])
df <- as.data.frame(x)
(mylm <- lm(df))
(mysum <- summary(mylm))
if (n > n25) {
kp3 <- k + 3
nmkm3 <- n - k - 3
gqarr <- array(NA, dim=c(nmkm3-kp3+1,3))
numgqtests <- 0
numsignificant1 <- 0
numsignificant5 <- 0
numsignificant10 <- 0
for (mypoint in kp3:nmkm3) {
j <- 0
numgqtests <- numgqtests + 1
for (myalt in c('greater', 'two.sided', 'less')) {
j <- j + 1
gqarr[mypoint-kp3+1,j] <- gqtest(mylm, point=mypoint, alternative=myalt)$p.value
}
if (gqarr[mypoint-kp3+1,2] < 0.01) numsignificant1 <- numsignificant1 + 1
if (gqarr[mypoint-kp3+1,2] < 0.05) numsignificant5 <- numsignificant5 + 1
if (gqarr[mypoint-kp3+1,2] < 0.10) numsignificant10 <- numsignificant10 + 1
}
gqarr
}
bitmap(file='test0.png')
plot(x[,1], type='l', main='Actuals and Interpolation', ylab='value of Actuals and Interpolation (dots)', xlab='time or index')
points(x[,1]-mysum$resid)
grid()
dev.off()
bitmap(file='test1.png')
plot(mysum$resid, type='b', pch=19, main='Residuals', ylab='value of Residuals', xlab='time or index')
grid()
dev.off()
bitmap(file='test2.png')
hist(mysum$resid, main='Residual Histogram', xlab='values of Residuals')
grid()
dev.off()
bitmap(file='test3.png')
densityplot(~mysum$resid,col='black',main='Residual Density Plot', xlab='values of Residuals')
dev.off()
bitmap(file='test4.png')
qqnorm(mysum$resid, main='Residual Normal Q-Q Plot')
qqline(mysum$resid)
grid()
dev.off()
(myerror <- as.ts(mysum$resid))
bitmap(file='test5.png')
dum <- cbind(lag(myerror,k=1),myerror)
dum
dum1 <- dum[2:length(myerror),]
dum1
z <- as.data.frame(dum1)
z
plot(z,main=paste('Residual Lag plot, lowess, and regression line'), ylab='values of Residuals', xlab='lagged values of Residuals')
lines(lowess(z))
abline(lm(z))
grid()
dev.off()
bitmap(file='test6.png')
acf(mysum$resid, lag.max=length(mysum$resid)/2, main='Residual Autocorrelation Function')
grid()
dev.off()
bitmap(file='test7.png')
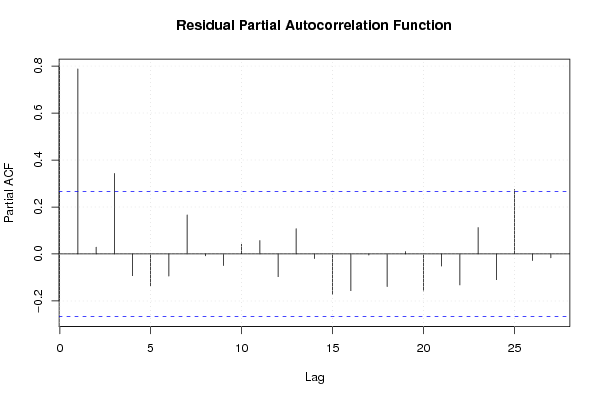
pacf(mysum$resid, lag.max=length(mysum$resid)/2, main='Residual Partial Autocorrelation Function')
grid()
dev.off()
bitmap(file='test8.png')
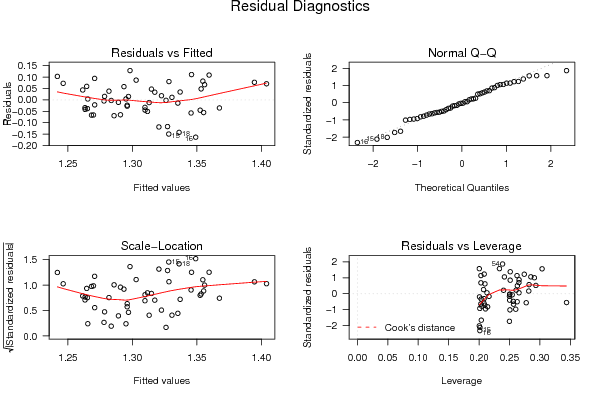
opar <- par(mfrow = c(2,2), oma = c(0, 0, 1.1, 0))
plot(mylm, las = 1, sub='Residual Diagnostics')
par(opar)
dev.off()
if (n > n25) {
bitmap(file='test9.png')
plot(kp3:nmkm3,gqarr[,2], main='Goldfeld-Quandt test',ylab='2-sided p-value',xlab='breakpoint')
grid()
dev.off()
}
load(file='createtable')
a<-table.start()
a<-table.row.start(a)
a<-table.element(a, 'Multiple Linear Regression - Estimated Regression Equation', 1, TRUE)
a<-table.row.end(a)
myeq <- colnames(x)[1]
myeq <- paste(myeq, '[t] = ', sep='')
for (i in 1:k){
if (mysum$coefficients[i,1] > 0) myeq <- paste(myeq, '+', '')
myeq <- paste(myeq, mysum$coefficients[i,1], sep=' ')
if (rownames(mysum$coefficients)[i] != '(Intercept)') {
myeq <- paste(myeq, rownames(mysum$coefficients)[i], sep='')
if (rownames(mysum$coefficients)[i] != 't') myeq <- paste(myeq, '[t]', sep='')
}
}
myeq <- paste(myeq, ' + e[t]')
a<-table.row.start(a)
a<-table.element(a, myeq)
a<-table.row.end(a)
a<-table.end(a)
table.save(a,file='mytable1.tab')
a<-table.start()
a<-table.row.start(a)
a<-table.element(a,hyperlink('ols1.htm','Multiple Linear Regression - Ordinary Least Squares',''), 6, TRUE)
a<-table.row.end(a)
a<-table.row.start(a)
a<-table.element(a,'Variable',header=TRUE)
a<-table.element(a,'Parameter',header=TRUE)
a<-table.element(a,'S.D.',header=TRUE)
a<-table.element(a,'T-STAT
H0: parameter = 0',header=TRUE)
a<-table.element(a,'2-tail p-value',header=TRUE)
a<-table.element(a,'1-tail p-value',header=TRUE)
a<-table.row.end(a)
for (i in 1:k){
a<-table.row.start(a)
a<-table.element(a,rownames(mysum$coefficients)[i],header=TRUE)
a<-table.element(a,mysum$coefficients[i,1])
a<-table.element(a, round(mysum$coefficients[i,2],6))
a<-table.element(a, round(mysum$coefficients[i,3],4))
a<-table.element(a, round(mysum$coefficients[i,4],6))
a<-table.element(a, round(mysum$coefficients[i,4]/2,6))
a<-table.row.end(a)
}
a<-table.end(a)
table.save(a,file='mytable2.tab')
a<-table.start()
a<-table.row.start(a)
a<-table.element(a, 'Multiple Linear Regression - Regression Statistics', 2, TRUE)
a<-table.row.end(a)
a<-table.row.start(a)
a<-table.element(a, 'Multiple R',1,TRUE)
a<-table.element(a, sqrt(mysum$r.squared))
a<-table.row.end(a)
a<-table.row.start(a)
a<-table.element(a, 'R-squared',1,TRUE)
a<-table.element(a, mysum$r.squared)
a<-table.row.end(a)
a<-table.row.start(a)
a<-table.element(a, 'Adjusted R-squared',1,TRUE)
a<-table.element(a, mysum$adj.r.squared)
a<-table.row.end(a)
a<-table.row.start(a)
a<-table.element(a, 'F-TEST (value)',1,TRUE)
a<-table.element(a, mysum$fstatistic[1])
a<-table.row.end(a)
a<-table.row.start(a)
a<-table.element(a, 'F-TEST (DF numerator)',1,TRUE)
a<-table.element(a, mysum$fstatistic[2])
a<-table.row.end(a)
a<-table.row.start(a)
a<-table.element(a, 'F-TEST (DF denominator)',1,TRUE)
a<-table.element(a, mysum$fstatistic[3])
a<-table.row.end(a)
a<-table.row.start(a)
a<-table.element(a, 'p-value',1,TRUE)
a<-table.element(a, 1-pf(mysum$fstatistic[1],mysum$fstatistic[2],mysum$fstatistic[3]))
a<-table.row.end(a)
a<-table.row.start(a)
a<-table.element(a, 'Multiple Linear Regression - Residual Statistics', 2, TRUE)
a<-table.row.end(a)
a<-table.row.start(a)
a<-table.element(a, 'Residual Standard Deviation',1,TRUE)
a<-table.element(a, mysum$sigma)
a<-table.row.end(a)
a<-table.row.start(a)
a<-table.element(a, 'Sum Squared Residuals',1,TRUE)
a<-table.element(a, sum(myerror*myerror))
a<-table.row.end(a)
a<-table.end(a)
table.save(a,file='mytable3.tab')
a<-table.start()
a<-table.row.start(a)
a<-table.element(a, 'Multiple Linear Regression - Actuals, Interpolation, and Residuals', 4, TRUE)
a<-table.row.end(a)
a<-table.row.start(a)
a<-table.element(a, 'Time or Index', 1, TRUE)
a<-table.element(a, 'Actuals', 1, TRUE)
a<-table.element(a, 'Interpolation
Forecast', 1, TRUE)
a<-table.element(a, 'Residuals
Prediction Error', 1, TRUE)
a<-table.row.end(a)
for (i in 1:n) {
a<-table.row.start(a)
a<-table.element(a,i, 1, TRUE)
a<-table.element(a,x[i])
a<-table.element(a,x[i]-mysum$resid[i])
a<-table.element(a,mysum$resid[i])
a<-table.row.end(a)
}
a<-table.end(a)
table.save(a,file='mytable4.tab')
if (n > n25) {
a<-table.start()
a<-table.row.start(a)
a<-table.element(a,'Goldfeld-Quandt test for Heteroskedasticity',4,TRUE)
a<-table.row.end(a)
a<-table.row.start(a)
a<-table.element(a,'p-values',header=TRUE)
a<-table.element(a,'Alternative Hypothesis',3,header=TRUE)
a<-table.row.end(a)
a<-table.row.start(a)
a<-table.element(a,'breakpoint index',header=TRUE)
a<-table.element(a,'greater',header=TRUE)
a<-table.element(a,'2-sided',header=TRUE)
a<-table.element(a,'less',header=TRUE)
a<-table.row.end(a)
for (mypoint in kp3:nmkm3) {
a<-table.row.start(a)
a<-table.element(a,mypoint,header=TRUE)
a<-table.element(a,gqarr[mypoint-kp3+1,1])
a<-table.element(a,gqarr[mypoint-kp3+1,2])
a<-table.element(a,gqarr[mypoint-kp3+1,3])
a<-table.row.end(a)
}
a<-table.end(a)
table.save(a,file='mytable5.tab')
a<-table.start()
a<-table.row.start(a)
a<-table.element(a,'Meta Analysis of Goldfeld-Quandt test for Heteroskedasticity',4,TRUE)
a<-table.row.end(a)
a<-table.row.start(a)
a<-table.element(a,'Description',header=TRUE)
a<-table.element(a,'# significant tests',header=TRUE)
a<-table.element(a,'% significant tests',header=TRUE)
a<-table.element(a,'OK/NOK',header=TRUE)
a<-table.row.end(a)
a<-table.row.start(a)
a<-table.element(a,'1% type I error level',header=TRUE)
a<-table.element(a,numsignificant1)
a<-table.element(a,numsignificant1/numgqtests)
if (numsignificant1/numgqtests < 0.01) dum <- 'OK' else dum <- 'NOK'
a<-table.element(a,dum)
a<-table.row.end(a)
a<-table.row.start(a)
a<-table.element(a,'5% type I error level',header=TRUE)
a<-table.element(a,numsignificant5)
a<-table.element(a,numsignificant5/numgqtests)
if (numsignificant5/numgqtests < 0.05) dum <- 'OK' else dum <- 'NOK'
a<-table.element(a,dum)
a<-table.row.end(a)
a<-table.row.start(a)
a<-table.element(a,'10% type I error level',header=TRUE)
a<-table.element(a,numsignificant10)
a<-table.element(a,numsignificant10/numgqtests)
if (numsignificant10/numgqtests < 0.1) dum <- 'OK' else dum <- 'NOK'
a<-table.element(a,dum)
a<-table.row.end(a)
a<-table.end(a)
table.save(a,file='mytable6.tab')
}