| Multiple Linear Regression - Estimated Regression Equation |
| EUDO[t] = + 0.688170796119973 + 4.03585428287288e-05UITV[t] -0.178658012241435M1[t] -0.202300754539509M2[t] -0.153327146619087M3[t] -0.0551540419778964M4[t] -0.0856662083483208M5[t] -0.107639433978710M6[t] -0.159787456091427M7[t] -0.087122734055486M8[t] -0.0833698761445767M9[t] -0.150402045585577M10[t] -0.076462993523277M11[t] + e[t] |
| Multiple Linear Regression - Ordinary Least Squares | |||||
| Variable | Parameter | S.D. | T-STAT H0: parameter = 0 | 2-tail p-value | 1-tail p-value |
| (Intercept) | 0.688170796119973 | 0.1097 | 6.2732 | 0 | 0 |
| UITV | 4.03585428287288e-05 | 6e-06 | 6.502 | 0 | 0 |
| M1 | -0.178658012241435 | 0.056103 | -3.1845 | 0.002574 | 0.001287 |
| M2 | -0.202300754539509 | 0.056526 | -3.5789 | 0.000814 | 0.000407 |
| M3 | -0.153327146619087 | 0.054512 | -2.8127 | 0.007147 | 0.003574 |
| M4 | -0.0551540419778964 | 0.052647 | -1.0476 | 0.300173 | 0.150086 |
| M5 | -0.0856662083483208 | 0.053056 | -1.6146 | 0.113081 | 0.056541 |
| M6 | -0.107639433978710 | 0.053289 | -2.0199 | 0.049113 | 0.024556 |
| M7 | -0.159787456091427 | 0.056814 | -2.8125 | 0.007152 | 0.003576 |
| M8 | -0.087122734055486 | 0.053959 | -1.6146 | 0.113091 | 0.056545 |
| M9 | -0.0833698761445767 | 0.054202 | -1.5381 | 0.130719 | 0.065359 |
| M10 | -0.150402045585577 | 0.057166 | -2.631 | 0.011477 | 0.005739 |
| M11 | -0.076462993523277 | 0.054028 | -1.4152 | 0.16359 | 0.081795 |
| Multiple Linear Regression - Regression Statistics | |
| Multiple R | 0.709554219020798 |
| R-squared | 0.503467189730214 |
| Adjusted R-squared | 0.376692855193248 |
| F-TEST (value) | 3.97136527333462 |
| F-TEST (DF numerator) | 12 |
| F-TEST (DF denominator) | 47 |
| p-value | 0.000309492120214028 |
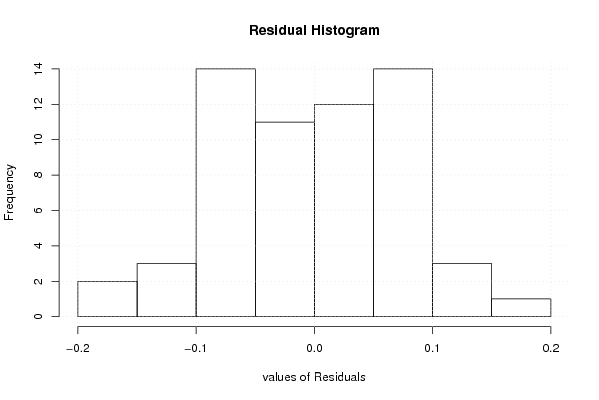
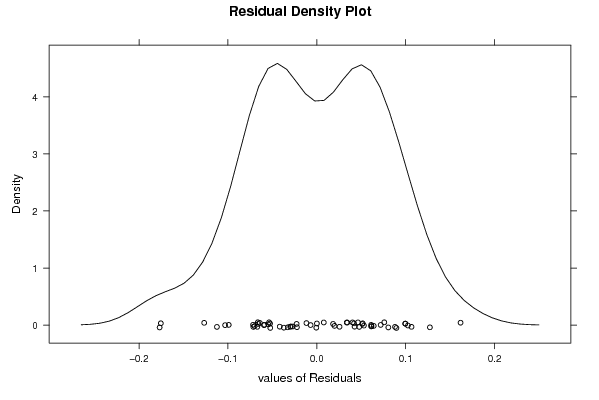
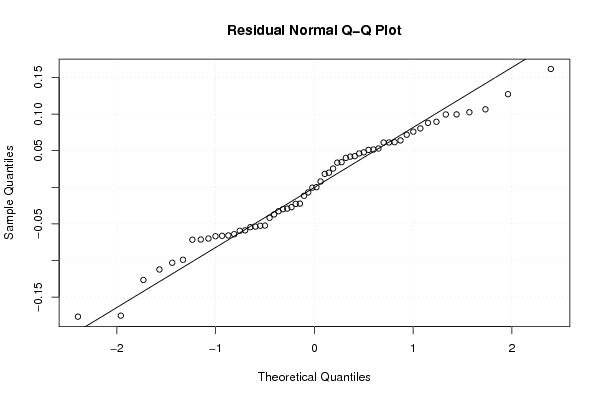
| Multiple Linear Regression - Residual Statistics | |
| Residual Standard Deviation | 0.0830072712216853 |
| Sum Squared Residuals | 0.32383973255651 |
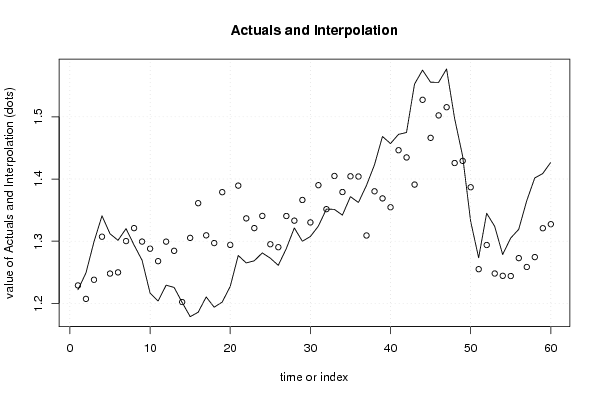
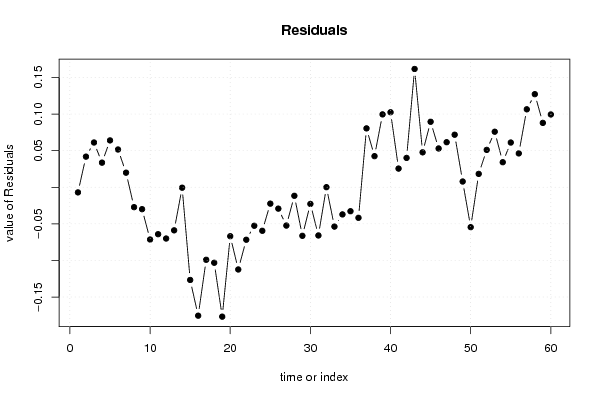
| Multiple Linear Regression - Actuals, Interpolation, and Residuals | |||
| Time or Index | Actuals | Interpolation Forecast | Residuals Prediction Error |
| 1 | 1.2218 | 1.22883116442354 | -0.0070311644235426 |
| 2 | 1.249 | 1.20715791901550 | 0.0418420809844953 |
| 3 | 1.2991 | 1.23790560899447 | 0.0611943910055266 |
| 4 | 1.3408 | 1.30718199697029 | 0.0336180030297057 |
| 5 | 1.3119 | 1.24788611785442 | 0.0640138821455796 |
| 6 | 1.3014 | 1.24982129299577 | 0.0515787070042294 |
| 7 | 1.3201 | 1.30017993381374 | 0.019920066186259 |
| 8 | 1.2938 | 1.32099200002333 | -0.0271920000233316 |
| 9 | 1.2694 | 1.29934722693212 | -0.0299472269321219 |
| 10 | 1.2165 | 1.28789280682056 | -0.0713928068205639 |
| 11 | 1.2037 | 1.26786102776045 | -0.064161027760452 |
| 12 | 1.2292 | 1.29926370821545 | -0.0700637082154532 |
| 13 | 1.2256 | 1.28448155913007 | -0.0588815591300718 |
| 14 | 1.2015 | 1.2020929218905 | -0.000592921890499267 |
| 15 | 1.1786 | 1.30529226795560 | -0.126692267955602 |
| 16 | 1.1856 | 1.36109697433519 | -0.175496974335193 |
| 17 | 1.2103 | 1.30940464468825 | -0.0991046446882518 |
| 18 | 1.1938 | 1.29696814272829 | -0.103168142728291 |
| 19 | 1.202 | 1.37883469793265 | -0.176834697932651 |
| 20 | 1.2271 | 1.29400424243376 | -0.0669042424337606 |
| 21 | 1.277 | 1.38935081329447 | -0.11235081329447 |
| 22 | 1.265 | 1.33668224924621 | -0.0716822492462143 |
| 23 | 1.2684 | 1.32100515695732 | -0.0526051569573221 |
| 24 | 1.2811 | 1.34058278436351 | -0.0594827843635058 |
| 25 | 1.2727 | 1.29507567662261 | -0.0223756766226131 |
| 26 | 1.2611 | 1.29030055309697 | -0.0292005530969688 |
| 27 | 1.2881 | 1.34044859461371 | -0.0523485946137073 |
| 28 | 1.3213 | 1.33297110583785 | -0.011671105837852 |
| 29 | 1.2999 | 1.36625772397108 | -0.0663577239710819 |
| 30 | 1.3074 | 1.33015497249636 | -0.0227549724963552 |
| 31 | 1.3242 | 1.39006244454760 | -0.0658624445476028 |
| 32 | 1.3516 | 1.35149902254757 | 0.000100977452432218 |
| 33 | 1.3511 | 1.40483235032357 | -0.0537323503235702 |
| 34 | 1.3419 | 1.37901836067355 | -0.0371183606735506 |
| 35 | 1.3716 | 1.40435765546150 | -0.0327576554614957 |
| 36 | 1.3622 | 1.40394569660461 | -0.0417456966046099 |
| 37 | 1.3896 | 1.30916080806984 | 0.0804391919301606 |
| 38 | 1.4227 | 1.38021535066509 | 0.0424846493349063 |
| 39 | 1.4684 | 1.36882468607659 | 0.0995753139234134 |
| 40 | 1.457 | 1.35452256770839 | 0.102477432291607 |
| 41 | 1.4718 | 1.44626046342047 | 0.025539536579529 |
| 42 | 1.4748 | 1.43468359842276 | 0.0401164015772375 |
| 43 | 1.5527 | 1.39102297786693 | 0.161677022133073 |
| 44 | 1.5751 | 1.52736944463232 | 0.0477305553676808 |
| 45 | 1.5557 | 1.46619347884037 | 0.0895065211596305 |
| 46 | 1.5553 | 1.50230967316103 | 0.0529903268389657 |
| 47 | 1.577 | 1.51545261630614 | 0.0615473836938626 |
| 48 | 1.4975 | 1.42568684362645 | 0.071813156373554 |
| 49 | 1.437 | 1.42915079175393 | 0.00784920824606702 |
| 50 | 1.3322 | 1.38673325533193 | -0.0545332553319334 |
| 51 | 1.2732 | 1.25492884235963 | 0.018271157640369 |
| 52 | 1.3449 | 1.29382735514827 | 0.0510726448517322 |
| 53 | 1.3239 | 1.24799105006577 | 0.0759089499342250 |
| 54 | 1.2785 | 1.24427199335682 | 0.0342280066431797 |
| 55 | 1.305 | 1.24389994583908 | 0.0611000541609212 |
| 56 | 1.319 | 1.27273529036302 | 0.0462647096369793 |
| 57 | 1.365 | 1.25847613060947 | 0.106523869390532 |
| 58 | 1.4016 | 1.27439691009864 | 0.127203089901363 |
| 59 | 1.4088 | 1.32082354351459 | 0.0879764564854073 |
| 60 | 1.4268 | 1.32732096718999 | 0.0994790328100148 |
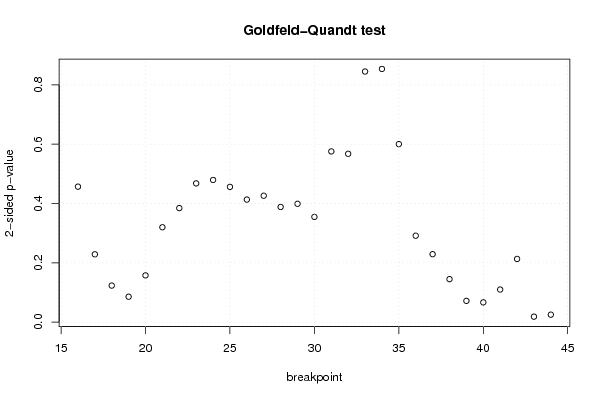
| Goldfeld-Quandt test for Heteroskedasticity | |||
| p-values | Alternative Hypothesis | ||
| breakpoint index | greater | 2-sided | less |
| 16 | 0.228370530517195 | 0.45674106103439 | 0.771629469482805 |
| 17 | 0.114355677288704 | 0.228711354577408 | 0.885644322711296 |
| 18 | 0.0616233384433073 | 0.123246676886615 | 0.938376661556693 |
| 19 | 0.0428238347305316 | 0.0856476694610631 | 0.957176165269468 |
| 20 | 0.0787840083789208 | 0.157568016757842 | 0.92121599162108 |
| 21 | 0.159916087815819 | 0.319832175631638 | 0.840083912184181 |
| 22 | 0.192217414941882 | 0.384434829883763 | 0.807782585058118 |
| 23 | 0.233895081461073 | 0.467790162922146 | 0.766104918538927 |
| 24 | 0.239647119822482 | 0.479294239644965 | 0.760352880177518 |
| 25 | 0.227945581582583 | 0.455891163165166 | 0.772054418417417 |
| 26 | 0.206625561295256 | 0.413251122590512 | 0.793374438704744 |
| 27 | 0.213079131474725 | 0.42615826294945 | 0.786920868525275 |
| 28 | 0.194162118806131 | 0.388324237612262 | 0.805837881193869 |
| 29 | 0.199502262655855 | 0.39900452531171 | 0.800497737344145 |
| 30 | 0.177367295229509 | 0.354734590459018 | 0.822632704770491 |
| 31 | 0.28778294799691 | 0.57556589599382 | 0.71221705200309 |
| 32 | 0.283796913494943 | 0.567593826989885 | 0.716203086505057 |
| 33 | 0.422469589023444 | 0.844939178046887 | 0.577530410976556 |
| 34 | 0.573174551232245 | 0.85365089753551 | 0.426825448767755 |
| 35 | 0.699885250627805 | 0.60022949874439 | 0.300114749372195 |
| 36 | 0.854323588968354 | 0.291352822063293 | 0.145676411031646 |
| 37 | 0.885460079743418 | 0.229079840513164 | 0.114539920256582 |
| 38 | 0.927551083783906 | 0.144897832432189 | 0.0724489162160944 |
| 39 | 0.96416795257407 | 0.0716640948518594 | 0.0358320474259297 |
| 40 | 0.966689453346832 | 0.0666210933063359 | 0.0333105466531679 |
| 41 | 0.945075069216602 | 0.109849861566795 | 0.0549249307833977 |
| 42 | 0.893480671860287 | 0.213038656279425 | 0.106519328139713 |
| 43 | 0.990780253239795 | 0.0184394935204105 | 0.00921974676020525 |
| 44 | 0.98745989235521 | 0.0250802152895798 | 0.0125401076447899 |
| Meta Analysis of Goldfeld-Quandt test for Heteroskedasticity | |||
| Description | # significant tests | % significant tests | OK/NOK |
| 1% type I error level | 0 | 0 | OK |
| 5% type I error level | 2 | 0.0689655172413793 | NOK |
| 10% type I error level | 5 | 0.172413793103448 | NOK |